Daylight Savings Calculation Technique for Smart Buildings
←
→
Page content transcription
If your browser does not render page correctly, please read the page content below
Intelligent Control and Automation, 2013, 4, 102-107
http://dx.doi.org/10.4236/ica.2013.41014 Published Online February 2013 (http://www.scirp.org/journal/ica)

          Daylight Savings Calculation Technique for Smart
                             Buildings
                                          Dariusz Kacprzak1, Ioan Tuleasca2
            1
             Department of Electrical and Computer Engineering, The University of Auckland, Auckland, New Zealand
                               2
                                 The Open Polytechnic of New Zealand, Lower Hutt, New Zealand
                                          Email: Ioan.Tuleasca@openpolytechnic.ac.nz

                      Received September 14, 2012; revised November 5, 2012; accepted November 12, 2012

ABSTRACT
This publication presents a technique of quantifying energy savings due to daylight. The technique is designated to be
used in smart buildings or similar applications where daylight harvesting is welcomed. The technique is divided into
three stages. In the first stage an optical sensor is evaluated for its P (power)-E (illumination) response characteristics.
In the second stage the calibration of room properties is carried out. In the final stage photometric calculations are per-
formed, and energy savings are calculated. The major advantage of the proposed approach is to determine energy sav-
ings during the design stage of a building, not after the building construction or retrofitting. The information obtained
from the calculations is useful for investors, future tenants and environmentalists.

Keywords: Interior Lighting; ELS Sensor; Energy Savings; CO2 Emissions; ETAP Appliances

1. Introduction                                                    cient paradigm of including daylight harvesting calcula-
                                                                   tions in electrical lighting designs. An example is pro-
It is common knowledge that lighting contributes to more
                                                                   vided where the Electrical and Computer Engineering
than 30% of the total energy consumption of a building.
                                                                   ECE Department of the University of Auckland is chosen
Nowadays lighting systems in so-called smart buildings
                                                                   for performing measurements due to its accessibility,
are optimised to ensure the minimum energy consump-
                                                                   familiarity and, most important, due to the availability of
tion. Such lighting systems are composed of energy effi-
                                                                   software modelling files “.DWG”. These files offer the
cient luminaires and daylight control, offering additional
                                                                   layout of given locations and are appropriate for use with
savings due to the natural light entering the building. In
                                                                   the lighting design software DIALux®. State of the art
some applications occupancy control is also present.
                                                                   appliances (ETAP luminaries and associated sensors/dim-
Comprehensive studies have been performed to ascertain
                                                                   ming ballasts from the Belgian company ETAP Electro
how daylight harvesting can contribute to, and increase,
                                                                   Technische Apparaten) and measuring equipment (power
energy savings in association with automated and manual
                                                                   meter, lux meter) are used for data gathering.
control systems. Using numerical [1,2] (RELUX, MAT-
LAB SIMULINK) and analytical methods [3-5], daylight
                                                                   2. Lighting Terminology, AS/NZS Standards,
utilization was analysed where dimming systems were
                                                                      Appliances and Measuring Equipment
generally ascertained to be the most suitable means for
integrating the sustainable development concept. Calibra-          The definitions of specific lighting quantities and their
ting the lighting system as well as continuing user and            depiction for an appropriate understanding of the de-
operator education were procedures deemed to be ex-                scribed assessment technique are subsequently presented.
tremely important when using sophisticated control sys-               Illuminance E
tems that include continuous daylight control and occu-               Illuminance (Figure 1) is the amount of light coming
pancy sensors [6]. A fuzzy logic based approach is de-             from a light fixture that lands on a surface. It is measured
scribed [7] and its implementation is analyzed in con-             in lux (lx).
junction with DIALux®. Since daylight is a dynamic,                   Luminance L
highly variable, season and location dependent, source of             Luminance describes the amount of light leaving a sur-
lighting, fuzzy logic may be a promising alternative to            face in a particular direction. Units: candela/m².
classical, mathematical modelling. In this paper the au-              Maintenance Factor
thors demonstrate a simple, straightforward and time effi-            The maintenance factor (light loss factor) is a value

Copyright © 2013 SciRes.                                                                                                  ICA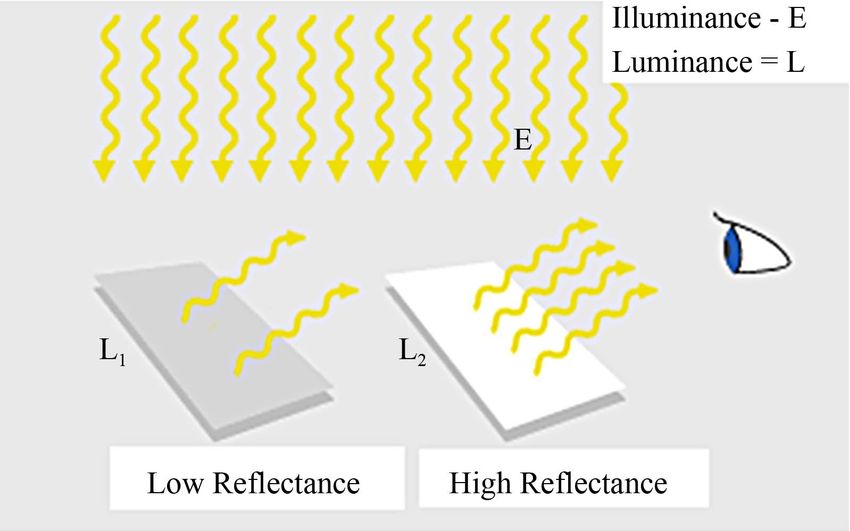
D. KACPRZAK, I. TULEASCA                                                     103

                                                                         Table 1. Lighting levels on the workplane.

                                                                 Type of Interior or Activity      Maintained Illuminance [lx]
                                                                General tasks involving typing,
                                                                                                              320
                                                                     reading and writing
                                                                       Computer rooms                         320
                                                                           Corridors                           80
                                                                             Stairs                            80
                                                                 Light level on the carpet/floor               80

               Figure 1. Lighting quantities.

designed to account for the reduction in light output from
a lighting system due to ageing, dirt and dust on the light
fittings.
    Reflection Coefficient
    The reflection coefficient (reflectance) is used to cal-
culate the amount of light transmitted through a medium
if the only losses considered are reflection losses.
    Uniformity Level
    The uniformity level is a dimensionless quantity that
represents the ratio of Emin Eaverage .
    Standards
   The prescriptions of the Australian/New Zealand Stan-
dard™ (AS/NZS 1680.0:2008) and of the New Zealand
                                                                                       Figure 2. Luminaire.
Green Building Council (NZGBC) were used for design
purposes [8]. Table 1 presents the illuminance levels on       for this project maintains a maximum illuminance level
the workplane according to the Interior and Workspace          of approximately 500 lx at all times and operates at a vol-
Lighting for Educational and Training Facilities section       tage range of 1 - 10 V. Figure 4 show a sensor on a lu-
of the Standard.                                               minaire (4a) and the layout of a complete unit (4b).
    Luminaire L                                                   The sensor has a measuring field of ø3 meters at a
    A luminaire is a complete light unit consisting of         height of 2.8 meters. It takes into account the luminance
lamps, reflectors and other parts that hold the lamp in        of the available daylight and of other artificial sources
place and protect it. Choosing luminaires with the right       along with the reflection coefficient of the material pre-
type of lamp and reflector type, which efficiently pro-        sent underneath. The dimming electronic ballast reduces
vides the appropriate lighting patterns, is also an impor-     the amount of current entering the lamp in accordance
tant part of energy efficient lighting design. Figure 2        with the information received from the sensor.
shows a typical luminaire arrangement [9].                        Power Meter
    Ballast                                                       A power meter provides the power reading of the lu-
    Ballast is a device used to start a lamp by providing a    minaire. When used in connection with a sensor the power
shot of voltage and also control the current flow during       readings vary due to the amount of daylight available.
its operation. There are 2 types of ballasts, magnetic and        Lux Meter
electronic. The electronic ones are preferred more be-            A lux meter (Figure 5, next to a power meter) pro-
cause of their robustness and improved functionality and       vides the illuminance reading in locations of choice.
efficiency. The dimming ballast [10] reduces the amount
of current entering the lamp in accordance with the day-       3. Power P versus Illuminance E
light available and helps reduce power usage. A typical           Characteristic for an ELS Sensor
dimming ballast is depicted in Figure 3.                          Equipped ETAP Luminaire
    Sensor
    The sensor, clipped onto the luminaire, regulates and      A novel technique is proposed where a sensor’s power P
shuts down the artificial light output in accordance with      versus illuminance E curve is determined and subse-
the level of natural light available [11]. The sensor used     quently used in inferring the power (energy consumption)

Copyright © 2013 SciRes.                                                                                                    ICA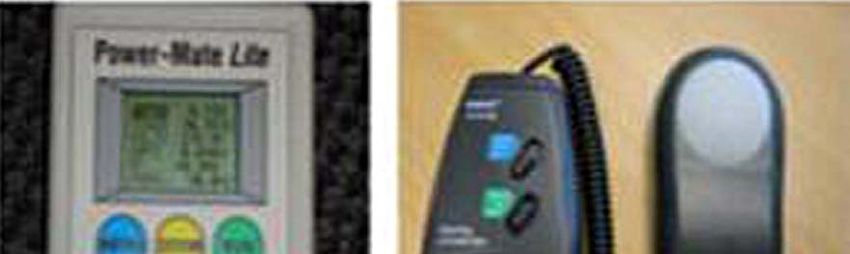
104                                         D. KACPRZAK, I. TULEASCA

                                                                       Figure 5. Power meter and lux meter.

                                                            of the luminaire-sensor unit, for various levels of daylight
                                                            affected illuminance E.
                                                               To illustrate the concept measurements were perfor-
                                                            med by placing an ELS (ETAP Lightig control System)
                                                            sensor equipped ETAP luminaire (one lamp fixture) onto
                                                            the ceiling at a height of 2.8 m, as specified in Standards.
                                                            Illuminance E, as seen by the ELS sensor, was varied,
                    Figure 3. Ballast.                      and the corresponding ETAP luminaire active power P
                                                            measured (Figure 6). The measurements were performed
                                                            using a lux meter that measured the illuminance E at the
                                                            ELS sensor’s height, and a power meter, that measured
                                                            the corresponding active power P of the ETAP luminaire.
                                                            On the workplane the illuminance was maintained ac-
                                                            cording to Standards.
                                                               The dependency P/E is the basis for accurately evalu-
                                                            ating the energy consumed by a particular sensor/lumi-
                                                            naire based lighting system designed using specialized
                                                            lighting software (in this instance ELS sensor/ETAP lu-
                                                            minaire unit and DIALux® software).

                                                            4. DIALux® Features
                                                            For the purpose of the present research an open lighting
                                                            simulation software, DIALux®, was selected and used.
                                                            The software supports luminaire data for numerous glo-
                           (a)                              bal manufacturers in the form of “plugins” as well as
                                                            “.DWG” file format that enables the user to reproduce/
                                                            use/transfer analyzed location’s dimensions accurately.
                                                            Some of DIALux® essential features are:
                                                            - it can simulate daylight for different weather patterns;
                                                            - it can take into account the geographical location of
                                                               the model to simulate the season’s weather patterns as
                                                               well as the analyzed location’s position in respect to
                                                               the sun;
                                                            - it has the unique capability of incorporating interior
                                                               and exterior objects taking into account their reflec-
                                                               tion coefficients and interference in the spread of
                                                               light;
                                                            - it provides a variety of useful lighting design quanti-
                           (b)                                 ties, like luminance L, average illuminance Eaverage,
Figure 4. (a) Sensor attached to luminaire; (b) Graphical      uniformity level, that allow an adequate description of
depiction of a complete unit.                                  the task.

Copyright © 2013 SciRes.                                                                                           ICA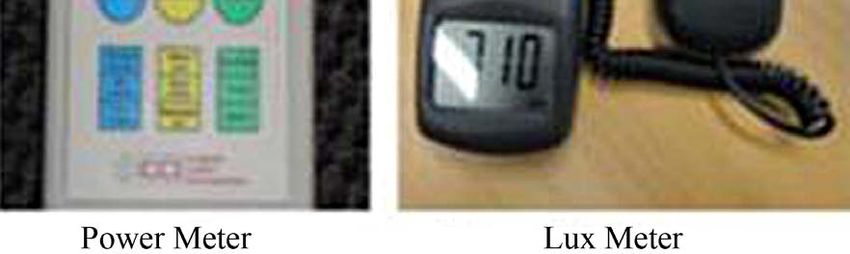
D. KACPRZAK, I. TULEASCA 105
Table 2. Key DIALux® parameters.
Parameter Value
Workplane height 0.7 m
Maintenance factor 0.77
Floor—20%
Reflection coefficient Walls—50%
Ceiling—70%
Wall zone 0.5 m
Figure 6. P versus E for an ELS sensor equipped ETAP
luminaire.
Some key parameters set in DIALux® for the purpose
of the present research are presented in Table 2.
5. Performed Measurements and Associated
Modelling
Areas within ECE department were analyzed and specific
design improvements were proposed for a chosen loca-
tion (Undergraduate Lab UG4). UG4 lighting system
consists of 34 luminaires, each possessing two T5 lamps
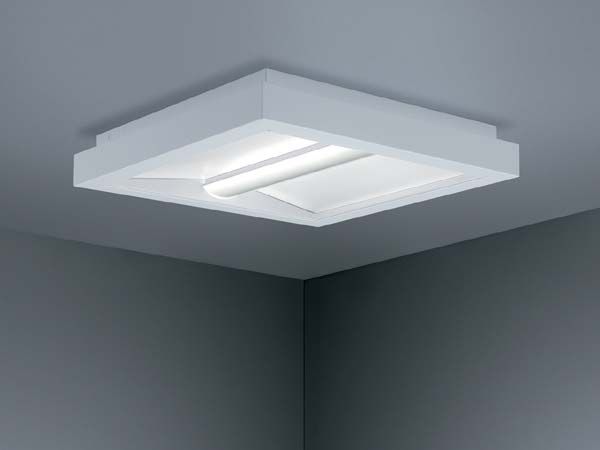
Figure 7. ETAP luminaire.
with a total active power of 28 W × 2 = 56 W, and a 5 W
ballast. The lab also has 3 windows that allow daylight to
supplement lighting.
According to Standards a minimum of 320 lux must be
maintained on the workplane (0.7 m height). The lumi-
naires consume full power throughout the working day (9
am to 6 pm).
A superior lighting system ultimately comprising ELS
sensors equipped ETAP luminaires (one lamp fixture, Fig-
ure 7) is proposed and analysed. The system complies
with the illuminance level on the workplane required by
Figure 8. DIALux® model for UG4.
Standards while providing significant energy savings.
The following steps were undertaken during the analy-
Following changes, simulation results became identi-
sis process.
cal with direct measurements (Figure 10).
5.1. DIALux® Calibration Process
5.2. UG4 Lab Analysis for the Existing Lighting
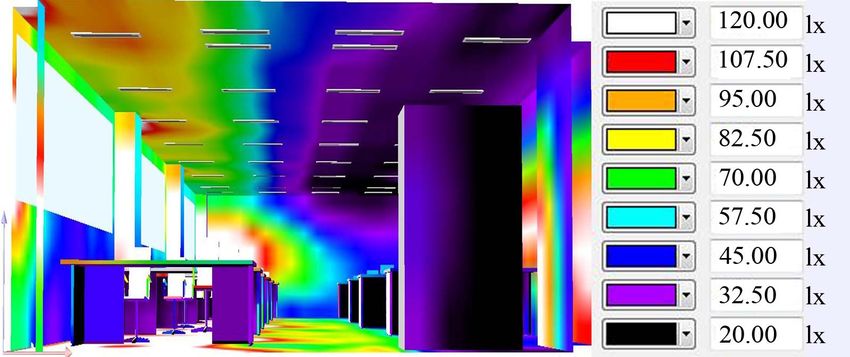
Measurements of the illuminance E are performed at System
workplane level 0.7 m throughout UG4 at various dis-
After the DIALux® calibration process for UG4 lab is
tances from windows, with main lights turned off, and
concluded an analysis is undertaken for the present light-
registered.
ing system (power per luminaire 61 W, 34 luminaires,
Using a DIALux® model for the lab based on the cor-
260 working days per year, 9 working hours per day) and
responding. DWG file (Figure 8) a simulation is under-
the yearly energy consumption is calculated (E1UG4 =
taken (lights turned off) and the illuminance results are
4853.16 kWh).
superimposed on the results obtained from measurements
(Figure 9, where “Clear Sky” relates to outdoors condi-
5.3. UG4 Lab Analysis for a One Lamp
tions).
Equipped, ETAP Luminaire, Lighting
It can be seen that the DIALux® based results are dif-
System
ferent from the ones obtained by direct measurements.
To address this issue changes were implemented in the Another analysis is performed this time for a lighting
DIALux® settings as presented in Table 3. system composed of 34, one lamp equipped, ETAP lu-
Copyright © 2013 SciRes. ICA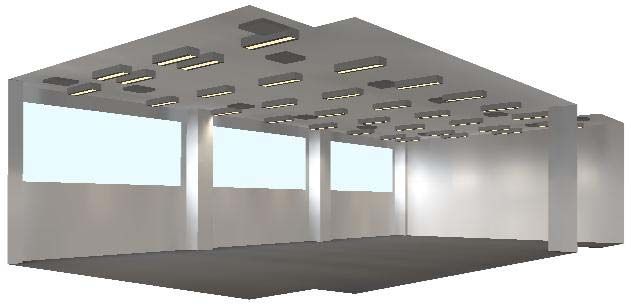
106                                             D. KACPRZAK, I. TULEASCA

                                                                  E1···E34 of each of the 34 luminaires positions in the
                                                                  UG4 lab (main lights turned off) is inferred from the
                                                                  DIALux® graphic model (Figure 11);
                                                              - using the correlation P/E in Figure 6 the power
                                                                  P1···P34 is determined for E1···E34;
                                                              - the energy consumption is then determined accord-
                                                                  ingly, for 260 working days per year, 9 working hours
                                                                  per day (E3UG4 = 1958 kWh).
                                                                 The results for energy consumption correlated with as-
                                                              signed weather patterns are displayed in Table 4.

          Figure 9. Real time versus DIALux® results.         6. Financial Savings and Environmental
                                                                 Impact
             Table 3. Altered DIALux® parameters.
                                                              Considering the cost per kWh of energy as described in
        Parameter           Old Value         New Value
                                                              [13], that is $0.235/kWh, the financial costs for one year
 Window transparency           90%               30%          are depicted in Figure 12, from where it can be inferred
      Pollution factor         0.8                0.5         that the operating cost of UG4 can be reduced by $680.4
                                                              per year. The total cost of retrofitting UG4 using the ELS
                                                              sensor/ETAP luminaire (one lamp fixture) new lighting
                                                              system amounts to $2380 and can be recovered in 3.5
                                                              years.
                                                                 In order to assess the reduction in the amount of CO2
                                                              the energy savings generate, from [14] it is determined
                                                              that for every kWh of electricity consumed a quantity of
                                                              0.23 Kg of CO2 is produced. The results obtained are
                                                              presented in Figure 13.
                                                                 It is ascertained that the proposed ELS sensor/ETAP
                                                              luminaire (one lamp fixture) new lighting system con-
                                                              tributes to an annual reduction of 665.9 Kg in CO2 emis-
Figure 10. Real time versus DIALux® results after calibra-    sions.
tion.                                                            The data used for Figures 12 and 13 are summarized
                                                              in Table 5.
minaires (power per luminaire 33 W, 34 luminaires, 260
working days per year, 9 working hours per day). The
yearly energy consumption is E2UG4 = 2625.48 kWh.

5.4. UG4 Lab Analysis for ELS Daylight Sensor,
     One Lamp Equipped, ETAP Luminaires,
     Lighting System
Even if DIALux® cannot perform comprehensive simu-
lations for daylight sensors—dimming ballasts equipped
luminaires an interactive process is proposed that takes         Figure 11. Determining illuminance E levels in UG4.
advantage of both DIALux® capabilities and the correla-
tion P/E depicted in Figure 6.                                     Table 4. Energy data for the ELS sensor system.
   For this lighting system DIALux® settings are corre-
                                                               Weather pattern   Working days   Power [W]   Energy [kWh]
lated with seasonal weather patterns, characteristic to
UG4 geographical location, that were retrieved from a             Clear sky          128           670         771.84
New Zealand national provider web site [12] and aggre-
                                                                  Mixed sky           54           820         398.52
gated.
   The interactive process consists of:                           Overcast            78          1122         787.64
- for DIALux® corresponding weather patterns (clear
                                                                    Total            260          2612          1958
    sky, mixed, overcast), the 2.8 m height illuminance

Copyright © 2013 SciRes.                                                                                                ICA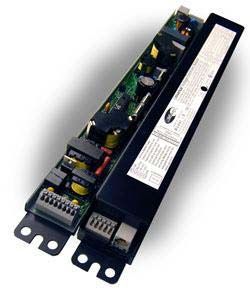
D. KACPRZAK, I. TULEASCA                                                    107

                                                                                  REFERENCES
                                                              [1]   K. R. Shailesh and T. S. Raikar, “Computational Analysis
                                                                    of Daylight Harvesting Scheme in an Office Building in
                                                                    Mumbai,” IEEE International Conference on Sustainable
                                                                    Energy Technologies, Kandy, 6-9 December 2010.
                                                              [2]   S. G. Colaco, C. P. Kurian, V. I. George and A. M. Co-
                                                                    laco, “An Approach to Energy Harvesting for Building
                                                                    Automated Control System,” XXXII National Systems
                                                                    Conference, Roorkee, 17-19 December 2008.
                                                              [3]   G. Parise and L. Martirano, “Daylight Impact on Energy
                                                                    Performance of Internal Lighting,” IEEE-IAS, Annual
                                                                    Meeting, Orlando, 9-13 October 2011.
  Figure 12. Annual costs and financial savings for UG4.      [4]   R. Leslie, R. Raghavan, O. Howlett and C. Eaton, “The
                                                                    Potential of Simplified Concepts for Daylight Harvest-
                                                                    ing,” 2012.
                                                                    http://www.lrc.rpi.edu/programs/daylighting/pdf/simplifie
                                                                    dConcepts.pdf
                                                              [5]   California Energy Commission’s Public Interest Energy
                                                                    Research (PIER) Program, “Daylight Harvesting Made
                                                                    Simple,” 2012.
                                                                    http://www.energy.ca.gov/2008publications/CEC-500-20
                                                                    08-067/CEC-500-2008-067-FS.PDF
                                                              [6]   C. DiLouie, “Why Do Daylight Harvesting Projects Suc-
                                                                    ceed or Fail?” 2012.
                                                                    http://lightingcontrolsassociation.org/why-do-daylight-har
                                                                    vesting-projects-succeed-or-fail/
                                                              [7]   A. Cziker, M. Chindris and A. Miron, “Implementation of
           Figure 13. CO2 emissions and savings.                    Fuzzy Logic in Daylighting Control,” 11th International
                                                                    Conference on Intelligent Engineering Systems, Budapest,
      Table 5. Costs and CO2 emissions and savings.                 29 June-2 July 2007.
                                Financial    CO2 emission     [8]   Standards, Australia/New Zealand Standards, 2009.
       Lighting system
                               figures [$]   figures [Kg]     [9]   Lighting ETAP, 2012.
       Existing system           1140.5            1116.2           http://www.etaplighting.com/level2.aspx?seq=86&seqpict
                                                                    ure=1365&name=Lighting&LangType=1033
       ETAP luminaire             617              603.9
                                                              [10] Tridonic Technical Data, 2012.
  ELS sensor/ETAP luminaire      460.1             450.3           http://www.tridonic.com/com/en/download/data_sheets/D
           Savings               680.4             665.9           S_PCA_T5_ECO_HE_en.pdf
                                                              [11] ETAP Lighting, “Light Controls ELS/DALI-ELS,” 2012.
7. Conclusion                                                      http://www.etaplighting.com/uploadedFiles/Downloadabl
                                                                   e_documentation/documentatie/ELS_en.pdf
A novel technique to design smart building lighting sys-      [12] Auckland Weather Averages, 2012.
tems or evaluate existing ones, based on a three steps             http://www.climatetemp.info/new-zealand/
approach that includes daylight harvesting (optical sensor    [13] Contact Energy, 2012.
P/E characteristic evaluation, room properties calibration,        http://www.contactenergy.co.nz/web/saveenergy/applianc
photometric and energy savings calculations), is pro-              es
posed and tested in conjunction with a specialized light-     [14] CO2 Emissions, “Carbon Dioxide Generated in kg/MWh,”
ing design software (DIALux®) [15]. The results show an            UNEP, Senoko, 2007.
improvement in energy utilization, since important en-        [15] DIALux®. http://www.dialux.software.informer.com/
ergy savings were obtained, resulting in significant finan-
cial and CO2 savings. The approach is highly advanta-
geous for designers, investors, future tenants and envi-
ronmentalists.

Copyright © 2013 SciRes.                                                                                                 ICA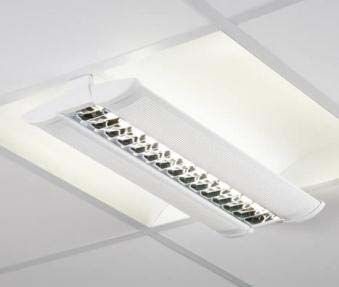
You can also read