Measurements at laser materials processing machines: spectrum deconvolution including uncertainties and model selection - JSSS
←
→
Page content transcription
If your browser does not render page correctly, please read the page content below
J. Sens. Sens. Syst., 10, 13–18, 2021
https://doi.org/10.5194/jsss-10-13-2021
© Author(s) 2021. This work is distributed under
the Creative Commons Attribution 4.0 License.

         Measurements at laser materials processing machines:
           spectrum deconvolution including uncertainties
                         and model selection
                                   Rolf Behrens1 , Björn Pullner1 , and Marcel Reginatto2
                1 Department  Radiation Protection Dosimetry, Physikalisch-Technische Bundesanstalt (PTB),
                                      Bundesallee 100, 38116 Braunschweig, Germany
                       2 Department Neutron Radiation, Physikalisch-Technische Bundesanstalt (PTB),

                                      Bundesallee 100, 38116 Braunschweig, Germany
                                    Correspondence: Rolf Behrens (rolf.behrens@ptb.de)

          Received: 7 September 2020 – Revised: 9 January 2021 – Accepted: 12 January 2021 – Published: 18 February 2021

       Abstract. Laser materials processing of workpieces using ultra-short pulsed lasers can lead to unwanted X-ray
       emission. Their dose rate and spectral distribution have been precisely determined. The measurements were car-
       ried out using a thermoluminescence detector (TLD)-based spectrometer in which 30 TLD planes are arranged
       one behind the other, the first 10 layers made of polymethyl methacrylate, while the remaining 20 layers are
       interspaced by absorbers with, from the front to the back, increasing atomic charge and thickness. The pene-
       tration depth of the radiation into the spectrometer depends on its energy, so that the energy-resolved spectrum
       of the radiation can be calculated from the TLD dose values by means of mathematical methods (Bayesian de-
       convolution). The evaluation process also takes into account both the uncertainties of all input quantities and the
       possibility of adopting different models for the spectrum form. This allowed the resulting spectra to be associated
       with their realistic uncertainty.
          The measurements are traceable to the Système international d’unités (SI), i.e. the International System of
       Units. The results not only provide manufacturers and users of ultra-short pulsed lasers with important infor-
       mation on the design of the machines with regard to radiation protection, but were also included in the recently
       concluded legislative procedure in the field of radiation protection in Germany.

1   Background, motivation, and objective                          range and the measurement of X-rays emitted in an indus-
                                                                   trial laser materials processing environment in terms of ab-
Ultra-short pulsed lasers have been developed in the last          solute spectra and operational dose equivalent with the focus
decades for both research and various applications (Mulser         on radiation protection. At the present time, this objective
and Bauer, 2010). In some of these applications, the main          is more important from a research point of view as current
purpose is the production of ionizing radiation, with laser in-    industrial laser materials processing machines are equipped
tensities at the focus of the order of up to 1022 W/cm2 . Much     under normal conditions with a housing that is very effec-
lower intensities have been in use for materials processing        tive for shielding the low-energy radiation emerging from
without the production of ionizing radiation (Momma et al.,        the machines. The results are relevant to developers of the
1996). However, in the last few years, larger intensities of       machines also operating them without housing, to legislative
up to the order of 1014 W/cm2 have been in use for materi-         bodies, and as a basis for future investigations of radiation
als processing, resulting in an unwanted production of ioniz-      from laser machines with even higher intensities.
ing radiation (Gerhard et al., 2016; Nolte et al., 2016). The
objective of this research is twofold, the validation of the
spectrometer in the presence of photons in the low-energy

Published by Copernicus Publications on behalf of the AMA Association for Sensor Technology.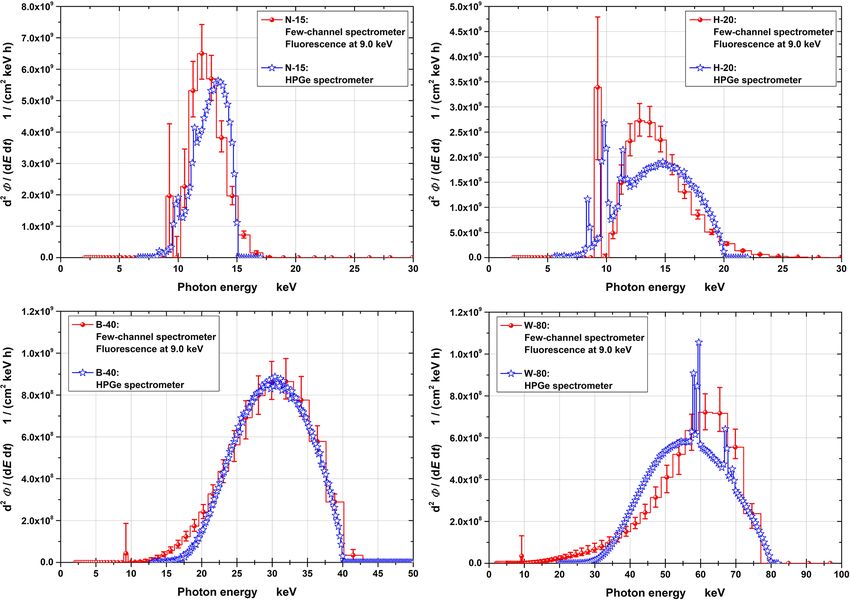
14                       R. Behrens et al.: Measurements at laser materials processing machines: spectrum deconvolution

Figure 1. Sketch of the TLD-based spectrometer. Basic principle: the deeper the radiation penetrates the spectrometer, the higher its energy.

Figure 2. Experimental setup of the two performed measurement series.

2    Measurements and data evaluation                                    formation for the photon spectra was included in the data
                                                                         evaluation: (i) a smooth rise with increasing energy due to
                                                                         the fact that there was at least about 10 cm of air absorption
For the measurements, a thermoluminescence detector                      between the laser focus and the spectrometer front; (ii) an
(TLD)-based few-channel spectrometer was used (see Fig. 1)               exponential decrease at higher energies (due to well-known
(Behrens and Ambrosi, 2002; Behrens, 2009). The penetra-                 laser–plasma interaction mechanisms); and (iii) a peak in the
tion depth of the X-ray radiation in the spectrometer depends            spectrum at the energy of the characteristic fluorescence ra-
on the energy, so that the energy-resolved and absolute spec-            diation of the workpiece material. The method of analysis is
trum of the radiation, including the uncertainties of the spec-          outlined in detail in Appendix A as well as in the literature
trum, can be determined from the dose values in the TLD                  (Behrens et al., 2019; Behrens and Reginatto, 2019).
layers by means of mathematical methods (Bayesian decon-
volution).
   The experimental setup is shown in Fig. 2; the main
laser parameters were a wavelength of 1030 nm, an aver-                  3   Validation of the data evaluation
age power of 78 W, a pulse energy of 195 µJ, a pulse length
(full width at half maximum) of 924 fs, a repetition rate of             To ensure that the evaluation method is reliable, the spec-
400 kHz, and a focus diameter of 16 µm at a focus intensity of           trometer was irradiated in four known reference radiation
2.1×10¹⁴ W/cm2 ; further experimental parameters are listed              fields of different photon energies. Figure 3 shows the spec-
in Table 1. A Bayesian data evaluation was performed us-                 tra from the corresponding data evaluation compared to the
ing the WinBUGS software (Lunn et al., 2010) which, be-                  results measured with a high-purity germanium spectrome-
sides the photon spectrum, also supplies the corresponding               ter (Ankerhold et al., 1999; Ankerhold, 2000). The radiation
uncertainties and coverage intervals. The following prior in-            fields are specified in an ISO standard (ISO, 2019).

J. Sens. Sens. Syst., 10, 13–18, 2021                                                         https://doi.org/10.5194/jsss-10-13-2021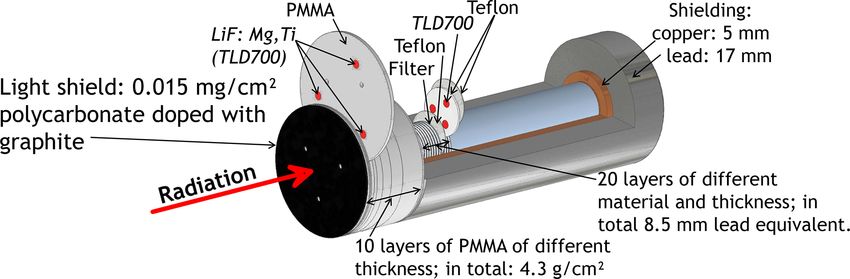
R. Behrens et al.: Measurements at laser materials processing machines: spectrum deconvolution 15
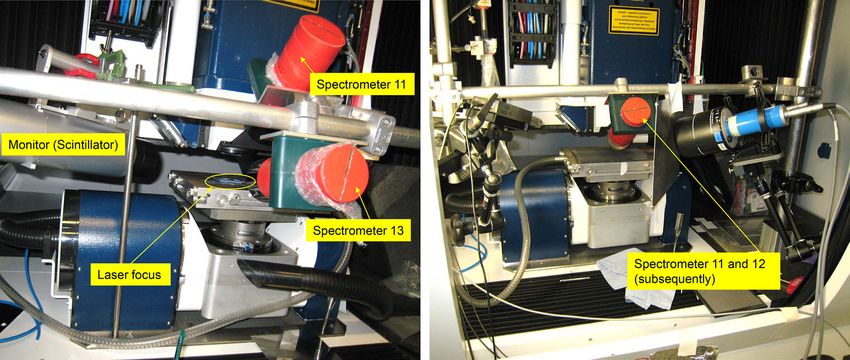
Figure 3. Comparison of the spectra measured with the few-channel spectrometer (red line) and those measured with the high-purity ger-
manium spectrometer (blue lines). Meaning of the uncertainty bars: the value of the spectral fluence is usually located with a probability of
approximately 95 % in the assigned coverage interval.
Table 1. Details of the experiments.
Parameter First setup Second setup
Spectrometer 11 Spectrometer 13 Spectrometer 11 Spectrometer 12
Workpiece material Tungsten Steel (St37) Alloy∗
Workpiece thickness 0.2 mm 6 mm
Workpiece condition Plane parallelism and flatness not Plane parallelism and flatness
specified approximately 15 µm
Frequency of workpiece processing One time Up to seven times
at the same surface position
Angle relative to workpiece surface 46◦ 13◦ 31◦
Distance x of the spectrometer front 17 cm 9.76 cm
from the laser focus
Effective irradiation time 2.6 h 3.1 h 2.2 h
∗ 92.5 % mass fraction tungsten; 3.75 % mass fraction iron; 3.75 % mass fraction nickel.
https://doi.org/10.5194/jsss-10-13-2021 J. Sens. Sens. Syst., 10, 13–18, 2021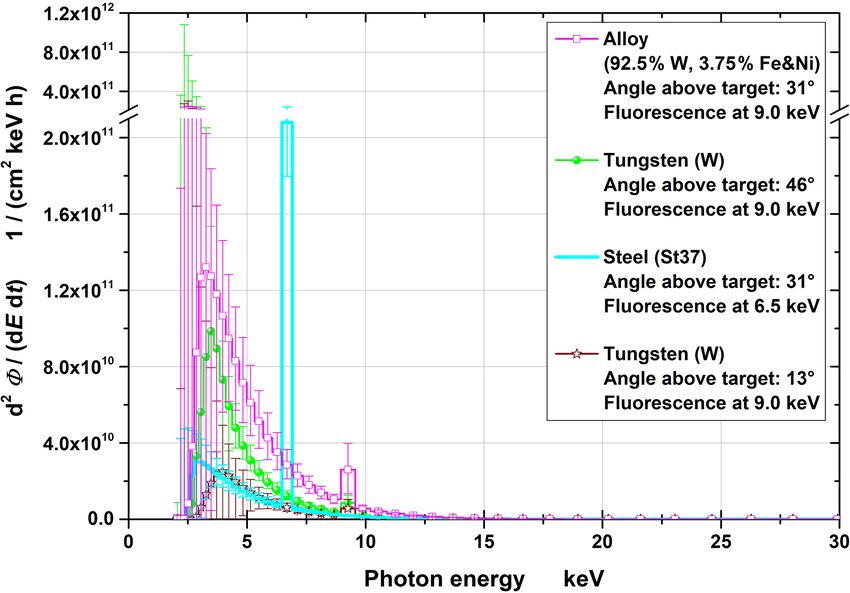
16                        R. Behrens et al.: Measurements at laser materials processing machines: spectrum deconvolution

                                                                       Fortunately, in the normal case, the laser processing is per-
                                                                       formed in a laser protection housing, which is sufficient to
                                                                       absorb the photons. If, however, the laser intensity in materi-
                                                                       als processing rises in the future, the laser protection housing
                                                                       may no longer be sufficient to shield the photons.

                                                                       5   Conclusions

                                                                       The measurements performed, traceable to the Système in-
                                                                       ternational d’unités (SI), not only provide manufacturers
                                                                       and users of ultra-short pulsed lasers with important ra-
                                                                       diation protection information for the design of machines,
                                                                       but have also provided important input for recent legisla-
                                                                       tive procedures in the field of radiation protection in Ger-
                                                                       many (StrlSchG, 2017; StrlSchV, 2018). Meanwhile, ma-
Figure 4. Photon fluence spectra (normalized to 1 h effective irra-    chines with even higher laser intensities are already under
diation time and 10 cm distance) together with their 95 % coverage     development. Therefore, the measuring method presented
intervals. Note the broken ordinate.                                   here will become even more relevant in the future – espe-
                                                                       cially for cases in which laser intensities reach more than
                                                                       1014 W/cm2 . Then, significantly higher energies and larger
   The 95 % coverage intervals were determined from the
                                                                       dose rates would be expected, resulting possibly in signifi-
probability distribution for each energy channel, which is cal-
                                                                       cant doses outside of the machine’s housings and leading to
culated as part of the Bayesian data evaluation. Thus, they
                                                                       radiation protection issues.
incorporate the information about the measurement used for
the data evaluation, i.e. the prior information described in
Sect. 2.
   Apart from a slight shift in the spectra’s maximum, these
are quite well reproduced with the few-channel spectrom-
eter as compared to the spectra obtained using the germa-
nium spectrometer. The shift is mainly present when sig-
nificant characteristic lines from the X-ray anode material
are contained in the spectrum – indicating the limits of the
few-channel spectrometer’s energy resolution. Furthermore,
the absolute magnitude of the spectra is in good agreement,
demonstrating the capability for an absolute dose determina-
tion.

4    Results

Figure 4 shows the absolute photon fluence spectra per ma-
terials processing time together with their 95 % coverage in-
tervals for the four measurements normalized to a distance
of 10 cm from the workpiece. The mean energies vary from
about 4 to 6 keV. The photons significantly contributing to
the dose extend to about 25 keV.
    The fluence spectra were converted to dose equivalent us-
ing the corresponding conversion coefficients (ICRU, 1998;
Behrens, 2017). The resulting dose rate depends on the pro-
cessed material and its nature, varying from 1600 to 8300,
from 17 to 76 mSv/h, and from 1 to 4 mSv/h, for the quan-
tities Ḣ 0 (0,07), Ḣ 0 (3), and Ḣ ∗ (10), respectively. Such high
dose rates would exceed legal dose limits within a few min-
utes to 1 h (for the local skin dose estimated by Ḣ 0 (0,07) and
the eye-lens dose estimated by Ḣ 0 (3)) or a few hours (for
the effective dose of the whole body estimated by Ḣ ∗ (10)).

J. Sens. Sens. Syst., 10, 13–18, 2021                                                      https://doi.org/10.5194/jsss-10-13-2021
R. Behrens et al.: Measurements at laser materials processing machines: spectrum deconvolution 17
Appendix A: Details of the Bayesian spectrum the energy where the spectrum drops to zero. In total, these
deconvolution are 12 parameters, of which 4 depend on other parameters
(mrise , brise , mdrop , and bdrop ), while Efluor is a constant
Equation (A1) represents a mathematical description of the (6.5 keV was chosen for targets made of steel, corresponding
experiment and thus the basic formula to be solved to obtain to the rounded mean energy of the Kα and Kβ emission
the fluence spectrum from the measured data: lines from iron and 9 keV for targets made of tungsten or the
alloy containing more than 90 % tungsten, corresponding
D meas ≈ R · 8 = D calc , (A1) to the rounded mean energy of the Lα and Lβ emission
Dmeas, 1
lines from tungsten). The remaining seven free parameters
.. were determined from the data using a program written
with measured doses D meas = , calculated re-
. with the Bayesian software WinBUGS (Lunn et al., 2010).
Dmeas, N Appropriate initial values and ranges within which the
R1, 1 · · · R1, M optimization process was allowed to vary the parameters
sponses R = ... .. .. , and fluences 8 = were chosen for the evaluation carried out by WinBUGS.
. .
RN, 1 · · · RN, M
81
..
. . The use of the symbol ≈ is meant to indicate that
8M
a strict equality is not achievable in practice due to uncer-
tainties associated with the measurement. The analysis of
the data was carried out using N = 13 TLD layers. (The
spectrometer consists of 30 TLD layers; however, significant
doses above a few µGy were measured only in the first 13 lay-
ers, which, thus, provided the data points for the evaluation.)
The fluence was binned into M = 60 energy channels (with
logarithmically increasing mean energy, as the energy reso-
lution gets worse as the energy increases; 60 channels were
chosen to cover the range from 2 to 100 keV photon energy
and to obtain the desired energy resolution of about 5 keV at
the upper limit).
The data, Dmeas , and the response matrix, R, are known: R
was calculated using Monte Carlo radiation transport simula-
tion package EGS4 (Nelson et al., 1985; Namito et al., 1995;
Bielajew and Rogers, 1987), while the fluences, 8(E), are
determined from the Bayesian analysis.
0 for E < Erise, start
afluor · δ (E − Efluor ) + aexp · exp sexp · E
· {1 + cos [(E · mrise + brise ) · π]} /2
for Erise, start < E < Erise, end
afluor · δ (E − Efluor ) + aexp · exp sexp · E
8 (E) = for Erise, end < E < Edrop, start (A2)
· δ (E −
afluor Efluor ) + aexp · exp
sexp
·E
· 1 − cos E · mdrop + bdrop · π /2
for Edrop, start < E < Edrop, end
0 for Edrop, end < E
afluor is the amplitude of the fluorescence radiation, Efluor
the energy of the fluorescence radiation, aexp the am-
plitude of the exponential decay, sexp the slope of the
exponential decay, mrise = 1/ Erise, end − Erise, start , brise =
−mrise · Erise, end , mdrop = −1/ Edrop, end − Edrop, start ,
bdrop = −mdrop · Edrop, end , Erise, start the energy where the
rise of the spectrum starts, Erise, end the energy where the
spectrum turns into the exponential decay, Edrop, start the
energy where the drop of the spectrum starts, and Edrop, end
https://doi.org/10.5194/jsss-10-13-2021 J. Sens. Sens. Syst., 10, 13–18, 202118 R. Behrens et al.: Measurements at laser materials processing machines: spectrum deconvolution
Code availability. The WinBUGS code is available at https:// with High Fluence Rates, Radiat. Prot. Dosim. 101, 73,
www.mrc-bsu.cam.ac.uk/software/bugs/the-bugs-project-winbugs/ https://doi.org/10.1093/oxfordjournals.rpd.a006062, 2002.
(WinBUGS, 2021). Behrens, R. and Reginatto, M.: Bayesian Spectrum Deconvolution
Including Uncertainties and Model Selection: Application to X-
Ray Emission Data Using WinBUGS, Radiat. Prot. Dosim., 185,
Data availability. The data are not available as they contain de- 157–167, https://doi.org/10.1093/rpd/ncy286, 2019.
tails from the laser machine’s internal design and are therefore the Behrens, R., Pullner, B., and Reginatto, M.: X-Ray Emission from
property of the laser machine’s owner, i.e. TRUMPF Laser GmbH. Materials Processing Lasers, Radiat. Prot. Dosim. 183, 361–374,
https://doi.org/10.1093/rpd/ncy126, 2019.
Bielajew, A. and Rogers, D. W. O.: PRESTA: The Parame-
Author contributions. RB contributed to the research plan, car- ter Reduced Electron-Step Transport Algorithm for Electron
ried out the measurements, performed the data evaluation, and Monte Carlo Transport, Nucl. Instrum. Methods, 18, 165,
wrote the manuscript. BP contributed to the research plan and https://doi.org/10.1016/S0168-583X(86)80027-1, 1987.
mainly performed the measurements. MR contributed to the data Gerhard, C., Viöl, W., and Wieneke, S.: Plasma-Enhanced Laser
evaluation and the manuscript. Materials Processing, Plasma Science and Technology, Progress
in Physical States and Chemical Reactions, Tetsu Mieno, Inte-
chOpen, London, available at: https://cdn.intechopen.com/pdfs/
49531.pdf (last access: 16 February 2021), 2016.
Competing interests. The authors declare that they have no con-
International Commission on Radiation Units and Measurements
flict of interest.
(ICRU): Conversion Coefficients for use in Radiological Pro-
tection against External Radiation, ICRU Report 57, ICRU,
Bethesda, https://doi.org/10.1093/jicru/os29.2.Report57, 1998.
Special issue statement. This article is part of the special issue International Organization for Standardization (ISO): Radiologi-
“Sensors and Measurement Science International SMSI 2020”. It cal protection, X and gamma reference radiation for calibrat-
is a result of the Sensor and Measurement Science International, ing dosemeters and doserate meters and for determining their
Nuremberg, Germany, 22–25 June 2020. response as a function of photon energy – Part 1: Radiation char-
acteristics and production methods, ISO 4037-1, 2019.
Lunn, D. J., Thomas, A., Best, N., and Spiegelhalter, D.:
Financial support. This research has been supported by WinBUGS – a Bayesian modelling framework: Con-
TRUMPF Laser GmbH, Aichhalder Straße 39, 78713 Schramberg, cepts, structure, and extensibility, Stat. Comput., 10, 325,
Germany (grant no. 1W-63010 (2018-04-04)). https://doi.org/10.1023/A:1008929526011, 2010.
Momma, C., Chichkova, B. N., Nolte, S., von Alvensleben, F.,
This open-access publication was funded Tünnermann, A., Welling, H., and Wellegehausen, B.: Short-
by the Physikalisch-Technische Bundesanstalt. pulse laser ablation of solid targets, Opt. Commun., 129, 134,
http://dx.doi.org/10.1016/0030-4018(96)00250-7, 1996.
Mulser, P. and Bauer, D.: High Power Laser-Matter In-
Review statement. This paper was edited by Thomas Fröhlich teraction, Springer, Berlin and Heidelberg, Germany,
and reviewed by two anonymous referees. https://doi.org/10.1007/978-3-540-46065-7, 2010.
Namito, Y., Ban, S., and Hirayama, H.: LSCAT: Low-Energy
Photon-Scattering Expansion for the EGS4 Code, National Lab-
References oratory for High Energy Physics, Report KEK Internal 95-10, 51
pp., Tsukuba, Japan, 1995.
Ankerhold, U.: Catalogue of X-ray spectra and their characteristic Nelson, W. R., Hirayama, H., and Rogers, D. W. O.: The EGS4
data – ISO and DIN radiation qualities, therapy and diagnostic Code System, Report SLAC-265, Stanford Linear Accelerator
radiation qualities, unfiltered X-ray spectra, PTB report Dos-34, Center, 398 pp., Virginia, 1985.
https://doi.org/10.7795/110.20190315B, 2000. Nolte, S., Schrempel, F., and Dausinger, F.: Ultrashort
Ankerhold, U., Behrens, R., and Ambrosi, P.: X-ray spectrometry of pulse laser technology, Laser sources and applications,
low energy photons for determining conversion coefficients from Springer, Cham, Heidelberg, New York, Dordrecht, London,
air kerma, Ka , to personal dose equivalent, Hp (10), for radiation https://doi.org/10.1007/978-3-319-17659-8, 2016.
qualities of the ISO narrow spectrum series, Radiat. Prot. Dosim., StrlSchG: Radiation Protection Act of 27 June 2017, (BGBl. 1966),
81, 247 https://doi.org/10.1093/oxfordjournals.rpd.a032591, as last amended by Article 5 of the Act of 23 October 2020
1999. (BGBl. 2232), 2017.
Behrens, R.: A spectrometer for pulsed and continuous photon StrlSchV: Radiation Protection Ordinance of 29 November 2018,
radiation, J. Instrum., 4, P03027, https://doi.org/10.1088/1748- (BGBl. 2034, 2036), as last amended by Article 1 of the Ordi-
0221/4/03/P03027, 2009. nance of 20 November 2020 (BGBl. 2502), 2018.
Behrens, R.: Conversion coefficients for H 0 (3;) for photons, J. Ra- WinBUGS: WinBUGS code, University of Cambridge, MRC
diol. Prot., 37, 354, https://doi.org/10.1088/1361-6498/aa51e8, Biostatistics Unit, available at: https://www.mrc-bsu.cam.ac.uk/
2017. software/bugs/the-bugs-project-winbugs/, last acess: 16 Febru-
Behrens, R. and Ambrosi, P.: A TLD-based Few-channel ary 2021.
Spectrometer for Mixed Photon, Electron, and Ion Fields
J. Sens. Sens. Syst., 10, 13–18, 2021 https://doi.org/10.5194/jsss-10-13-2021You can also read