Identification of Urban Canyons in the City of São Paulo from Landsat 8 Images
←
→
Page content transcription
If your browser does not render page correctly, please read the page content below
Proceeding Paper

Identification of Urban Canyons in the City of São Paulo from
Landsat 8 Images †
Victor Siqueira Ferreira, Leticia Sabo Boschi and Guilherme Henrique Barros de Souza *

 Campus of Rosana, São Paulo State University (Unesp), 19274-000 Rosana, Brazil;
 victor.siqueira@unesp.br (V.S.F.); leticia.sabo@unesp.br (L.S.B.)
 * Correspondence: guilherme.barros@unesp.br; Tel.: +55-18-32849600
 † Presented at the 3rd International Electronic Conference on Geosciences, 7–13 December 2020;
 Available online: https://iecg2020.sciforum.net/#.

 Abstract: Cities in the last century have been suffering from the disorderly and unplanned growth
 of urban centers. Consequently, innumerable environmental problems started to plague these re-
 gions, one of them is the alteration of the surface temperature through the generation of heat islands
 and the urban canyons, caused by the alterations in the natural landscape. Based on OLI and TIRS
 images from the Landsat 8 satellite, a soil cover map was generated, an image of Surface Tempera-
 ture (ST) and the NDBI index, which highlight built-up areas, verifying and identifying urban can-
 yon regions of São Paulo. From the results of the correlation of low, medium, and high waterproof-
 ing areas generated by the soil cover map with the soil temperature images and the NDBI index,
 areas of medium waterproofing that had a (ST) similar to the areas of low waterproofing (28 to 31 °C).
 In this case, the areas of medium waterproofing should resemble the regions of high waterproofing
 (34 to 37 °C). Such regions have, as a main characteristic, a low index of trees and a greater number
 of constructions, which causes an increase in temperature (heat islands). In this case, it is observed
Citation: Ferreira, V.S.; Boschi, L.S.; that the regions of medium waterproofing are influenced by the height and spacing of the buildings,
Souza, G.H.B.d. Identification of which generate wind corridors and shading of the surface, decreasing the temperature of the region
Urban Canyons in the City of São
 and generating urban canyons. Thus, it is concluded that it is possible to identify regions of urban
Paulo from Landsat 8 Images.
 canyons through multispectral and thermal images. The methodology used allows a diagnosis of
Environ. Sci. Proc. 2021, 5, 17.
 the islands of heat islands and urban canyons and to evaluate actions taken in these areas in order
https://doi.org/10.3390/IECG2020-
 to mitigate the problems that such phenomena can cause, mainly related to the population’s climate
08911
 and health.
Academic Editor: Jesus Martinez
Frias Keywords: remote sensing; urban canyons; surface temperature

Published: 7 December 2020

Publisher’s Note: MDPI stays neu- 1. Introduction
tral with regard to jurisdictional
 Nowadays, our cities have a high growth in their area, due to the population increase
claims in published maps and institu-
 and the rural exodus that has been happening over the years. This population growth in
tional affiliations.
 urban centers, when it occurs in an uncontrolled and unplanned way can lead to problems
 in urban planning of cities, with that many problems start to plague these regions, such
 as infrastructure problems, problems with shortages and resource management for all,
Copyright: © 2020 by the authors. and problems with housing and environmental [1].
Licensee MDPI, Basel, Switzerland. When it comes to this urban growth of a region, one of the environmental problems
This article is an open access article that can be generated are the heat islands, which consist of an increase in the temperature
distributed under the terms and con- of the region, caused by the way that humans use this region, where areas with greater
ditions of the Creative Commons At- density urban areas tend to reach higher temperatures than more wooded areas and with
tribution (CC BY) license (http://cre- less construction. This phenomenon occurs due to the waterproofing of the soil through
ativecommons.org/licenses/by/4.0/). insulating materials (concrete, asphalt, metal, stones, etc.) and causes the phenomenon of

Environ. Sci. Proc. 2021, 5, 17. https://doi.org/10.3390/IECG2020-08911 www.mdpi.com/journal/environsciproc
Environ. Sci. Proc. 2021, 5, 17 2 of 8

 heat islands, where there is an increase of some degrees in the region due to human inter-
 ference in this area [2].
 Another phenomenon that can occur in large urban centers is that of islands of fresh-
 ness, defined by the decrease in temperature in a region and caused by characteristics of
 the city’s morphology. This morphology ranges from the afforestation of a region and the
 presence of water bodies, as well as the influence of height and spacing that large build-
 ings can have. This position of the buildings, in addition to forming a wind corridor, can
 also generate shading of the surface. This morphology leads to a decrease in the tempera-
 ture of these regions [3–5].
 The phenomenon of islands of freshness in many methodologies is also called an ur-
 ban canyon, since the buildings surrounding it start to have the behavior of the geological
 formation of a canyon, where valley areas would be created by the buildings that would
 represent the walls of this canyon. This valley, due to the shading that the buildings cause,
 has access to reduced solar irradiation and with that its surface temperature tends to de-
 crease, making that region colder than the other regions of a city [6].
 When addressing the subject of surface temperature, it must be understood that it is
 related to the wavelength of the infrared. Our eyes are not able to detect differences in this
 range of the spectrum, so, for the determination and analysis of soil temperature, sensors
 have been developed, capable of detecting the thermal infrared radiation, allowing to
 evaluate the temperature of objects taking into account the heat flow given depending on
 the energy that reaches and leaves a specific target. With the use of this technology, we
 are able to evaluate and monitor soil temperature values in certain regions, important in-
 formation to study the thermal conditions of the environment and their relationship with
 the type of soil cover and how human interference can modify the environment [7,8].
 Given the above, the present work aims to identify and understand the phenomenon
 of urban canyons in a region of the city of São Paulo—SP, from the ground cover map, an
 image of Surface Temperature (TS) and the NDBI index, generated from multispectral
 (OLI) and thermal (TIRS) images from the Landsat 8 satellite.

 2. Experiments
 This work was developed in the city of São Paulo, Brazil, which is in the state of the
 same name and has a territorial area of 1,521,110 km2. The municipality has an estimated
 population of 12,252,023 inhabitants and is considered one of the largest urban densities
 in the country with a demographic density of 7398.26 inhabitants/km2, the country’s fi-
 nancial center and one of the largest cities in Latin America [9]. More specifically, the
 study area involves areas that belong to the Central Zone of São Paulo and the neighbor-
 hoods surrounding that region, mainly neighborhoods belonging to the West, East, and
 South Zone that border the neighborhoods in the Central Zone of the city.
 According to the Köppen Climate Classification, the city of São Paulo is classified as
 type Cwa (subtropical or tropical altitude climate), having as main characteristic a sum-
 mer characterized as a hot and humid season with high rainfall, having moderately high
 temperatures (with an average of 22.8 °C). The city has a winter marked as a dry season
 with low rainfall and moderately low temperatures (with an average of 16.7 °C) [10].
 In this study, multispectral bands acquired by the OLI sensor and the thermal band
 acquired by the TIRS sensor were used, both from the Landsat 8 satellite. The images were
 acquired free of charge on the USGS website (https://earthexplorer.usgs.gov/ acessed in:
 06/11/2019) and the chosen date was 21 January 2019, the middle of the summer season
 and one of the hottest months of the year. According to INMET (National Institute of Me-
 teorology), during the day 21 January 2019 the temperature of the city presented an aver-
 age of 23 °C, and throughout the day it registered a maximum temperature of 33 °C and
 minimum of 22 °C [11].
 To identify and carry out the analysis of the formation of urban canyons in the city
 of São Paulo, image processing was carried out in the Geographic Information System
 QGIS 2.18.20.
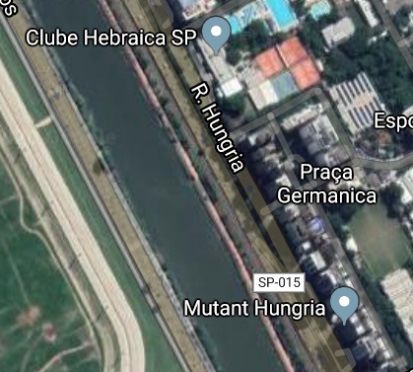
Environ. Sci. Proc. 2021, 5, 17 3 of 8

 In the first step, the Land Surface Temperature Plugin complement algorithms were
 used to convert digital numbers (ND) into radiance and surface brightness values, both
 starting from band 10 (thermal). Parallel to the brightness temperature data, an image of
 Normalized Difference Vegetation Index (NDVI) was generated through the multispectral
 bands 4 (red) and 5 (near infrared) and from the NDVI data, the surface emissivity was
 estimated through the mathematical algorithm “Zang, Wang et al’s LSE algorithm”. In the
 sequence, the values of the surface brightness temperature and emissivity were applied
 in the Planck Equation, generating a surface temperature map of the studied region [12–14].
 The flowchart showed in Figure 1 exemplifies the process of generating a surface
 temperature (ST) image.

 Figure 1. Methodological flowchart.

 The second stage dealt with the image classification process by producing a land
 cover map. For the classification, the plugin Dzetsaka Classification Tool was used in Qgis
 and the bands 4 (red), 5 (near infrared), and 6 (near infrared) of the Landsat 8 satellite.
 Next, the RGB composition was performed and the classes to be mapped were defined,
 they were: water body (Figure 2), vegetation (Figure 3), low waterproofing (Figure 4), me-
 dium waterproofing (Figure 5), high waterproofing (Figure 6). The supervised classifica-
 tion was carried out using the model of Gaussian mixtures and, for that, polygonal sam-
 ples were selected that represented the classes of interest [15].
 In sequence, the classes of interest are characterized.
 Water body
 Regions of water bodies in the image, featuring rivers, lakes, ponds in the region.

 Figure 2. Example of water body area (Pinheiros River).
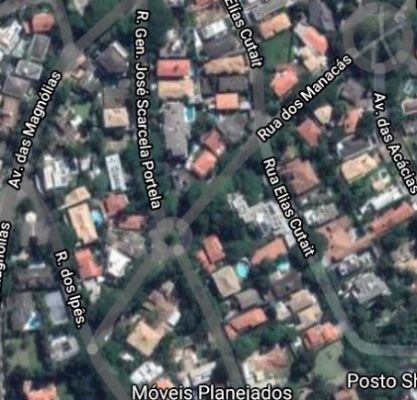
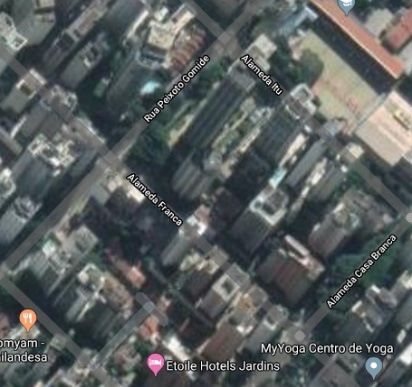
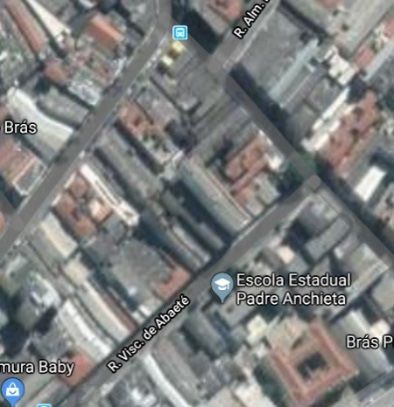
Environ. Sci. Proc. 2021, 5, 17 4 of 8

 Vegetation
 Regions with dense vegetation, with characteristic areas of forests, forests, parks, en-
 vironmental preservation areas.

 Figure 3. Example of vegetation area (Ibirapuera Park).

 Low waterproofing areas
 That would be areas with characteristics of regions predominantly of low buildings,
 a large afforestation, large areas of vegetation, and little waterproofing of the soil.

 Figure 4. Example of low waterproofing area (Cidade Jardim neighborhood).

 Areas of medium waterproofing
 That would be characterized in mixed areas where they have bigger constructions,
 an average afforestation, having the presence of some trees and vegetation.

 Figure 5. Example of medium waterproofing area (Jardim Paulista neighborhood).

 High waterproofing areas
 It is characterized as densely populated areas, with the presence of little or no vege-
 tation, the presence of large buildings, a high waterproofing of the soil with concrete, steel,
 asphalt.
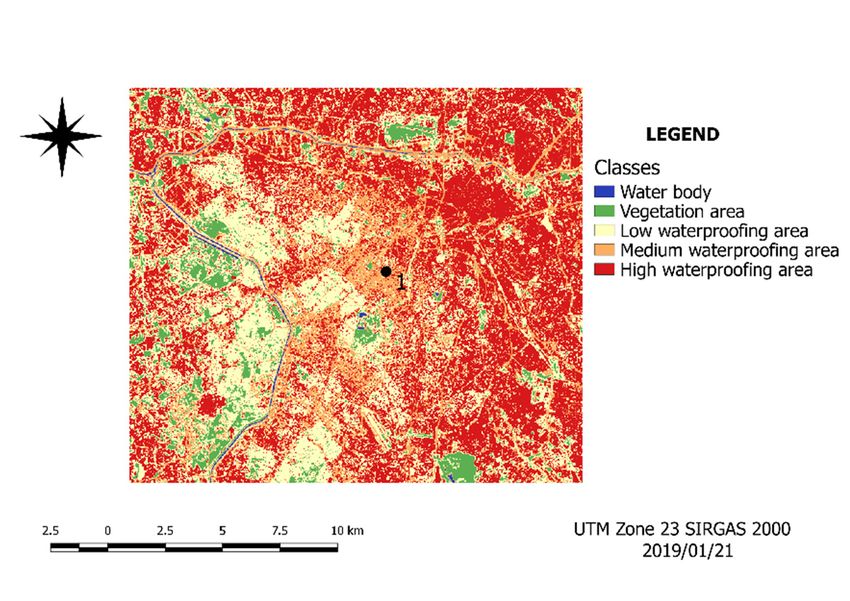
Environ. Sci. Proc. 2021, 5, 17 5 of 8

 Figure 6. Example of high waterproofing area (Brás neighborhood).

 In the third stage, the Normalized Difference Built-Up Index spectral index (NDBI)
 was generated, which aims to highlight the areas where there is greater spectral reflection,
 better demarcating areas of human construction of an image. The NDBI produces an im-
 age with values from −1 to 1 where the highest values represent the built areas and the
 lowest values represent non-built areas [16,17]. The NDBI calculation was performed on
 the Qgis raster calculator using the values of bands 5 (near infrared) and band 6 (medium
 infrared). The NDBI index is defined by the equation:
 5

 6

 3. Results and Discussion
 In this item, the results obtained from the processing will be presented and discussed.
 Figure 7 represents the land cover classification map from bands 4, 5, and 6, for the date
 of 21 January 2019.

 Figure 7. Land cover map of the study area.

 Figure 8 represents the NDBI index from bands 5 and 6, for the date of 21 January
 2019.
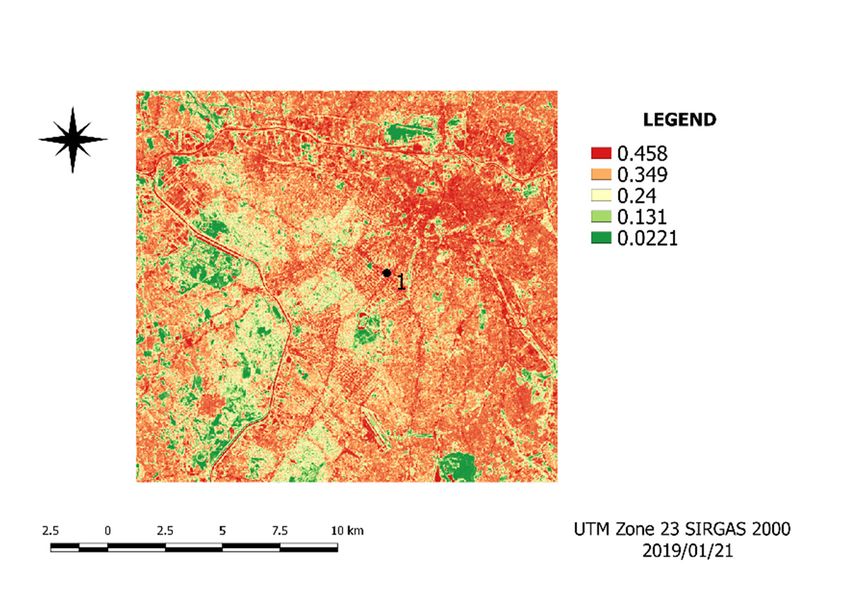
Environ. Sci. Proc. 2021, 5, 17 6 of 8

 Figure 8. NDBI index of the study area.

 Figure 9 represents the surface temperature map (ST) generated from a thermal im-
 age, for the date of 21 January 2019.

 Figure 9. ST map of the study area.

 According to INMET, the municipality of São Paulo had an average temperature of
 23 °C on 21 January 2019 [11]. When analyzing the ST map generated in the QGIS software
 for the image of 21 January 2019, temperature values between 28 and 37 °C were identified
 in the study area (Figure 9). Note the predominance of areas of temperatures between 34
 and 37 °C. When looking for these same areas in the soil cover map (Figure 7) and in the
 NDBI index (Figure 8), it is observed that the areas were classified as high waterproofing,
 which has little or no afforestation and presented an urbanization index (NDBI) ranging
 from 0.349 to 0.458. This high temperature is a result of the materials used in construction,
 which are characterized by high heat retention. Due to the removal of vegetation from the
 region and the substitution by materials that waterproof the soil, such as concrete, glass,
 asphalt, metal, there is a specific increase in temperature in the area [7].
 When identifying the regions of temperatures between 31 and 34 °C (Figure 9), in the
 soil cover map (Figure 7) it appears that these were classified as areas of average water-
 proofing and presented values between 0.349 and 0.458 in the index NDBI (Figure 8).
Environ. Sci. Proc. 2021, 5, 17 7 of 8

 When comparing regions in Figure 9, where temperatures between 28 and 31 °C were
 found, with the soil cover map (Figure 7), it is noted that these regions were classified as
 areas of low waterproofing and vegetation and, when comparing with the NDBI index,
 we found values between 0.131 and 0.0221 (Figure 8).
 However, there are some exceptions to the situation described above. In Figures 7–9,
 point 1 located in the Avenida Paulista region was highlighted. When we analyze this
 region on the TS map, we find values between 28 and 31 °C, which was the temperature
 found in the low waterproofing and vegetation classes, however, when analyzing point 1
 on the soil cover map, we verify that the area average waterproofing was classified (Figure 7).
 Analyzing the behavior of the phenomenon of heat islands, areas of medium waterproof-
 ing should have temperatures more similar to those of high waterproofing areas than
 those of low waterproofing or vegetation, since they are characterized by having little or
 no vegetation and large constructions, making it resemble areas of high waterproofing.
 The phenomenon observed in point 1 is called an urban canyon or an island of fresh-
 ness, since the buildings around it start to behave in the geological formation of a canyon,
 where valley areas would be created by the buildings that would represent the walls of
 that canyon. This valley, due to the shading that the buildings cause, has access to reduced
 solar irradiation and, as a result, its surface temperature tends to decrease, making that
 region colder than the other areas of medium waterproofing in the city [6,18].

 4. Conclusions
 The analyzes carried out by of thermal images from Landsat 8 made it possible to
 identify a region of urban cold island in the study area (Point 1 of Figures 7–9). It was
 possible to verify an urban canyon, in an area such as Avenida Paulista, characterized by
 the greatest urban density. This is due to the high buildings and the little spacing among
 them, which create passageways and causes the temperature values of this area on the ST
 map to be lower than those of surrounding regions also classified as average waterproofing.
 The method presented in this work allows the diagnosis of areas with urban canyons
 and heat islands, as well as the evaluation of actions taken to mitigate these effects. The
 applications of this study can impact studies that deal with urban planning, thermal com-
 fort, and health, especially respiratory problems.

 Author Contributions: All authors contributed to this work, in particular their individual contribu-
 tions are: conceptualization L.S.B.; methodology L.S.B. and V.S.F.; validation and formal analysis
 V.S.F., L.S.B., and G.H.B.d.S.; writing original draft V.S.F. and review and editing L.S.B. and
 G.H.B.d.S. All authors have read and agreed to the published version of the manuscript.
 Institutional Review Board Statement: Not applicable.
 Informed Consent Statement: Not applicable.
 Data Availability Statement: Publicly available datasets were analyzed in this study. This data can
 be found here: https://earthexplorer.usgs.gov/.
 Conflicts of Interest: The authors declare no conflicts of interest.

 Abbreviations
 ST Surface Temperature
 USGS United States Geological Survey
 OLI Operational Land Imager
 TIRS Thermal Infra-Red Scanner
 Qgis Quantum GIS
 NDBI Normalized Difference Built-Up Index
 NDVI Normalized Difference Vegetation Index
Environ. Sci. Proc. 2021, 5, 17 8 of 8

References
1. PAULO. Rodolfo Fares. Crescimento Urbano Desordenado: O papel do Estado e da Sociedade diante dos impactos socioambientais; Editora
 Fi: Porto Alegrers, Brazil, 2018. Available online: https://www.univem.edu.br/arquivos/Livro%20Rodolfo%20Fares.pdf (ac-
 cessed on 15 March 2020).
2. Gartland, L. Ilhas de calor: Como mitigar zonas de calor em áreas urbanas; Oficina Textos: São Paulo, Brazil, 2010.
3. Barros, H.R.; Lombardo, M.A. A ilha de calor urbana e o uso e cobertura do solo em São Paulo SP. Geousp Espaço e Tempo 2016,
 20. ISSN 2179-0892. Available online: http://www.revistas.usp.br/geousp/article/view/97783 (accessed on 12 March 2020).
4. Germano, P.J.M.M.T. Investigação multitemporal de ilhas de calor e de frescor em Maringá, Paraná, utilizando imagens do
 satélite landsat 5–2000 a 2010. Master’s Thesis, Universidade Estadual de Maringá, Maringá, Brazil, 2012. Available online:
 http://www.peu.uem.br/Discertacoes/PauloMonteiro.pdf (accessed on 9 February 2020).
5. Oke, T.R. Canyon geometry and the nocturnal urban heat island: Comparison of scale model and field observations. Int. J.
 Climatol. 1981, 237–254. Available online: https://rmets.onlinelibrary.wiley.com/doi/abs/10.1002/joc.3370010304 (accessed on 16
 March 2020).
6. de Fátima Ferreira, L.; Carrilho, S.T.; Mendes, P.C. Áreas Verdes Urbanas: Uma Contribuição Aos Estudos Das Ilhas De Frescor.
 Braz. Geogr. J. Geosci. Humanit. Res. Medium 2015, 6, 101–120.
7. Jensen, J.R. Sensoriamento Remoto do Ambiente: Uma Perspectiva em Recursos Terrestres, 2nd ed.; Parêntese: São José dos Campos-
 SP, Brazil, 2009.
8. Florenzano, T.G. Imagens de Satélite para Estudos Ambientais, 11st ed.; Pearson Education Brasil Ltd.: São José dos Campos, Brazil,
 2013.
9. IBGE—Instituto Brasileiro de Geografia e Estatística. Censo 2010. Brasília, 2016. Available online: http://ibge.gov.br (accessed
 on February 2020).
10. Kottek, M.; Grieser, J.; Beck, C.; Rudolf, B.; Rubel, F. World Map of the Köppen-Geiger climate classification updated. Meteorol.
 Z. 2006, 15, 259–263, doi:10.1127/0941-2948/2006/0130.
11. Instituto Nacional de Meteorologia (INMET). 2019. Available online: http://www.inmet.gov.br/portal/index.php?r=tempo/graficos
 (accessed on February 2020).
12. Isaya Ndossi, M.; Avdan, U. Application of Open Source Coding Technologies in the Production of Land Surface Temperature
 (LST) Maps from Landsat: A PyQGIS Plugin. Remote Sens. 2016, 8, 413, doi:10.3390/rs8050413.
13. Bourscheidt, V. Análise da influência do uso do solo nas variações de temperatura utilizando imagens MODIS e LANDSAT 8.
 Simpósio Brasileiro de Sensoriamento Remoto (SBSR) 2015, 17, 6750–6756. ISBN 978-85-17-00076-8. Available online:
 http://www.dsr.inpe.br/sbsr2015/files/p1480.pdf (accessed on 11 October 2019).
14. Pereia, C.T.; Lima, R.S.; Bourscheidt, V. Estimativa sazonal da temperatura de superfície e identificação de Ilhas de Calor Urbana
 na Região Portuária de Santos—SP. In XVIII Simpósio Brasileiro de Sensoriamento Remoto; INPE: Cuiabá-Mato Grosso, Brazil, 2017.
15. De Oliveira, U.C.; Teixeira, L.F.C.; Soares, F.F.; Mendonça, P.S.; Mendes, J.C.A. Avaliação Do Uso Do Solo e Cobertura Vegetal
 Na Zona De Amortecimento Do Parque Nacional De Ubajara, Em Ubajara, Ceará. X Congresso Brasileiro de Gestão Ambiental.
 Fortaleza Ceará, 07 November 2019. Available online: https://www.ibeas.org.br/congresso/Trabalhos2019/XI-095.pdf (accessed
 on 13 November 2020).
16. Sousa, M.T. Análise do NDBI como método para classificar áreas construídas para os anos de 2000 e 2010 nos municípios de São José dos
 Campos, Jacareí e Arapeí, São Paulo; INPE: Cuiabá-Mato Grosso, Brazil, 2010; pp. 4–7. Available online:
 http://wiki.dpi.inpe.br/lib/exe/fetch.php?media=cst-310-popea:monografia_monicasousa-trabfinal.pdf (accessed on 18 Novem-
 ber 2020).
17. Zha, Y.; Gao, J.; Ni, S. Use of normalized difference built-up index in automatically mapping urban areas from TM imagery. Int.
 J. Remote. Sens. 2003, 24, 583–594.
18. De Barros, H.R. A relação entre a ilha de calor, uso e cobertura do solo e o balanço de energia no município de São Paulo:
 Avaliação do campo térmico nos parques públicos de lazer. Ph.D. Thesis, Curso de Geografia Física, Departamento de
 Geografia, Universidade de São Paulo-Usp, São Paulo, Brazil, 2016. Available online: https://teses.usp.br/teses/dis-
 poniveis/8/8135/tde-27092016151701/publico/2016_HugoRogerioDeBarros_VCorr.pdf (accessed on 16 November 2020).
You can also read