Book Chapter Coordinated Voltage Control in Distribution Network with the Presence of DGs and Variable Loads Using Pareto and Fuzzy Logic - Vide Leaf
←
→
Page content transcription
If your browser does not render page correctly, please read the page content below
Advances in Energy Research

Book Chapter

Coordinated Voltage Control in
Distribution Network with the Presence
of DGs and Variable Loads Using Pareto
and Fuzzy Logic
José Raúl Castro1,2*, Maarouf Saad3†, Serge Lefebvre4†, Dalal
Asber4† and Laurent Lenoir4†
1
  Departamento de Ciencias de la Computación y Electrónica,
Universidad Técnica Particular de Loja, Ecuador
2
  Power Electronics and Industrial Control Research Group
(GREPCI), Ecole de technologie supérieure, Canada
3
  Department of Electrical Engineering, Ecole de technologie
supérieure, Canada
4
  Hydro-Québec’s research institute (IREQ), Canada
†
 These authors contributed equally to this work.

*Corresponding Author: José Raúl Castro, Departamento de
Ciencias de la Computación y Electrónica, Universidad Técnica
Particular de Loja, Loja 11-01-608, Ecuador

Published September 16, 2020

This Book Chapter is a republication of an article published by
José Raúl Castro, et al. at Energies in February 2016. (Castro,
J.R.; Saad, M.; Lefebvre, S.; Asber, D.; Lenoir, L. Coordinated
Voltage Control in Distribution Network with the Presence of
DGs and Variable Loads Using Pareto and Fuzzy Logic.
Energies 2016, 9, 107.)

How to cite this book chapter: José Raúl Castro, Maarouf
Saad, Serge Lefebvre, Dalal Asber, Laurent Lenoir. Coordinated
Voltage Control in Distribution Network with the Presence of
DGs and Variable Loads Using Pareto and Fuzzy Logic. In:

1                                             www.videleaf.com
Advances in Energy Research

Phattara Khumprom, Mladen Bošnjaković, editors. Advances in
Energy Research. Hyderabad, India: Vide Leaf. 2020.

© The Author(s) 2020. This article is distributed under the terms
of the Creative Commons Attribution 4.0 International
License(http://creativecommons.org/licenses/by/4.0/),      which
permits unrestricted use, distribution, and reproduction in any
medium, provided the original work is properly cited.

Acknowledgments: Thanks to Ecole de technologie supérieure
and    Hydro Québec    for    the   support    given    in
this work.

Author Contributions: José Raúl Castro is the author of this
work under the direction of Maarouf Saad. All co-authors made
suggestions for the research and contributed to the writing of the
final research paper.

Conflicts of Interest: The authors declare no conflict of interest.

Abstract
This paper presents an efficient algorithm to solve the multi-
objective (MO) voltage control problem in distribution networks.
The proposed algorithm minimizes the following three
objectives: voltage variation on pilot buses, reactive power
production ratio deviation, and generator voltage deviation. This
work leverages two optimization techniques: fuzzy logic to find
the optimum value of the reactive power of the distributed
generation (DG) and Pareto optimization to find the optimal
value of the pilot bus voltage so that this produces lower losses
under the constraints that the voltage remains within established
limits. Variable loads and DGs are taken into account in this
paper. The algorithm is tested on an IEEE 13-node test feeder
and the results show the effectiveness of the proposed model.

Keywords
Coordinated Voltage Control; Distributed Generation; On Load
Tap Changer; Multi-Objective Voltage Control; Fuzzy Logic

2                                              www.videleaf.com
Advances in Energy Research

Introduction
Due to rapid industrialization and growth of residential and
commercial sectors, the electrical energy requirements have
increased significantly over the last decades. In this situation,
renewable energy becomes a very important factor in the
electrical distribution system. This type of generating unit is
known as distributed generation (DG), and these generators will
supply a large portion of demand and many of them will be
directly connected to the distribution network. The DGs may
trigger variations in voltage and can cause a change of direction
in the power flow. The voltage rise depends on the amount of
energy injected by the DG and, therefore, it is a limiting factor
for the DG capacity. Many researchers have studied DGs and
their impact on the voltage, the reduction of the losses in the
active and reactive power, and the maximization of the DG
capacity [1–3]. In [4] a minimization of loss was used to
determine the optimum size and location of DG.

On the other hand, a review of the literature shows that many
works have been done assuming that the loads in the electrical
network are fixed. There are only a few works that use variable
loads [5–9]. In this paper, all the loads of the analyzed networks
are varying in time to better reflect system operation. Three
different models of load variation are utilized. Each model
represents the measurements of the change in consumption of
customers for 48 h (data provided by Hydro-Québec).

Coordinated voltage control (CVC) in distribution network
adjusts the voltage in pilot buses. CVC uses the multi-objective
problem to minimize the voltage variation at the pilot buses [10].
Several methods have been proposed to solve the optimization of
the multi-objective (MO) voltage control problem. In [10] a
genetic algorithm (GA) was used to determine an optimal
weighted solution of the MO problem. In [11] a simpler
evolution scheme for MO problems is proposed; this algorithm
uses the local search for the generation of new candidate
solutions.

3                                              www.videleaf.com
Advances in Energy Research

Some researchers [10,12,13] solve the MO voltage control
problem converting the objectives into a single objective (SO)
function; in this case, the objective is to find the solution that
minimizes or maximizes this single objective. The optimization
solution results in a single value that represents a compromise
among all the objectives [13].

Other researchers [13–15] work with the objectives of the MO
problem separately, resulting in a set of solutions called the
Pareto frontier. This causes the difficulty to find an optimal
solution since there is no a single solution. Therefore, a decision-
maker (DM) is necessary to choose the most appropriate
solution. This feature is useful because it provides a better
understanding of the system because all the objectives are
explored. This method leads to find the weighted minimum of
the objectives. Thus, the constraints and criteria specified of each
objective are important to find the Pareto frontier.

Electrical power systems are very difficult to control with
traditional methods due to highly complex and nonlinear
behaviors. Fuzzy logic can overcome these difficulties. In
[16,17] a fuzzy logic technique was introduced to solve the
optimal values of MO voltage control problem. The solution set
is usually not a singleton set. The problem requires the
objectives functions to be linear and it also requires the value of
the minimal solutions of the system. To solve this problem,
fuzzy logic can be used closely with other optimization
technique [18].

Previous methods adequately solved the problem of MO voltage
control problem using DGs in distribution networks obtaining
optimum values of voltage and reactive power [3,4,10,16,19–
23]. There is no research that calculates the value of the reactive
power of the DG using the optimal values of the MO voltage
control problem in distribution network with variable and
unbalanced loads.

To overcome the problems cited above, this paper proposes a
new method called coordinated voltage control using Pareto and
fuzzy logic (CVCPF). This technique finds the optimal values of

4                                               www.videleaf.com
Advances in Energy Research

the MO voltage control problem and finds the optimal value of
reactive power of the DG. CVCPF maintains the voltage of the
buses into the established limits, minimize the losses of the
network, and minimizes the voltage variation in the pilot bus.
This new method is tested on an IEEE 13-node test feeder using
variables and unbalanced loads.

CVCPF uses Pareto optimization for solving the MO voltage
control problem; the objectives of the MO problem are resolved
separately. This paper uses fuzzy logic to find the optimal
reactive power of DG to inject in distribution system. Fuzzy
logic analyzes the voltage difference       between the reference
voltage           and the optimal voltage of pilot bus (        )
to find the reactive power of DG that minimizes voltage error.

The original contributions of this paper consist basically in
combining the following:

    (1) Variables and unbalanced loads with DGs in distribution
        network are investigated.
    (2) CVCPF uses two optimization techniques. Pareto
        Optimization to find the optimal voltage and fuzzy logic
        to calculate the optimal value of reactive power of DG.
    (3) CVCPF uses the reactive power of DG as a control
        variable to minimize the voltage variation.
    (4) The objectives of the MO voltage control problem are
        resolved separately.

The rest of this paper is organized as follows: Section 2 presents
the classical CVC. Section 3 presents coordinated voltage
control using Pareto and fuzzy approach (CVCPF). Simulation
results are presented in Section 4 and, finally, in Section 5 the
conclusions are given.

Coordinated Voltage Control (CVC)
Richardot et al. in [10] demonstrated that CVC for transmission
networks can be successfully applied to a distribution network.
Based on this work, it is presented in the following subsections
the optimization model considered in this paper.

5                                              www.videleaf.com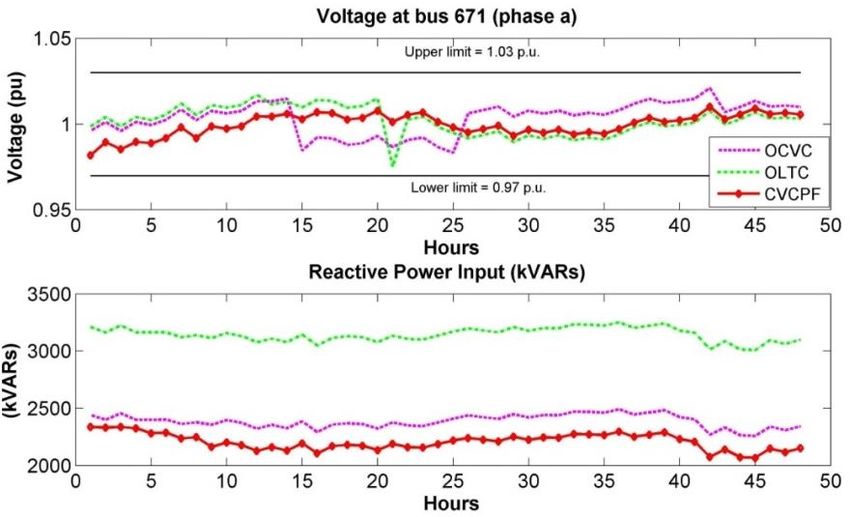
Advances in Energy Research

Objectives Function

The voltage variation at the pilot buses, the reactive power
production, and the generator’s voltage deviations are coupled
variables and are tied together. Any increase or decrease in
voltage at pilot buses will increase or decrease the reactive
power production and generator voltage respectively. These
objectives are modelled as follows:

Voltage at Pilot Bus

The first objective is to minimize the variation in voltage at the
pilot buses. In a mathematical form, the objective can be written
as follows:

     ∑       [ (              )   ∑            ] (1)

where:

           are the sets of pilot and generator buses indices;
                    are set-point voltage, actual voltage and
voltage deviation at bus i, i.e., the difference of voltage values
between two computing steps;             is the sensitivity matrix
coefficient linking the voltage variation at bus i and bus k,
respectively,               weighting factor and regulator gain,
respectively.

Reactive Power

The second objective is the management of the reactive power.
This objective is modelled as follows:

     ∑       [ (                  )   ∑           ] (2)

where:

6                                              www.videleaf.com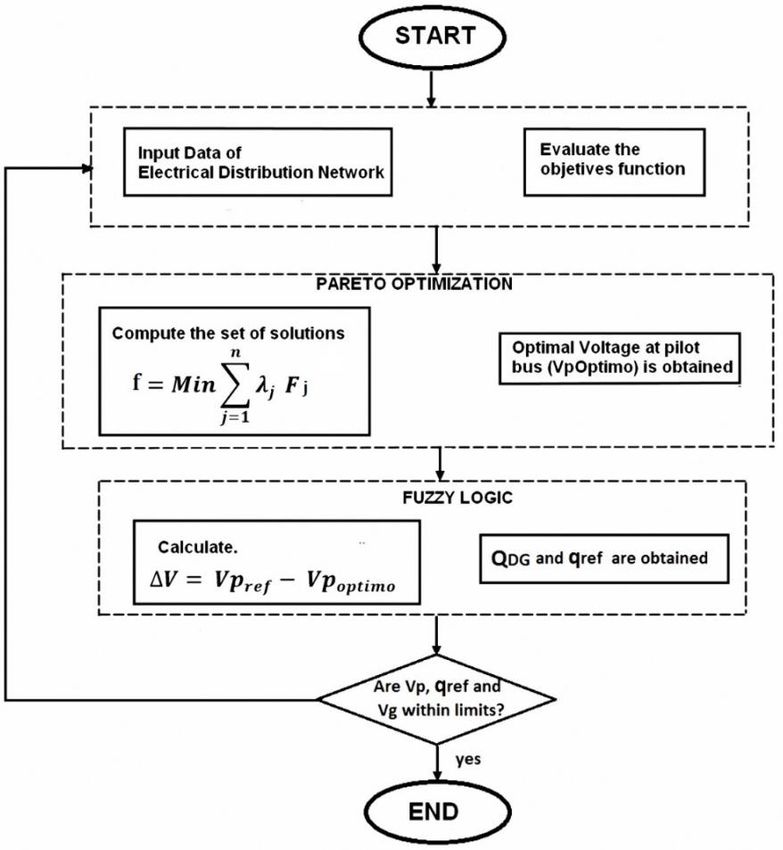
Advances in Energy Research

   is the set of generator buses indices;                 are actual
and maximum reactive power generations at bus i;

             ∑         ∑             is the uniform set-point
reactive power value within the regulated area;       is sensitivity
matrix coefficients linking, respectively, voltage variation at bus
i and bus k.             are weighting factor and regulator gain,
respectively.

Voltage at Generators

The third objective is the minimization of the generator’s voltage
deviations. The mathematical model is as follows:

     ∑       [ (              )     ]       (1)

where:

   is the set of generator buses indices;                   are the
set-point voltage, actual voltage and voltage deviation,
respectively, at the bus i, i.e., the difference of voltage values
between two computing steps.               are weighting factor and
regulator gain, respectively.

Constraints

The constraints are presented as follows:

Reactive Power Constraint

In this work, one of the main objectives is to control the
production of the reactive power of the DG. In [3] an acceptable
power factor is of ±0.91.

         ∑       ∑                (2)

where: | |           .

7                                                 www.videleaf.com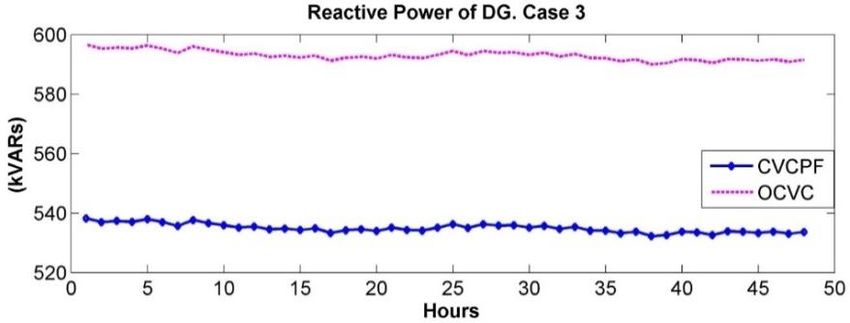
Advances in Energy Research

Technical Compliance Voltage

The compliance of constraints of voltage on the pilot and
generator buses is used to determine the safe operation values. In
distribution networks an acceptable steady voltage range is
considered within ±3% of the operating voltage at DG [24]:

     [            ]
                                           (3)
|   |

Weights Constraints

The weights of the objectives are important because they give
priority to an objective that depends on the conditions of
operation. For example, if the voltage on the pilot bus is outside
of the limits, the weight for this objective will be higher than the
other two; however, these weights are related as described in
relation Equation (6):

                         (4)

              are weighting factors for bus i.

Coordinated Voltage Control Using Pareto and
Fuzzy Logic (CVCPF)
This section presents the Pareto optimization to find the optimal
voltage on the pilot bus and the determination of reactive power
of DG using a fuzzy approach.

Pareto Optimization

The classical methods consist of converting the MO problem
into a single objective (SO) problem. The solution of this SO
problem yield a single result that depend of the selection of the
weights. On the other hand, Pareto optimization optimizes all
objectives separately.

8                                                www.videleaf.com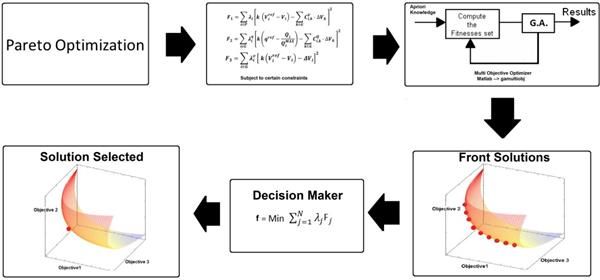
Advances in Energy Research

Figure 1 shows that Pareto optimization calculates a set of
solutions called the Pareto frontier, which can optimize the
maximum possible number of objectives. In this work, we use
Matlab to find the minimum of multiple functions using a
genetic algorithm and obtain the Pareto frontier subject to the
linear equalities                  . All objectives and constraints
are changing in the real-time set considering the actual needs and
capabilities. This Pareto frontier is obtained by using the
dominance relationship among different solutions.

Figure 1: Pareto optimization scheme for a multi-objective problem.

The algorithm needs to choose only one solution to this set of
solutions using a new condition decision-maker (DM) [8].
For each set of solutions, the decision-maker (DM) calculates the
minimum of the sum of the three objectives; the set of solutions
that have the minimum is selected:

           ∑                          (5)

where:

f is the minimum sum of the objectives of the set of solutions. N
is the number of objectives.      is the weight of the objective j.
   is the objective j of the MO voltage control problem.

9                                                      www.videleaf.com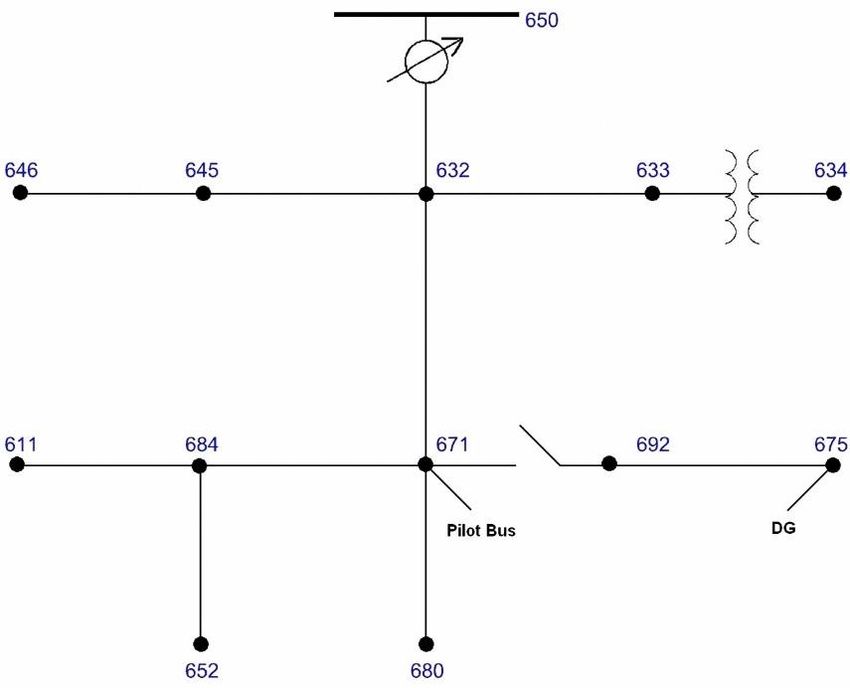
Advances in Energy Research

Fuzzy Logic

Fuzzy logic is an extension of traditional Boolean relations
where the system is not characterized by simple binary values
but a range of truths from 0 to 1. The input and output of the
system are ―somehow‖ related [20]. Fuzzy logic is increasingly
utilized in distribution networks.

Two of the most important types of fuzzy control are: the
Mamdani and Sugeno models. The Mamdani model allows
expressing the available prior knowledge of the system, whereas
the Sugeno model simplifies the calculations of the output. The
Sugeno output can be either linear or constant and the final
output is a weighted average of each rule’s output; so, its process
does not require defuzzification. It works well with optimization
and adaptive techniques and has a guaranteed continuity of
output surface. Finally, the Sugeno model is well suited to
mathematical analysis [25].

In this work, the Sugeno model will be used and its mathematical
model has the following form:

                                              (6)

In a zero-order model, the output level     is a constant (       ).
Each output of each rule has a weight        [12]:

                                              (7)

where        are the membership functions for input 1 [25]. The
average estimate is then given by the equation:

                  ∑
                   ∑
                                             (8)

CVCPF uses fuzzy logic to calculate the optimal reactive power
of DG. Figure 2 shows the fuzzy logic reactive power controller.
The input signal is the error ( ). This error (      is varying
over the range                                where
                                          . The output of the

10                                                 www.videleaf.com
Advances in Energy Research
fuzzy logic is the variation of the reactive power. The output of
the controller is the voltage variation. The PID generates an
output based on the difference between the power factor
calculated by fuzzy logic and output power factor of the
network. The three linguistic labels define voltage: Low,
Normal, and High. The input membership (Gaussian) functions
are shown in Figure 3.
Figure 2: Fuzzy logic reactive power factor controller.
Figure 3: Input fuzzy membership functions.
Design of Reactive Power of DG
In this work, this model is a single-input and single output
(SISO) controller (Figure 2). Using relation Equation (8):
(9)
The set of fuzzy rules are as follows:
11 www.videleaf.comAdvances in Energy Research
(10)
The advantage of the Sugeno model is that the output can be
found using the average estimate formula [25].
∑
∑
(11)
where:
are the outputs of the respective fuzzy rules.
when is the membership function for input 1.
Solution Algorithm
The algorithm flow chart is illustrated in Figure 4. The steps
followed to solve the MO voltage control problem are as
follows:
Step 1: System Data: Define input variables; the algorithm
acquires the network values.
Step 2: Analyze and complete the objective functions. The
objective functions are calculated from Equations (1) to
(3) and the constraints Equations (4) to (6). CVCPF
calculates the three weights corresponding to F1, F2, and
F3 and finds a set of solutions (Pareto frontier).
Step 3: Decision-maker (DM) calculates the fitness solution.
Step 4: Fuzzy logic
Figure 4 shows the step 4. The error ( ) is calculated:
(12)
12 www.videleaf.comAdvances in Energy Research
Determination of the rules: Equation (12) shows the rules.
Determination of the output stage: The final output is computed
according to Equation (13). Finally, the reactive power of DG is:
(13)
Determination of the optimal reactive power reference: The
reactive power is computed using Equation (4):
∑ ∑ (14)
Finally, the PID removes the error of the power factor.
Step 5: Control: According to the voltage at the pilot bus and the
optimal reactive power reference, the control action is
calculated on the OLTC and the PF of the DG.
Step 6: With the data from step 5, CVCPF calculates new values
for the distribution network using the OpenDSS program
[26].
Step 7: If voltage values at the pilot buses, reactive power
reference, and voltage at generators are within the limits
go to step 8; if not, return to step 1.
Step 8: End.
13 www.videleaf.comAdvances in Energy Research Figure 4: Flow chart of the proposed algorithm. Case Study The proposed method is tested on IEEE13 Node Test Feeder shown in Figure 5, 4.16 kV distribution network. The technical data of the network is given in [27]. In this work, for Case 1, 2, and 3 only a DG with 1.290 kW connected at the 675 bus is considered [4]. For Case 4, this work uses three DGs. 14 www.videleaf.com
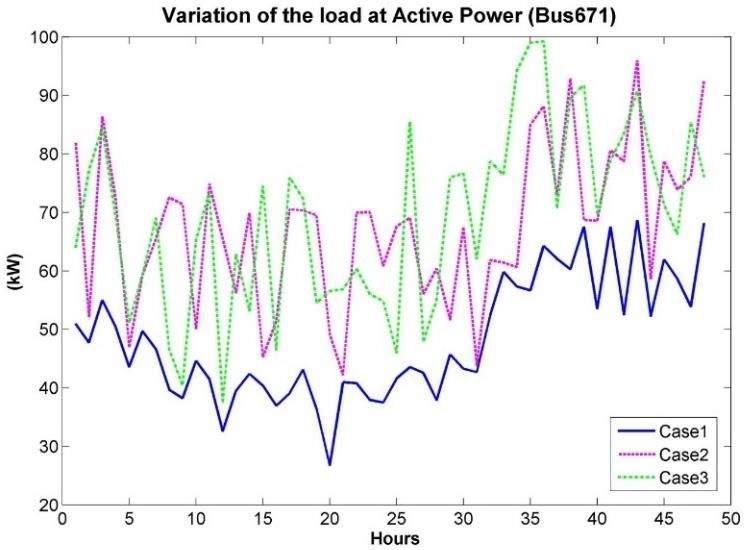
Advances in Energy Research

Figure 5: IEEE 13 Node Test Feeder3.5.1. Fixed and Variable Loads

Table 1 shows the default unbalanced loads values for the
network IEEE 13 (fixed values). In the second column of the
Table 1, the three basic loads are displayed. (1) Constant
Impedance Load Model (Constant Z); (2) Constant Current Load
Model (Constant I); and (3) Constant Power Load Model
(Constant PQ). In this study, three different cases are analyzed
where variable loads are added to the fixed network loads; each
case represents the measurements of typical change in
consumption of customers in a 48 h horizon (data provided by
Hydro-Québec). Table 2 shows the cable line configuration for
an IEEE 13 node test feeder. Figure 6 shows these three cases on
the pilot bus in active power (bus 671).

15                                                    www.videleaf.com
Advances in Energy Research

Table 1: Spot Load Data for IEEE 13.

     Node   Load       Ph-1      Ph-1     Ph-2    Ph-2     Ph-3   Ph-3
            Model      kW        kVAr     kW      kVAr     kW     kVAr
     634    Y-PQ       160       110      120     90       120    90
     645    Y-PQ       0         0        170     125      0      0
     646    D-Z        0         0        230     132      0      0
     652    Y-Z        128       86       0       0        0      0
     671    D-PQ       385       220      385     220      385    220
     675    Y-PQ       485       190      68      60       290    212
     692    D-I        0         0        0       0        170    151
     611    Y-I        0         0        0       0        170    80
            TOTAL      1158      606      973     627      1135   753

Table 2: Cable line configuration for IEEE 13 node test feeder.

 Node         R         X        Distance    Config.    X/R
              (Mile)    (Mile)                          Ratio
 650–632      0.3465    1.0179   0.378       601        2.9376
 632–633      0.7526    1.1814   0.094       602        1.5697
 632–645      1.3294    1.3471   0.094       603        1.0133
 632–671      0.3465    1.0179   0.378       601        2.9376
 645–646      1.3294    1.3471   0.056       603        1.0133
 671–684      1.3238    1.3569   0.056       604        1.0250
 671–680      0.3465    1.0179   0.189       601        2.9376
 692–675      0.7982    0.4463   0.094       606        0.5591
 684–611      1.3292    1.3475   0.056       605        1.0137
 684–652      1.3425    0.5124   0.151       607        0.3816
 671–692                                     Switch
 633–634      1.10%     2%                   XFM-1

16                                                       www.videleaf.com
Advances in Energy Research
Figure 6: Variation of the load in kW at Bus 671.
In Figure 6 and in the Table 3, we can see the maximum load
variations. Case 1 is 16.27 and 16.49 kW at hours 42 to 43 and
43 to 44, respectively; Case 2 is 34.28 and 37.38 kW at hours 2
to 3 and 43 to 44, respectively; and Case 3 is 39.66 and 37.73
kW at hours 25 to 26 and 26 to 27, respectively.
Table 3: Maximum load variations in Case 1, 2 and 3.
Case 1 (kW) Case 2 (kW) Case 3 (kW)
Hour Bus Variat Hou Bus Variati Hour Bus Varia
671 ion r 671 on 671 tion
43 68.69 16.27 3 86.38 34.28 26 85.59 39.66
44 52.20 16.49 44 58.62 37.38 27 47.86 37.73
Simulation Results
The proposed method (CVCPF) is compared with two other
methods (OLTC and OCVC).
In the method OLTC, the only equipment used for the voltage
control is the OLTC. This is the typical case of a distribution
network nowadays. The connection of DG and the variable load
will fundamentally alter the feeder voltage profile then the
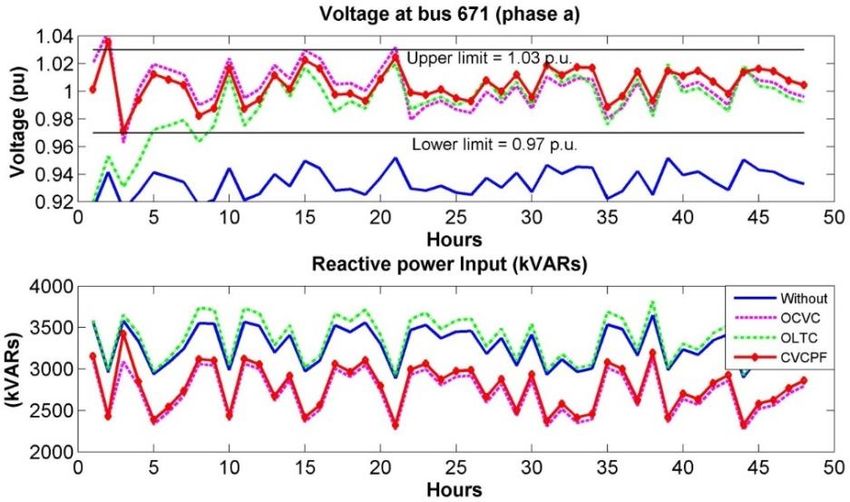
17 www.videleaf.comAdvances in Energy Research OLTC performs control voltage. The reactive power injected from the DG is zero in this method; furthermore, the DG does not participate in the regulation of the voltage. Optimal Coordinated Voltage Control (OCVC) proposes a solution for the MO voltage control problem using only Pareto optimization. This method proposes a balanced participation in the reactive power of DG connected to the distribution network. In OCVC, the weighting factors vary dynamically depending on: (1) the value of the voltage at the pilot bus, (2) the value of the voltage at the bus generator, and (3) the value of the reactive power available [10]. The difference between CVCPF and OCVC is that CVCPF uses two techniques to calculate the optimum values. OCVC uses only Pareto to get the optimum values whereas CVCPF uses Pareto and fuzzy logic. To calculate the reactive power given by DG, CVCPF uses fuzzy logic according to the optimum values given by Pareto. The effect of reactive power of DG on the voltage profile and the variable load in the network is shown in Figures 7–9. In all three cases, the reactive power input of CVCPF and OCVC are almost equal. The difference is the voltage variation; in the CVCPF method it is lower than in the other methods (Table 3). Figure 7. Voltage at bus 671 (phase a) with respect to reactive power input. Case 1. 18 www.videleaf.com
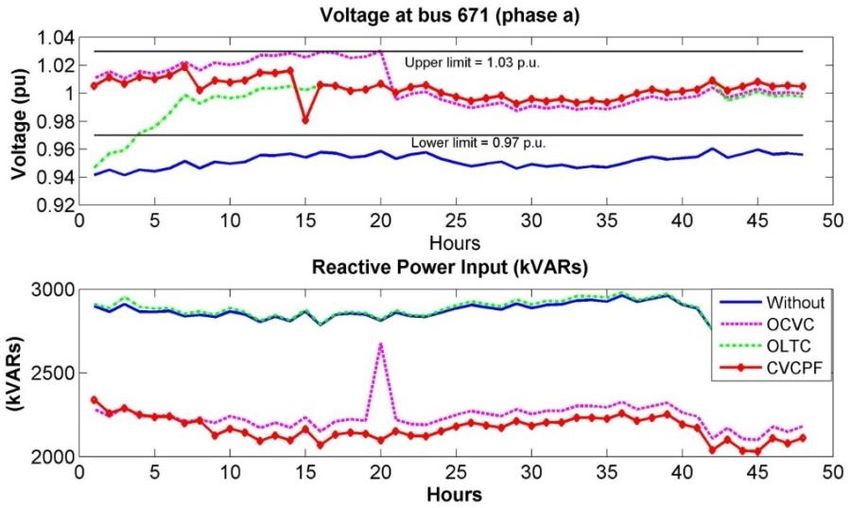
Advances in Energy Research

Figure 8: Voltage at bus 671 (phase a) with respect to reactive power input.
Case 2.

Figure 9: Voltage at bus 671 (phase a) with respect to reactive power input.
Case 3.

19                                                     www.videleaf.com
Advances in Energy Research

For the case study, the constraints of Equations (4) and (5) will
be:

| |                             (15)

                                  (16)

In the method ―without‖, the network does not perform any
voltage control. The DG and variable loads cause voltage
variations.

Case 1:

In Figure 7, we can see that when the voltage reaches the upper
limit allowed, the Objective 1 of the MO voltage control
problem is the priority (Equation (1)). The voltage at hour 20
(OCVC line) reaches the maximum allowed value; OCVC
maintains the voltage close to the reference value. Objective 2 of
the MO voltage control problem is not the priority (Equation
(2)), so the reactive power of the DG decreases and the reactive
power input increases.
From hour 21, the profile voltages are similar. However, in
CVCPF the voltage is close to one (1 p.u.). Reactive power input
is similar in these two methods.

In the hours 43 and 44 (maximum load variations), the variation
of voltage in reactive power is similar in the CVCPF and OCVC
methods.

Case 2:

At hours 3 and 44 (maximum load variations) of Figure 8 and
Table 4, the voltage variation in CVCPF is smaller than in the
other methods. At hour 3, OLTC has a lower variation than
CVCPF but the voltage on the bus 671 is not within the limits
(Figure 8). In the hours 3, 22, 39, and 44, we can see that each
time that the CVCPF line crosses the OCVC line; the voltage
variation in CVCPF is smaller than the other methods.
Additionally, at this time, the reactive power input between

20                                              www.videleaf.com
Advances in Energy Research
CVCPF and OCVC is almost similar. So, CVCPF used DG
reactive power to reduce the voltage variation.
Table 4: Voltage variation. Case 2. CVCPF, OCVC, and OLTC methods.
Case 2
Hour Variation (V p.u.)
CVCPF OCVC OLTC
Maximum 3 0.065 0.081 0.033
load variation 44 0.016 0.026 0.033
Line crosses 3 0.065 0.081 0.033
22 0.026 0.053 0.033
39 0.021 0.032 0.038
44 0.016 0.026 0.033
OCVC 3 0.065 0.081 0.033
variation is 4 0.023 0.039 0.024
higher than 10 0.028 0.029 0.036
0,025 V 11 0.028 0.029 0.036
22 0.026 0.053 0.033
35 0.028 0.029 0.029
39 0.021 0.032 0.038
44 0.016 0.026 0.033
When the voltage variation on the method OCVC is higher than
0.025 p.u. (Table 4), the voltage in CVCPF is lower. This can be
observed at the hours 3, 4, 10, 11, 22, 35, 39, and 44. At these
hours, there is a small difference between the reactive power
input of CVCPF and OCVC. Fuzzy logic is better suited to
voltage changes caused by the variation of the load. Therefore,
fuzzy logic achieves a more efficient management of reactive
power.
Case 3:
At hours 26 and 27 (maximum load variations) of Figure 9, the
voltage variation in CVCPF is similar than in the other methods.
In all the time, voltage variations in CVCPF and OCVC have not
exceeded the value of 0.025 p.u. Similarly, the reactive power
input for CVCPF and OCVC are similar.
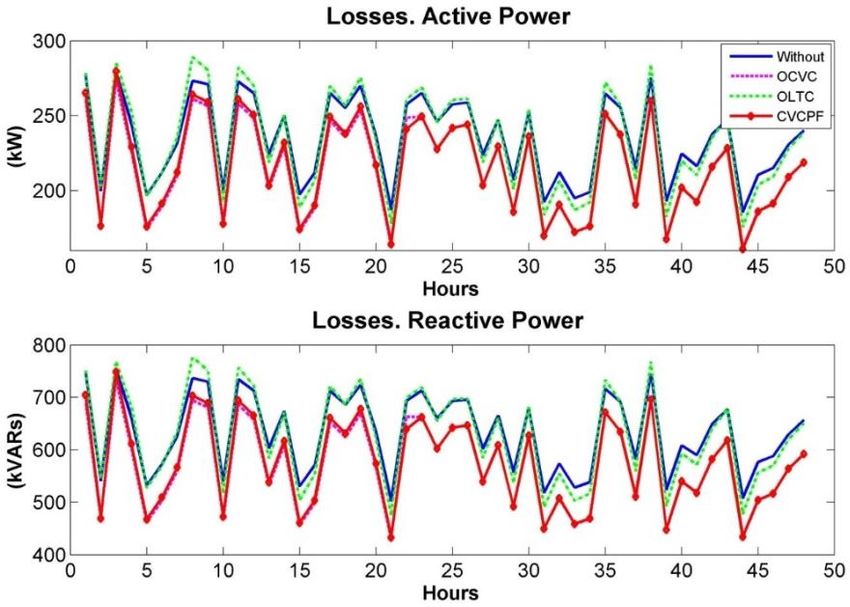
The losses of active and reactive power for CVCPF and OCVC
are always lower than other proposed methods (Figure 10).
21 www.videleaf.comAdvances in Energy Research Figure 10: Losses. Active and reactive power for Case 2. Figure 11 shows the reactive power delivered by the DG for Case 3 using CVCPF and OCVC methods. The reactive power varies according to the needs of the network. Then, the reactive power of the DG helps the distribution network to maintain a stable voltage and reduce loss. Figure 11: Reactive power generated by the DG for Case 3 with CVCPF and OCVC methods For the simulation, the OpenDSS and Matlab programs are used. We have used OpenDSS for unbalanced load flow. The method 22 www.videleaf.com
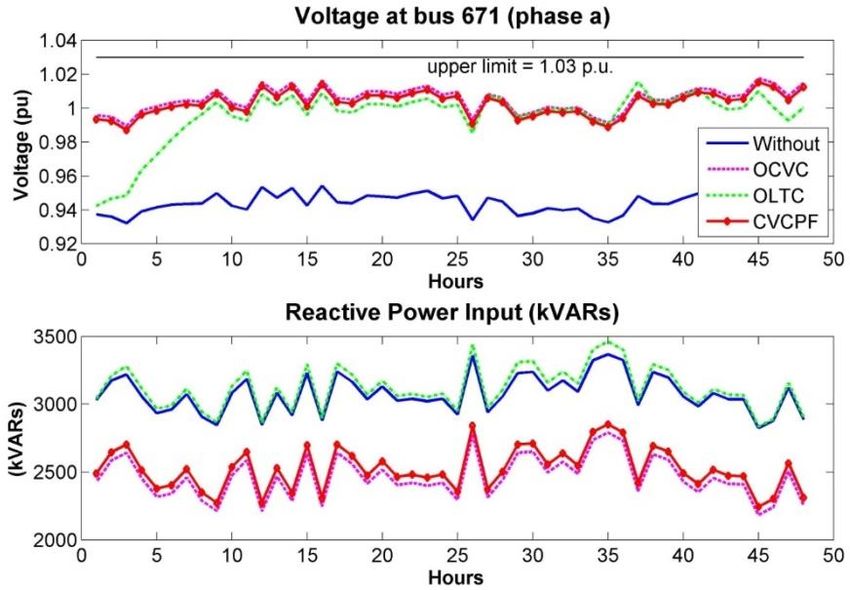
Advances in Energy Research

uses an OpenDSS server to communicate with Matlab; thus,
OpenDSS data and Matlab can work together.

Case 4:

The IEEE 13 Node Test Feeder has three DGs. The DG1 is
located on the bus 675 and has a capacity of 360 kW. The DG2
is located on the bus 671 and has a capacity of 630 kW. Finally,
The DG3 is located on the bus 632 and has a capacity of 300 kW
[28]. Variable load 1 is used in this case.

The Figure 12 shows that the voltage at the pilot bus is always
within the limits. However, in CVCPF the voltage variation is
less.

Figure 12: Voltage at pilot bus with respect to reactive power input. Case 4 .

Conclusions
A new algorithm, called CVCPF, for resolving the MO voltage
control problem in distribution networks is presented. The three
objectives considered in this paper are: voltage at pilot bus,
management of the reactive power and voltage in generators.
CVCPF uses a combination of optimization techniques (Pareto

23                                                         www.videleaf.com
Advances in Energy Research

optimization and fuzzy logic) to find the optimal values for the
MO voltage control problem.

The performance of the CVCPF is evaluated on an IEEE 13 node
test feeder. Variables and unbalanced loads are used, based on
real consumption data, over a time window of 48 h. Three such
profiles are used in the study, varying in the amount of the load.
The results are compared with those obtained from the methods
OCVC and OLTC as well as from the case of no voltage control.

This work demonstrates that CVCPF reduces the voltage
variation more than the other methods.

This work shows also that optimal integration of the DGs in the
distribution network helps to maintain stable voltage and to
reduce loss.

CVCPF includes the use of decision-maker; in this study the
fitness solution was used but various options are possible. The
use of CVCPF could be advantageous with respect to the
development of a flexible system for network operators, by
applying different settings at the decision stage, according to
specific circumstances. Further research is needed on this topic.

References
1. Habibi A, Nayeripour M, Aghaei J. Secure multi-objective
   distributed generation planning in distribution network. In
   Proceedings of the 2013 21st Iranian Conference on
   Electrical Engineering (ICEE). Mashhad, Iran. 2013; 1–6.
2. De Oliveira-de Jesus PM, de Leao MTP, Khodr HM.
   Remuneration of distribution networks using a fuzzy
   multicriteria planning algorithm. In Proceedings of the 2006
   International Conference on Probabilistic Methods Applied
   to Power Systems (PMAPS 2006). Stockholm, Sweden.
   2006; 1–7.
3. Ahmidi A, Guillaud X, Besanger Y, Blanc R. A multilevel
   approach for optimal participating of wind farms at reactive
   power balancing in transmission power system. IEEE Syst. J.
   2012; 6: 260–269.

24                                              www.videleaf.com
Advances in Energy Research

4. Anwar A, Pota HR. Loss reduction of power distribution
    network using optimum size and location of distributed
    generation. In Proceedings of the 2011 21st Australasian
    Universities Power Engineering Conference (AUPEC).
    Brisbane, Australia. 2011; 1–6.
5. Queiroz LMO, Lyra C. Adaptive hybrid genetic algorithm
    for technical loss reduction in distribution networks under
    variable demands. IEEE Trans. Power Syst. 2009; 24: 445–
    453.
6. Zidan A, El-Saadany EF. Network reconfiguration in
    balanced distribution systems with variable load demand and
    variable renewable resources generation. In Proceedings of
    the 2012 IEEE Power and Energy Society General Meeting.
    San Diego, CA, USA. 2012: 1–8.
7. Lopez E, Opazo H, Garcia L, Bastard P. Online
    reconfiguration considering variability demand: Applications
    to real networks. IEEE Trans. Power Syst. 2004; 19: 549–
    553.
8. Dehghani-Arani A, Maddahi R. Introduction a multi-
    objective function in unbalanced and unsymmetrical
    distribution networks for optimal placement and sizing of
    distributed generation units using NSGA-II. In Proceedings
    of the 2013 18th Conference on Electrical Power
    Distribution Networks (EPDC). Kermanshah, Iran. 2013; 1–
    9.
9. Hong YY, Lai YM, Chang YR, Lee YD, Liu PW.
    Optimizing capacities of distributed generation and energy
    storage in a small autonomous power system considering
    uncertainty in renewables. Energies. 2015; 8: 2473–2492.
10. Richardot O, Viciu A, Besanger Y, HadjSaid N, Kieny C.
    Coordinated voltage control in distribution networks using
    distributed generation. In Proceedings of the 2005/2006
    IEEE PES Transmission and Distribution Conference and
    Exhibition. Dallas, TX, USA. 2006; 1196–1201.
11. Knowles J, Corne D. The pareto archived evolution strategy:
    A new baseline algorithm for pareto multiobjective
    optimisation. In Proceedings of the 1999 Congress on
    Evolutionary Computation. Washington, DC, USA. 1999;
    101: 105.

25                                            www.videleaf.com
Advances in Energy Research
12. Soroudi A, Caire R, Hadjsaid N, Ehsan M. Probabilistic
dynamic multi-objective model for renewable and non-
renewable distributed generation planning. IET Gener.
Transm. Distrib. 2011; 5: 1173–1182.
13. Ngatchou P, Anahita Z, El-Sharkawi MA. Pareto multi
objective optimization. In Proceedings of the 13th
International Conference on Intelligent Systems Application
to Power Systems. Arlington, VA, USA. 2005; 84–91.
14. Lin X, Yao J, Mao T, Gong L. Inductive reactive power
compensation optimization for 10 kV distribution network
with distributed generations. In Proceedings of the 2013
Chinese Automation Congress (CAC). Changsha, China.
2013; 87–91.
15. Deb K, Pratap A, Agarwal S, Meyarivan T. A fast and elitist
multiobjective genetic algorithm: NSGA-II. IEEE Trans.
Evol. Comput. 2002; 6: 182–197.
16. Barin A, Canha LN, Machado RQ, da Rosa Abaide A,
Maziero E, et al. Analysis of the impacts of distributed
generation sources considering the appropriate choice of
parameters in a multi-objective approach for distribution
system planning. In Proceedings of the 5th International
Conference on European Electricity Market. Lisboa,
Portugal. 2008; 1–6.
17. Loetamonphong J, Fang SC, Young RE. Multi-objective
optimization problems with fuzzy relation equation
constraints. Fuzzy Sets Syst. 2002; 127: 141–164.
18. Gao Y, Liu J, Yang J, Liang H, Zhang J. Multi-objective
planning of multi-type distributed generation considering
timing characteristics and environmental benefits. Energies.
2014; 7: 6242–6257.
19. Gaonkar JDN, Pillai GN. Fuzzy logic based coordinated
voltage regulation method for distribution system with
multiple synchronous generators. In Proceedings of the 2010
IEEE PES Transmission and Distribution Conference and
Exposition. New Orleans, LA, USA. 2010; 1–5
20. Ghatee M, Hashemi SM. Application of fuzzy minimum cost
flow problems to network design under uncertainty. Fuzzy
Sets Syst. 2009; 160: 3263–3289.
26 www.videleaf.comAdvances in Energy Research
21. Kiprakis AE, Wallace AR. Maximising energy capture from
distributed generators in weak networks. IEE Proc. Gener.
Transm. Distrib. 2004; 151: 611–618.
22. Maciel RS, Padilha-Feltrin A. Distributed generation impact
evaluation using a multi-objective tabu search. In
Proceedings of the 15th International Conference on
Intelligent System Applications to Power Systems. Curitiba,
Brazil. 2009; 1–5.
23. Viawan FA, Karlsson D. Coordinated voltage and reactive
power control in the presence of distributed generation. In
Proceedings of the 2008 IEEE Power and Energy Society
General Meeting—Conversion and Delivery of Electrical
Energy in the 21st Century. Pittsburgh, PA, USA. 2008; 1–6.
24. Masters CL. Voltage rise: The big issue when connecting
embedded generation to long 11 kv overhead lines. Power
Eng. J. 2002; 16: 5–12.
25. Takagi T, Sugeno M. Fuzzy identification of systems and its
applications to modeling and control.
IEEE Trans. Syst. Man Cybern. 1985; 116–132.
26. Opendss Manual and Reference Guide. Available online at:
http://sourceforge.net/projects/electricdss
27. Kersting WH. Radial distribution test feeders. In
Proceedings of the 2001 IEEE Power Engineering Society
Winter Meeting. Columbus, OH, USA. 2001; 902: 908–912.
28. Khushalani S, Schulz N. Unbalanced distribution power flow
with distributed generation. In Proceedings of the 2005/2006
IEEE PES Transmission and Distribution Conference and
Exhibition. Dallas, TX, USA. 2006; 301–306.
27 www.videleaf.comYou can also read