Energy flexibility potential of domestic hot water systems in apartment buildings
←
→
Page content transcription
If your browser does not render page correctly, please read the page content below
E3S Web of Conferences , 11005 (2021)                                                                https://doi.org/10.1051/e3sconf/202124611005
Cold Climate HVAC & Energy 2021

       Energy flexibility potential of domestic hot water systems in
       apartment buildings
       Åse Lekang Sørensen1,2*, Harald Taxt Walnum1, Igor Sartori1, and Inger Andresen2
       1SINTEF,   Department of Architectural Engineering, P.O. Box 124 Blindern, 0314 Oslo, Norway
       2Norwegian  University of Science and Technology (NTNU), Department of Architecture and Technology, 7491 Trondheim, Norway

                     Abstract. Domestic Hot Water (DHW) storage tanks are identified as a main source of flexible energy use
                     in buildings. As a basis for energy management in apartment buildings, this paper describes the aggregated
                     DHW use in a case building, and analyses the potential for DHW energy flexibility by simulating different
                     control options. The case study for the work is an apartment building in Oslo with 56 apartments and a
                     shared DHW system. Energy measurements are available for consumed hot water, hot water circulation, and
                     energy supplied to the DHW tanks. The measurements are presented with minute, hourly and daily values.
                     Aggregated daily energy use for the consumed hot water is in average 362 kWh, while the energy supplied
                     is 555 kWh. The potential for energy flexibility is analysed for a base case and for four different rule-based
                     control options: Power limitation, Spot price savings, Flexibility sale and Solar energy. Economic
                     consequences of the control options are compared. With the Norwegian tariff structure, maximum hourly
                     power use has the main impact on the cost. Control systems that aim to reduce the maximum power use may
                     be combined with spot price savings or to offer end-user flexibility services to the grid.

       1 Introduction                                                                DHW use in individual households has been
                                                                                 analysed by e.g. [5], [6], [7] and [8]. Balint and Kazmi
                                                                                 [5] analysed energy flexibility of DHW, where each
       1.1 Flexibility potential of DHW systems                                  household has a 200 litre storage tank. They found that
           Moving towards zero emission buildings and                            the energy flexibility is influenced by ambient
       neighbourhoods, thermal and electric energy loads can                     conditions, control algorithm and occupant behaviour.
       be managed in a flexible way to achieve i.e. reduced                      Ericson [6] analysed data from 475 households, where
       power peaks, reduced energy use, reduced CO2-                             electric water heaters were automatically disconnected
       emissions, and increased self-consumption of locally                      during peak periods of the day. The results show
       produced energy. Further, smart management of                             reductions in electricity use during the disconnections,
       building loads can provide energy flexibility services to                 but also indicate a risk for new system peaks if several
       energy companies.                                                         DHW tanks are reconnected all at once. [7] analysed the
           Domestic Hot Water (DHW) storage tanks are                            stochastic nature of DHW demand in residential houses,
       identified as a main source of flexible energy use in                     used machine learning to predict the behaviour in 6
       buildings [1]. As buildings are becoming more energy                      individual houses, and investigated the potential for
       efficient, the share of DHW energy is increasing.                         energy reduction by an adapting hot water system. [8]
       However, so far, there has been relatively limited efforts                analysed DHW consumption profiles from 95
       in the field of energy-efficient DHW [2].                                 residential houses and aggregated information. They
           With demand side management (DSM) it is possible                      found that the aggregate consumption profile is more
       to influence the end-use of energy in a number of ways,                   predictable than individual consumption profiles.
       by reducing (peak shaving), increasing (valley filling) or                    Many apartment buildings have shared electric
       rescheduling (load shifting) the energy demand [3]. For                   DHW tanks in a heating central, where load shifting of
       the DHW system, load shifting of the energy profile is                    the electricity use could be possible. DHW use in
       possible, i.e. by preheating the storage tanks or delaying                buildings is affected by user behaviour [9]. Compared to
       the heating of the hot water. The flexibility capacity of                 DHW use in individual households, aggregated DHW
       DHW systems is largely based on the volume of the                         use in apartment buildings is expected to be more
       storage tank [1]. When storing DHW there are heat                         predictable, influenced by parameters such as time of
       losses; [2] found ranges from 2% to 36% heat losses in                    day, day of the week, months, and holiday periods [10].
       the storage tanks depending on the system solution. The                       As a basis for energy management in Norwegian
       VarmtVann2030 project found annual heat loss values                       apartment blocks, this study analyses DHW
       in the range of 4 kWh per litre stored [4].                               measurements in a typical apartment building located in
                                                                                 Oslo. The work gives general recommendations for

       * Corresponding author: ase.sorensen@sintef.no

  © The Authors, published by EDP Sciences. This is an open access article distributed under the terms of the Creative Commons Attribution License 4.0
  (http://creativecommons.org/licenses/by/4.0/).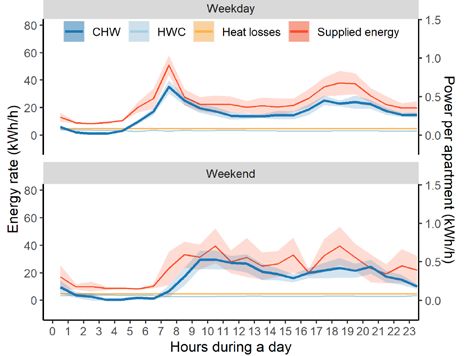
E3S Web of Conferences , 11005 (2021) https://doi.org/10.1051/e3sconf/202124611005
Cold Climate HVAC & Energy 2021
possible rule-based control (RBC) options, utilizing the 2) Spot price savings: Day-ahead spot prices are
energy flexibility potential. The research question of the available from NordPool [13]. This is a market price of
work is: How can an apartment building reduce energy power, determined by supply and demand. The prices
costs by shifting aggregated DHW energy loads in time, are normally higher during peak load hours, in the
provided a limited storage volume? The analysis will morning and afternoon. For most days during the year,
also provide the basis for more advanced analysis the hourly price differences during a day are rather
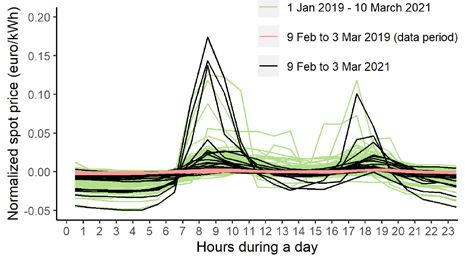
planned, as described in section 3.2. small. However, there are exceptions, where the spot
prices increase substantially for a few hours during the
day. For example, during the winter day 12 February
1.2 The case study apartment building
2021, the hourly prices increased from about 0.05
The case study for the work is an apartment building euro/kWh during the night hours to about 0.25
in Oslo with 56 apartments and in total 3,752 m2 heated euro/kWh during the morning peak. Figure 1 shows
floor area. Each apartment has a floor area of 67 m2 and normalized spot prices for each day in the period
has two bedrooms. January 2019 to February 2021, the prices during the 23-
DHW is heated by a local heating network based on days data period used in this article, as well as the prices
heat pumps (preheating) and electricity, see Table 1. The during corresponding 23 dates in 2021. In the figure, the
heating and storage capacities are dimensioned to fulfil absolute price difference for each hour is shown, as the
the residents need for DHW, with temperature-based difference between the spot prices each hour and the
control of the DHW tanks, but there is otherwise no average hourly spot price during the same day.
active DSM of the DHW system. The DHW is supplied
to the apartments from a technical room in the basement.
DHW is permanently circulated in pipes on the
basement level, to keep the water hot, compensating for
heat losses. There is no circulation system from the
basement and up to each apartment.
Energy measurements are available on an
aggregated level, and include energy need for DHW
(without losses, as defined by [11]), energy losses in the
DHW circulation, and energy supplied to the DHW
tanks (to cover DHW energy need and all losses). In this
article, the total DHW heating and storage capacities are Figure 1. Normalized hourly spot prices during a day, with
analysed, not separating between the preheating and line colours illustrating three time periods.
electricity heating systems. 3) Energy flexibility services to energy companies:
Table 1. DHW heating and storage capacities in the case. End-user flexibility may become valuable for the
Distribution System Operator (DSO). A market may be
Capacity Storage Storage developed, where building owners are paid for not using
Source
(kW) (litre) (kWh) *
energy during peak hours. However, it is difficult to
Preheating via (4 x 400) quantify the value of such flexibility services, since
60 96
heat exchanger 1,600
related tariffs are not yet existing in Norway. The project
(3 x 14) (3 x 400) EMPOWER [14] presents a local energy market
Electricity 72
42 1,200
concept, with compensation in the form of a strike price
Total values and an activation reward. In an example, they suggest 11
102 2,800 168
(used in article)
euros strike price and 4 euros activation reward for a 1.5
* Storage multiplied by accumulation factor 0.06 kWh/litre.
kW flexible load, with given activation criteria (up to
2.5 hours activation mornings and evenings weekdays).
1.3 Economic motivation for energy flexibility 4) Increased self-consumption of locally produced
energy: If there are solar energy supply systems on-site,
This section describes existing tariff structure and there is an economic advantage of using the energy in
economic conditions, which may motivate building the building, including thermal energy from solar
owners to realize their DHW energy flexibility potential. collectors and electricity from photovoltaic (PV)
1) Power limitation: In Norway, electricity systems. For thermal solar energy, unused energy has no
production and transmission capacity during peak-load value (given that it cannot be exported). For solar
hours is a main concern for the distribution grid [6], electricity, within the Norwegian tariff structure, the
especially during winter months. Therefore, larger income of electricity exported to the grid is mainly the
customers usually pay hourly power tariffs, e.g. if they spot price, while the price of electricity imported from
exceed 100,000 kWh annual electricity use behind a the grid is about the double, including also grid costs and
meter. For the case building, the power tariffs are taxes [15]. It is therefore beneficial to shift DHW loads
monthly, with tariffs varying from 2.2 euros/kW (7 to the daytime (direct use of solar energy) or to store hot
summer months), 6.7 euros/kW (2 spring/autumn water in DHW tanks. There is no solar energy
months) and 12 euros/kW (3 winter months) [12] (1 euro technologies installed in the case building, but the article
= 10 NOK).
2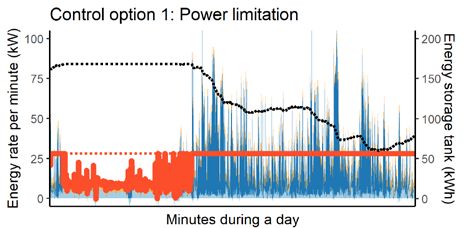
E3S Web of Conferences , 11005 (2021)                                                       https://doi.org/10.1051/e3sconf/202124611005
Cold Climate HVAC & Energy 2021

       analyses the effects of solar electricity from a theoretical       thermocouples where mounted on the pipe wall. Flow
       PV-system.                                                         rates and temperatures were measured with an interval
           5) Energy use: Utilizing the flexibility of a DHW              of 1 second, and then averaged to 2 seconds before
       system may increase the use of the storage system,                 analysis. Measurement equipment and energy
       which would increase the heat losses of the system. The            calculations are described in [20].
       variable electricity price for end-use customers is in the              Energy supplied to the DHW tanks was measured
       range of 0.08 euro/kWh, including spot price and taxes             hourly. The measurements are available for 3 full weeks
       [16]. If the annual heat losses related to the storage tanks       and 4 weekends, from 9 February to 3 March. In the
       are about 4 kWh/litre [4], the energy costs of an                  EMS, both thermal energy (preheating) and electricity
       additional litre stored is around 0.32 euro/year. The              to the DHW tanks were measured, and the total hourly
       annual heat loss for the current 2,800 litre heat storage          energy supplied is used in these analysis.
       in the case building may thus cost about 900 euros/year.                Due to the storage tanks, there is a time difference
            6) Investment costs and technical lifetime of DHW             between CHW and energy supplied. In addition, there is
       systems: Use of flexibility will also change the operation         an absolute difference between energy supplied and
       of the energy systems, which may change their technical            energy needed for CHW and HWC. This difference is
       lifetime [17]. For example, more constant power                    calculated as the heat losses in the technical room, and
       delivered from heat pumps may increase their lifetimes             is related to heat exchanger, storage, valves, pipes, etc.
       and may also reduce the capacity size needed for heat
       pumps and heat exchangers. However, such systems
                                                                          2.2 Method for DHW energy analysis
       may require increased storage volume. Also,
       investments in monitoring equipment and building                       The following data are used in the energy analysis:
       energy management systems (EMS) may be needed.                     50 days measurement-period (16.01 - 06.03.2019):
       [18] analysed practical performance of heat pump                   • CHW, resampled to 1 minute and 1 hour time steps,
       systems, finding universal challenges such as over-sized           • HWC, resampled to 1 minute and 1 hour time steps,
       capacity design and unreasonable control strategies. To            23 days measurement-period (09.02 - 03.03.2019):
       improve the energy efficiency, they suggest                        • Energy supplied (sum of preheating and electricity), 1
       decentralized and reasonable system design, as well as             hour time steps,
       accurate and efficient control strategies.                         • Heat losses in the technical room (calculated difference
            In this article, the economic consequences of 1) to           as described above), 1 hour time steps.
       4) are included, while the consequences of 5) and 6) are               Calendar data were added to the energy data, such as
       not analysed.                                                      time of day and weekdays. DHW energy need and
                                                                          supplied energy are analysed. For CHW and HWC, the
       Nomenclature                                                       time steps of 1 minute and 1 hour are compared. For the
         CO           Control option                                      heat losses in the technical room, the hourly analyses
         CHW          Consumed hot water                                  show average heat losses, not heat losses hour-by-hour,
         DHW          Domestic hot water                                  since the hourly values includes the time-delay between
         DaySES       Daily supplied energy setpoint                      CHW and supplied energy.
         DSM          Demand side management
         DSO          Distribution system operator                        2.3 Control options for utilizing flexibility
         EMS          Energy management system
         HWC          Hot water circulation                                   The potential for energy flexibility is analysed by
         RBC          Rule-based control                                  simulating a base case and four different control options
         SoC          State of charge                                     (COs), named control option 1 "Power limitation",
                                                                          control option 2 "Spot price savings", control option 3
                                                                          "Flexibility sale", and control option 4 "Solar energy".
       2 Methodology                                                      The control options are rule-based with additional
                                                                          constraints [21], aiming to account for physical
       2.1 Method for DHW measurements                                    limitations of the systems, and to make sure DHW is
                                                                          always available for the users.
           DHW measurements for this study were extracted                     Input parameters for the control options are:
       from     the   following    sources:   The    project              • CHW (all COs): Hourly values, 23-day period.
       VarmtVann2030 [19] performed a measurement                         • HWC (all COs): Hourly values, 23-day period.
       campaign where energy for consumed hot water (CHW)                 • Heat loss in technical room (all COs): Hourly average
       and distribution losses in the hot water circulation               heat loss value is used for all hours: 4.7 kW.
       (HWC) were measured. The EMS in the building                       • Daily supplied energy setpoint, DaySES (all COs):
       measures energy supplied to the DHW tanks.                         Assumed maximum energy supply during a day, set
           The measurement campaign lasted for 7 weeks, from              10% above the measured value of 613 kWh: 672 kWh
       16 January to 6 March 2019. Flow and temperature                   per day.
       measurements were performed on the main supply pipe                • Power limitation setpoint: Because of the existing
       for the apartment building. Clamp-on ultrasonic flow               hourly power tariffs, there is a power limitation in most
       meters were used for flow measurement and Type-T                   of the COs (except the base case and the CO 2 case):

                                                                      3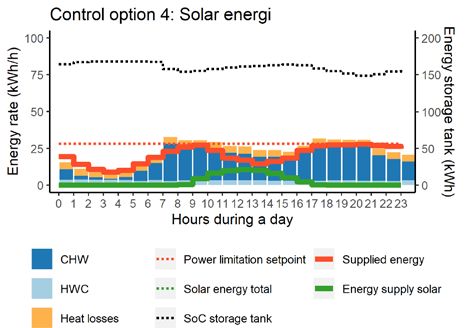
E3S Web of Conferences , 11005 (2021)                                                                   https://doi.org/10.1051/e3sconf/202124611005
Cold Climate HVAC & Energy 2021

            • Base case: No limitation, except by actual installed                 fairly constant during the day. The total heat losses are
            total capacity: 102 kWh/h.                                             35% of the supplied energy. Figure 4 shows CHW,
            • CO 1: Even distribution DaySES: 672/24=28                            HWC and supplied energy each day during the 50 days
            kWh/h.                                                                 measurement period. There are not very large daily
            • CO 2: The spot prices are divided into three levels                  variations. The daily CHW values vary from 276 to 436
            each day: 1) Low-price level: 12 hours, limited by                     kWh per day during the period, while HWC values vary
            actual installed capacity (102 kWh/h), 2) Medium-                      from 68 to 94 kWh per day. There was a holiday period
            price level: 8 hours, limited to energy use that hour                  from 18 to 24 February, but it appears that there is not
            (no energy is supplied to the storage tanks), and 3)                   any significant change in DHW use.
            High-price level: 4 hours, no energy supply.
            • CO 3: Two peak load hours with no supplied
            energy: One in the morning (from 07:00 weekdays
            and 10:00 weekends) and one in the afternoon (from
            16:00 all days). Even distribution of DaySES on the
            remaining hours: 672/22=30.5 kWh/h.
            • CO 4: Solar electricity is prioritized, when
            available. A 50 kWp system is assumed, based on a
            solar map for Oslo [22]. Hourly electricity
                                                                                   Figure 2. CHW, HWC and supplied energy on a timeline
            generation is simulated for 2019, using the tool
                                                                                   with 1 hour time-steps (data series are stacked in columns).
            renewables.ninja [23] (Dataset MERRA-2, 0.1
            system loss, 30° tilt, 135° azimuth). In addition:
            Even distribution of DaySES: 672/24=28 kWh/h.
       • State of charge (SoC) storage tank (all COs): Limited
       to the total storage volume available in the technical
       room: 168 kWh. For the first hour, the storage volume
       is full. Then, calculated for each hour (i) as:
         Etank(i)=Etank(i-1)+EPV(i)+Esetpoint(i)–ECHW(i)–EHWC(i)–Elosses(i)
         Condition: If Etank(i)>Etank-cap then Etank(i)=Etank-cap       (1)

       Esetpoint(i) is the hourly power limitation setpoint, while                 Figure 3. Duration curve for CHW and HWC separately.
       Etank-cap is the storage tank capacity. Hourly solar energy                 Comparing 1 minute and 1 hour time-steps.
       (EPV(i)) is zero for all COs except CO 4.
                                                                                   Table 2. Hourly and daily values for CHW, HWC, supplied
       • Energy supply (varies with the CO): Hourly energy                                          energy and heat losses.
       supply, calculated for each hour (i) as:
                                                                                                                95-
                                                                                                   Average                 Max     Average   Max
        Esupply(i)=Etank(i)–Etank(i-1)–EPV(i)+ECHW(i)+EHWC(i)+Elosses(i) (2)        DHW (kWh)
                                                                                                    hourly
                                                                                                             percentile
                                                                                                                          hourly    daily    daily
                                                                                                              hourly
                                                                                       CHW          15.1       33.9       53.3      362      436
       3 Results and discussion
                                                                                       HWC           3.3        4.4        5.6       78       94
                                                                                      Supplied      23.1       54.6       72.1      555      613
       3.1 DHW energy need and supplied energy
                                                                                     Heat losses     4.7         -          -       112      142
           This section describes the actual energy need and
       supplied energy to the DHW tanks in the case building.
       Figure 2 shows CHW and HWC during the 50-days
       measurement period, and supplied energy during the 23-
       days measurement period. Figure 3 shows the duration
       curve for CHW and HWC separately, comparing minute
       and hourly time steps. Comparing the time steps, the
       max. power averaged during a minute is about 3 times
       higher than the max. power averaged during an hour. For
       hourly resolution of CHW, the max power is 53.3 kW,
       while the 95-percentile is 33.9 kW. For the minute                          Figure 4. Daily CHW, HWC and supplied energy during
                                                                                   weekdays and weekends.
       resolution of CHW, the max power is 171.9 kW, while
       the 95-percentile is 49.6 kW. The substantial variations                        Hourly average values are shown in the daily profile
       within one hour should be taken into account when                           in Figure 5. CHW, HWC, heat losses, and supplied
       analysing hourly averages and indeed when                                   energy are shown separately, with their individual 90%
       dimensioning DHW systems and preparing control                              confidence interval. For heat losses, an average value is
       systems.                                                                    shown. The daily values show an increased CHW during
           Table 2 shows hourly and daily values for CHW,                          the morning, from about 06:00 during the weekdays and
       HWC, supplied energy, and heat losses. The HWC-                             about during 08:00 weekends. There is a morning and
       values show that energy losses in the distribution are                      afternoon peak, as also observed in other apartment

                                                                               4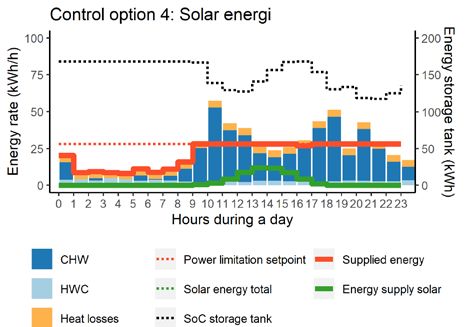
E3S Web of Conferences , 11005 (2021) https://doi.org/10.1051/e3sconf/202124611005
Cold Climate HVAC & Energy 2021
buildings [24], but also the DHW uses during other CHW load of 52.5 kWh/h, based on the 23-day
daytime hours are quite high. An explanation for this measurement period. Including losses, the daily demand
could be that residents with small children or elderly are is 554.8 kWh and the max. hourly load is 59.3 kWh/h.
overrepresented, which is reasonable given that the The example day Sunday 3 March 2019 is chosen, since
apartments have two bedrooms only. If so, a higher it has the highest daily demand (606 kWh incl. losses)
share of the residents may be home during daytime, and the third highest hourly load (57.3 kWh/h) during
compared to other buildings with more mixed or larger the 23-day period.
apartment sizes. For CHW, Table 3 provides more For the base case, the heat production capacity of
details, with hourly average values during weekdays and 102 kWh/h can deliver all needed energy, hour-by-hour.
weekends. The storage capacity therefore remains at maximum
In the case study, supplied energy during peak hours level on an hourly basis. The max. hourly energy supply
is higher than the CHW, even though DHW tanks are is 59.3 kWh/h.
present. This is explained by the design of the preheating CO 1 "Power limitation" aims to distribute the
control system. Using the storage capacity actively, it supplied energy evenly through the day, to reduce the
may be possible to shift loads from peak hours to off- power tariff costs. For both the average day and the
peak hours. This is further investigated in the next example day, the supplied energy is limited by the DHW
section. tank volume during night-hours. The minimum SoC for
the storage tank during the 23-day period is 65.5 kWh
(39%), which implies that the tank volume is sufficient.
If it becomes necessary to increase the hourly energy
supply, this increase should happen slowly, since large
power jumps over a short period has higher economical
costs than a smaller power increase during a longer
period. Since hourly values are analysed, a safety
margin should be considered, to make sure that the
needed energy can be provided within the hour. This is
illustrated in Figure 8, showing the example day with
minute timesteps, which can be directly compared with
CO 1 in Figure 7. A DWH tank may be emptied due to
variations within the hour, even though the tank is large
enough for the hourly averages.
With CO 2 "Spot price savings", the supplied energy
is distributed according to the day-ahead spot prices.
Figure 5. Average daily profiles for CHW, HWC, heat The spot prices vary during the day, with higher spot
losses, and supplied energy, shown separately, with their
prices during energy peak periods. With CO 2, this
individual 90% confidence interval (1 hour time-steps).
results in less energy production during hours with
Table 3. Average CHW for weekday/weekend hours (kWh). DHW demand, both for the average day and the example
Daily Week- Week- Daily Week- Week- day. The result is that CO 2 struggles to supply the
hour days end hour days end needed energy, given the available DHW storage. With
00-01 6.7 9.8 12-13 12.3 24.7 all the heat production capacity available, the minimum
01-02 2.3 5.5 13-14 13.1 21.1 SoC for the storage tank during the period is 21.8 kWh
02-03 1.1 2.6 14-15 16.2 18.8 (13%). This is during a day where all the four high-price
03-04 0.8 0.6 15-16 16.2 17.0 level hours (with no energy supply) are in sequence. The
04-05 2.6 0.4 16-17 20.9 18.6 maximum hourly load is high, since there are no
05-06 9.0 1.9 17-18 25.0 21.4 limitations (102 kWh/h). Also for this control option, a
06-07 16.8 1.0 18-19 24.5 19.6 maximum level could be set for the hourly energy
07-08 31.8 6.6 19-20 24.2 20.3 supply. In addition, other conditions could be tested, e.g.
08-09 21.6 17.4 20-21 24.0 22.7 limiting the number of high-price level hours in
09-10 17.2 27.2 21-22 17.2 18.4 sequence, reducing the number of hours with high-price
10-11 16.4 31.0 22-23 16.3 14.4 or medium-price level, or increasing the available
11-12 12.7 28.3 23-24 14.8 9.8 storage volume.
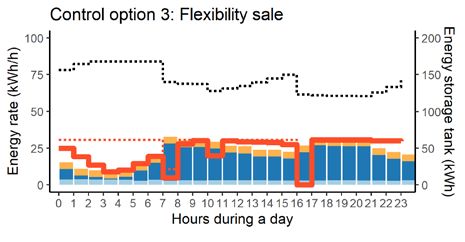
Average daily CHW (kWh/day): 363.9 359.1 With CO 3 "Flexibility sale", there is no energy
supply during 2 peak hours. Like for CO 1, the power
level is limited by the DHW tank volume during night-
3.2 Energy flexibility potential of DHW systems hours. The minimum SoC for the storage tank during the
This section analyses the potential for energy period is 35.8 kWh (21%), which means that it may be
flexibility by simulating a base case and four control necessary to increase either the hourly energy supply or
options. For each option, the average daily profile and the tank volume in order to provide flexibility services
an example day are shown in Figure 6 and Figure 7, every day. Another option is to only offer flexibility
while Table 4 provides some key results. The average services when sufficient capacity is available, if this
day has a CHW demand of 367 kWh and a max. hourly becomes a possible option within the flexibility market.
5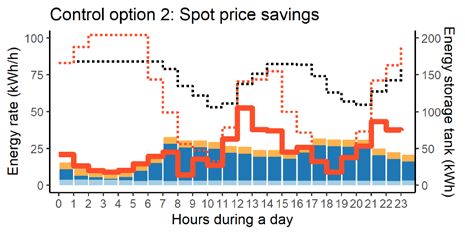
E3S Web of Conferences , 11005 (2021)                                                        https://doi.org/10.1051/e3sconf/202124611005
Cold Climate HVAC & Energy 2021

       Figure 6. Average daily profiles for the control strategies.       Figure 7. Daily profiles for example day 2019-03-03.

           CO 4 "Solar energy" is like CO 1, but with a PV-               CO 1 is relevant for grid electricity only, not solar
       system added. The solar electricity is used directly,              electricity. In the 23-day period, the average PV
       either to supply the DHW demand or to be stored in the             generation is 62 kWh per day (Figure 6). The minimum
       tanks (limited by tank capacity). Solar electricity is             SoC for the storage tank is 113 kWh (67%). The daily
       prioritized when available, and the power limitation in            PV generation March 3 is 53 kWh (Figure 7). During the

                                                                      6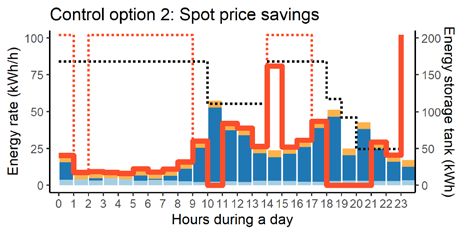
E3S Web of Conferences , 11005 (2021)                                                              https://doi.org/10.1051/e3sconf/202124611005
Cold Climate HVAC & Energy 2021

       year 2019, the average daily PV generation is 123 kWh,                   Norwegian grid tariffs may depend on time of day,
       with maximum 341 kWh/day.                                                which may increase the savings.
          Table 4. Analysis of control strategies (23-days period)
                                                                                    It is challenging to estimate the potential income
                                                                                from flexibility services in CO 3, since related tariffs are
                    Energy       Power        Average         Min. SoC          not yet existing in Norway. If assuming an activation
                    supply        max        SoC storage       storage
                    (kWh)        (kW)          (kWh)           (kWh)
                                                                                reward of 0.5 euro/kW each flexible hour, using the
         CO 0       12,760       59.3           168              168
                                                                                hourly energy supply in CO 1 as the reference, a
                                                                                reduction from 28 kW to 0 kW during a peak hour will
         CO 1       12,676       28.0          154.8         65.5 (39%)
                                                                                generate 14 euro. For two peak hours each weekday
         CO 2       12,725       102.0         146.4         21.8 (13%)         only, the potential income during the 23 days is 398 euro
         CO 3      12,652        30.5          142.2         35.8 (21%)         (or 6,898 euro/year).
                   11,349                                                           If solar energy is available, either thermal or electric,
         CO 4                    28.0          160.2         113 (67%)
                  +PV 1,378
                                                                                the average DHW loads in the case building fit well with
                                                                                the potential solar energy production, even if the whole
                                                                                demand cannot be covered, such as the morning loads
                                                                                during weekdays. Larger storage volume would increase
                                                                                the self-consumption potential of solar energy.
                                                                                     The analysis in this article uses a simple input-
                                                                                output storage tank model, with energy flows in and out
                                                                                of the tank. RBC can yield significant improvements
                                                                                with regards to demand response and flexibility [21].
                                                                                RBC is also easy to implement, with few requirements
                                                                                for historic data and control system. However, RBC may
                                                                                lead to non-optimal solutions, since the control rules are
                                                                                predefined [17]. In future work, more advanced analyses
                                                                                are planned. The internal state of the storage tank will
       Figure 8. Daily profile for example day 2019-03-03, with                 then be included, with temperature levels in the tank. In
       minute timesteps.                                                        addition, optimalisation options will be introduced. In
                                                                                general, Model Predictive Control (MPC) is expected to
         Table 5. Economic consequences of the control strategies
                                                                                further improve the results [21], [25], optimizing DHW
                 Power tariffs        Spot-price                                operation by modelling future DHW need, technological
                                     (€/23 days)               Other
                  (€/month)
                                                            (€/23 days)         constraints, and additional influencing parameters. In
                summer-winter      2019        2021
                                                                                this article, we have not separated between the
        CO 0       130-712          553         669                             preheating and electricity heating systems, thus
        CO 1    62-336 (47%)     548 (-5)     653 (-16)                         analysing the total DHW heating and storage capacity
        CO 2 224-1,224 (172%)    545 (-8)     601 (-68)                         only. In real life, it would normally be an advantage to
                                              644 (-25)     Flex services       increase the preheating share of the system A deeper
        CO 3    67-366 (51%)     546 (-7)
                                                           0.5 €/kW: 398        analysis of technical options, control algorithms and
                                                             El. savings        economic consequences is intended in further studies.
        CO 4    62-336 (47%)     491 (-62)    592 (-77)
                                                           0.05 €/kWh: 69

           The economic consequences of the four control
       strategies are analysed, with key results in Table 5. In                 4 Conclusion
       the analysis, it is assumed that a reduction in energy                        The research question of this work is: How can an
       supplied to the DHW tanks also reduces electricity                       apartment building reduce energy costs by shifting
       delivered from the grid (independent on the use of                       aggregated DHW energy loads in time, provided a
       preheating or other energy use in the building).                         limited storage volume? The case study is a building
           For customers with power tariffs, it is an advantage                 with 56 apartments. The potential for energy flexibility
       to reduce max. hourly energy supply each month.                          is simulated for a base case and four RBC options, based
       During a year, there is a saving potential of 2,028 euros                on hourly timesteps. The flexibility capacity of DHW
       when moving from the base case to CO 1.                                  systems is largely based on the volume of the storage
           With the conditions in this work, the daily difference               tank. In the analysis, the volumes of the tanks are limited
       in spot prices seem too low to justify a management                      to the actual sizes available in the case study.
       system focusing on spot price savings. It was not                             The economic analysis shows that for customers
       achieved lower spot price with CO 2 than the other                       with power tariffs, it is an advantage to reduce the
       control options, using spot prices during the 23 days                    maximum hourly energy supply. This can be done by
       measurement period in 2019. Spot prices vary, and if                     setting a maximum power level for delivered energy.
       using 2021-prices for the same dates (not adjusting for                  The power level should be high enough to avoid short-
       change of weekdays, and assuming that the CHW habits                     term power jumps, which would increase the tariff costs.
       are not directly dependent on spot prices), the savings                  When hourly values are used as a basis for setting the
       increase from 8 euro to 68 euro during the periode,                      power level, a safety margin should be included, since
       compared to base case. Spot price savings may be                         there are variations within an hour. A management
       combined with other control options. In the future, also

                                                                            7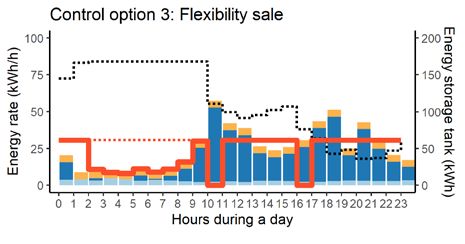
E3S Web of Conferences , 11005 (2021)                                                       https://doi.org/10.1051/e3sconf/202124611005
Cold Climate HVAC & Energy 2021

       system with maximum power level can be combined                   [10] D. Ivanko, Å. L. Sørensen, and N. Nord, “Selecting
       with other control options, such as spot price savings or              the model and influencing variables for DHW heat
       flexibility services. With the conditions in this work, the            use prediction in hotels in Norway,” Energy Build.,
       daily difference in spot prices is too low to justify a                vol. 228, p. 110441, 2020.
       management system focusing on spot price savings                  [11] European Committee for Standardization, “EN ISO
       alone. It is possible for apartment buildings to provide               52000-1 Energy performance of buildings.” 2017.
       flexibility services to the DSO by avoiding to use energy         [12] “Elvia Effekttariff – bedriftskunder,” 2021.
       for DHW during peak load hours in the grid. If so, the                 https://www.elvia.no/nettleie/alt-om-
                                                                              nettleie/nettleiepriser-og-effekttariff-for-bedrifter-i-
       power tariffs for the building may increase and
                                                                              oslo-og-viken.
       investments in larger storage volume may be needed.
                                                                         [13] Nordpool, “Day-ahead prices,” 2021.
       The interests in offering flexibility services will                    https://www.nordpoolgroup.com/Market-
       therefore depend on the economic conditions for the                    data1/Dayahead/Area-Prices/NO/Hourly.
       services.                                                         [14] B. A. Bremdal, P. Olivella-Rosell, J. Rajasekharan,
           The results of the study support the theory that                   and I. Ilieva, “Creating a local energy market,”
       aggregated DHW need is a significant source of flexible                CIRED - Open Access Proc. J., vol. 2017, no. 1, pp.
       energy use in Norwegian apartment buildings. A deeper                  2649–2652, 2017.
       analysis of technical options, control algorithms and             [15] Å. L. Sørensen, I. Sartori, K. B. Lindberg, and I.
       economic consequences is intended in further studies.                  Andresen, “Analysing electricity demand in
                                                                              neighbourhoods with electricity generation from
       The work presented in this paper was developed within the              solar power systems: A case study of a large
       Institute PhD grant (272402) at SINTEF, the project "Energy            housing cooperative in Norway,” in IOP Conference
       for domestic hot water in the Norwegian low emission                   Series: Earth and Environmental Science, 2019,
       Society" (VarmtVann2030) (267635) and the Research Centre              vol. 352, no. 1.
       on Zero Emission Neighbourhoods in Smart Cities (257660).         [16] SSB, “09387: Kraftpris, nettleie og avgifter for
       The authors gratefully acknowledge the support from the                husholdninger,” 2021.
       partners and the Research Council of Norway.                           https://www.ssb.no/statbank/table/09387.
                                                                         [17] J. Clauß, S. Stinner, I. Sartori, and L. Georges,
       References                                                             “Predictive rule-based control to activate the energy
                                                                              flexibility of Norwegian residential buildings: Case
       [1]   Y. Chen, P. Xu, J. Gu, F. Schmidt, and W. Li,                    of an air-source heat pump and direct electric
             “Measures to improve energy demand flexibility in                heating,” Appl. Energy, vol. 237, no. October 2018,
             buildings for demand response (DR): A review,”                   pp. 500–518, 2019.
             Energy Build., vol. 177, pp. 125–139, 2018.                 [18] J. Deng, Q. Wei, M. Liang, S. He, and H. Zhang,
       [2]   M. Z. Pomianowski, H. Johra, A. Marszal-                         “Does heat pumps perform energy efficiently as we
             Pomianowska, and C. Zhang, “Sustainable and                      expected: Field tests and evaluations on various
             energy-efficient domestic hot water systems: A                   kinds of heat pump systems for space heating,”
             review,” Renew. Sustain. Energy Rev., vol. 128, no.              Energy Build., vol. 182, pp. 172–186, 2019.
             April, p. 109900, 2020.                                     [19] SINTEF, “Project VarmtVann2030,” 2021.
       [3]   P. D. Lund, J. Lindgren, J. Mikkola, and J.                      https://www.sintef.no/varmtvann.
             Salpakari, “Review of energy system flexibility             [20] H. Taxt Walnum, Å. L. Sørensen, B. Ludvigsen,
             measures to enable high levels of variable                       and D. Ivanko, “Energy consumption for domestic
             renewable electricity,” Renew. Sustain. Energy Rev.,             hot water use in Norwegian hotels and nursing
             vol. 45, pp. 785–807, 2015.                                      homes,” IOP Conf. Ser. Mater. Sci. Eng., vol. 609,
       [4]   H. T. Walnum, “VarmtVann2030 - Energi (to be                     no. 5, 2019.
             published),” 2021.                                          [21] T. Q. Péan, J. Salom, and R. Costa-Castelló,
       [5]   A. Balint and H. Kazmi, “Determinants of energy                  “Review of control strategies for improving the
             flexibility in residential hot water systems,” Energy            energy flexibility provided by heat pump systems in
             Build., vol. 188–189, pp. 286–296, 2019.                         buildings,” J. Process Control, vol. 74, pp. 35–49,
       [6]   T. Ericson, “Direct load control of residential water            2018.
             heaters,” Energy Policy 37 3502–3512, 2009.                 [22] “Oslo solkart,” 2021.
       [7]   A. Heidari, N. Olsen, P. Mermod, A. Alahi, and D.                https://od2.pbe.oslo.kommune.no/solkart/.
             Khovalyg, “Adaptive hot water production based on           [23] S. Pfenninger and I. Staffell, “Long-term patterns of
             Supervised Learning,” Sustain. Cities Soc., vol. 66,             European PV output using 30 years of validated
             p. 102625, 2021.                                                 hourly reanalysis and satellite data,” Energy, vol.
       [8]   L. Gelažanskas and K. A. A. Gamage, “Forecasting                 114, pp. 1251–1265, 2016.
             hot water consumption in residential houses,”               [24] D. Ivanko, H. Taxt Walnum, Å. Lekang Sørensen,
             Energies, vol. 8, no. 11, pp. 12702–12717, 2015.                 and N. Nord, “Analysis of monthly and daily
       [9]   E. Fuentes, L. Arce, and J. Salom, “A review of                  profiles of DHW use in apartment blocks in
             domestic hot water consumption profiles for                      Norway,” E3S Web Conf., vol. 172, pp. 1–7, 2020.
             application in systems and buildings energy                 [25]  et al., “All you need to know about model
             performance analysis,” Renew. Sustain. Energy                    predictive control for buildings,” Annu. Rev.
             Rev., vol. 81, no. April 2017, pp. 1530–1547, 2018.              Control, vol. 50, no. August, pp. 190–232, 2020.

                                                                     8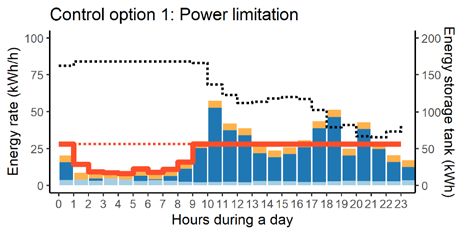
You can also read