ESKOM PERSPECTIVE: EDI BRIEFING - Presentation to the Energy Portfolio Committee
←
→
Page content transcription
If your browser does not render page correctly, please read the page content below
ESKOM PERSPECTIVE: EDI
           BRIEFING

Presentation to the Energy Portfolio Committee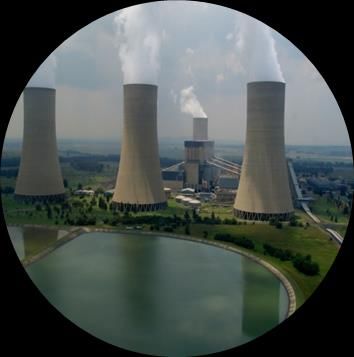
Content
1 Orientation on the Electricity Value Chain
Distribution, Customer Services and EDI
2
Concluding Remarks
3
2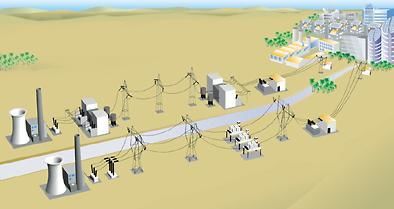
Eskom has three NERSA Licensed businesses –
Generation, Transmission and Distribution
Eskom has three Licensed Businesses Strategic and Support Businesses
• Generation (Gx) Customer Services (part of Dx License)
Group Capital (performing construction on
• Transmission (Tx) Medium to Long Term
behalf of Gx and Tx)
• Distribution (Dx) Finance solutions required:
Human Resources
Procurement
Legal
Corporate Affairs Division
Security
TRANSMISSION DISTRIBUTION
GENERATION
s
Municipal
area of control
SYSTEM OPERATIONS
Ring-fenced and licensed Business
Regulated3by NERSA
Electricity Supply Chain

            Divisions.                                                                TRANSMISSION
                                                                                                          MUNICIPALITIES
                                       2                                              SUBSTATIONS

     1
                                                   TRANSMISSION LINES
                                        TRANSMISSION (400/275 kV)                 3
 POWER STATIONS                       High Voltage electricity is carried      DISTRIBUTION             DISTRIBUTION
    GENERATION                        between Generation and required          LINES                      (132/33 kV)
                                      Distribution through Transmission
 Electricity is Generated by          networks (or Transmission grids)                             The distribution networks
 burning of fossil fuels (coal,                                                                    collect‘stepped down  ’
 oil, or natural gas), use of DISTRIBUTION SUBSTATIONS                                             electricity from the
 nuclear technology and                                                                            transmission networks and
 hydro capability                                                                                  deliver it to Redistributors
                                                                                                   /End Users

                               The voltage levels of electricity are further
                               transformed to meet Distribution requirements

     RETICULATION HV LINE
          (11 & 22kV)                                                                       SERVICE CONNECTION
                                                                                        Customer consumption is measured at the
                                                                                        point of supply in KWh. This information is
                                                 RETICULATION LV LINE                   used to measure and bill consumption
                                                      (380/220V)                        levels utilised/sold

 3       Distribution

                                                                                                                                      4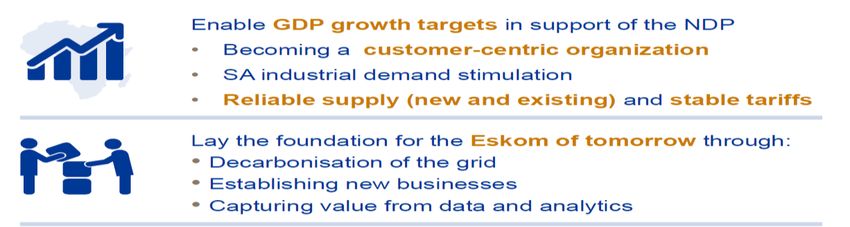
1 Orientation on the Electricity Value Chain
Distribution, Customer Services and EDI
2
Concluding Remarks
3
5
Overview of the Distribution Division
Scope and mandate
Distribution’s role is to service the customer through building, operating
and maintaining Distribution assets, while also acting in the national interest by actively partnering with the
wider industry in resolving Distribution industry issues and enhancing stakeholder relations
Asset base Organisation structure
¹ 25 011 km 132kV and higher • 5.9 Million customers
23 794 km 33 to 88kV • 9 Operating Units – Provinces
296 188 km 22kV and lower(reticulation lines) • 15 213 employees
Distribution provides electricity directly to 45% of all • 305 Customer Network Centres
end users in South Africa (including bulk supply to
Municipalities)
Highlights and output Key challenges and priorities
Network interruption performance in terms of Zero harm to employees and customers
frequency and duration has improved. Energy theft escalates due to illegal
Build and Strengthen network to accommodate connections, equipment theft and
growth in customer base and to enable IPP vandalism
Electrified a total of over 1 million household since Limit Energy losses to industry norms
2012. The ability to sustain technical
Industry skill developer in support of learnership performance in a constrained environment
programmes Identifying opportunities to extract
Partnering with the Distribution industry in efficiencies from operations
addressing industry issues
6
Note: ¹Data from the Annual Integrated Report March 17
Distribution Capital Expenditure
Capital investment is a priority for Distribution over the next five years.
Reducing investment backlogs and keeping the asset base in a condition that supports
sustained network performance.
Refurbishment and strengthening of existing networks
Building new networks for customers and enabling IPP connections
Expenditure is prioritised in accordance with the Network Development
methodology
Enabling Distribution to sustain network performance
Comply with regulatory and license conditions
Satisfy demand growth.
7
Distribution CAPEX Investment Profile over
the next few years ….
12 000
Investment leads to
improvement in network
10 000
performance.
Spend (Rm)
8 000
2017 onwards investment to
target on:
6 000
i. Aging networks
4 000
(refurbishment)
2 000
ii. Strengthening for
future and existing
-
FY FY FY FY FY FY FY FY FY customer demand
13_14 14_15 15_16 16_17 17_18 18_19 19_20 20_21 21_22 (electrification and
Actual Forecast other categories)
Financial Year FY13/14 FY14/15 FY15/16 FY16/17 FY17/18 FY18/19 FY19/20 FY20/21 FY21/22
Actual (R m) R 7 477 R 6 073 R 5 003 R 5 155
R 5 783 R 6 227 R 7 575 R 8 326 R 9 838
Forecast (R m)
8Electrification – There has been two distinct eras of installation:
pre-2000 and post-2000, moving towards universal access
Total investment from 1994 – 2020 to date: R17.1 bn
350 313 308 300
285 291
300 256
254
Number of 250 209 212 204 207 201 202
annual grid 200 175 171 168 161 158 167
153 150 150 155
connections 150
135 132
113
‘000
100
52
50
0
199419951996199719981999200020012002200320042005200620072008200920102011201220132014201520162017201820192020
30
24
Cost per 25
19 19
connection 20 17
15
R '000 15 13 12 12 12 12 12
11
9 9 8 9 9
10 7 6 6 6 6
5 5 4 5 4
5
0
1995
1997
2018
1994
1996
1998
1999
2000
2001
2002
2003
2004
2005
2006
2007
2008
2009
2010
2011
2012
2013
2014
2015
2016
2017
2019
2020
Self-funded and managed
programme
• Eskom exceeded the
Future Programme
government's target
of 1.75M connections between • Universal Access
1994 and 2000 achieved by
2020/21
• Connection every 30 seconds,
pole every 10 seconds, 200M
cable every minute due to prior
investment on infrastructure
• Connection costs steadily came
down due to pre-investment 9Distribution’s Maintenance Philosophy
Eskom Distribution’s maintenance regime includes both preventative and
corrective maintenance.
Distribution’s Preventative Maintenance Objective ensures that:
Regulatory and statutory requirements are met (Safety, health and environment).
The technical performance is accordance with the design of the equipment
The design life of assets are maximised.
Asset life extension is supported through timeous refurbishment identification
triggered by maintenance feedback.
10Distribution has delivered significant operational
performance improvements since 2012
SAIDI YEAR 12MMW (OHD)
44.0 42.6
Average Customer Hours
42.0 40.5
40.0 38.6 38.9 39.0 39.0 39.0 39.0 39.0
38.0 37.4
36.2
36.0
34.0
32.0
FY11/12 FY12/13 FY13/14 FY14/15 FY15/16 FY16/17 FY17/18 FY18/19 FY19/20 FY20/21 FY21/22
Actual SAIDI
Actual SAIFI
SAIFI YEAR 12MMW (OHD) Planned
23.0
22.1
22.0
21.4
Average Times / Year
21.0 20.5
20.3
20.0 20.0 20.0 20.0 20.0
20.0 19.7
18.9
19.0
18.0
17.0
FY11/12 FY12/13 FY13/14 FY14/15 FY15/16 FY16/17 FY17/18 FY18/19 FY19/20 FY20/21 FY21/22
11Customer Service mandate and purpose
Eskom CS Mandate
“To put the customer at the centre of our business and guide
Eskom towards the overall objective of delighting our customers
so that they consistently rate us in the top quartile and also to
promote Eskom as a company”
Primary purpose of Customer Services
Connect/Sell Collect Delight
Optimal Business Model
Appropriate Systems, Processes, Policies and Procedures
Focused and Energised
12 EmployeesCustomer Service Overview
Scope and mandate
To sustain and grow profitable sales by putting the customer at the center of our business and guide Eskom
towards the overall objective of delighting customers
Customer Profile Organisation Structure
¹5 838 754 Residential
50 956 Commercial • 5.9 Million customers
2 706 Industrial • 7 Customer Service Operations
1 012 Mining • 2506 Employees
81 806 Agricultural
510 Rail
Key Priorities Key Challenges
Customer Services will manage a program of customer • Evolving energy market , increases
experience improvement customer choice.
to embed customer centricity in Eskom • Evolving energy market , increases
customer choice.
• Current Tariff Trajectory is not affordable for
SA consumers
• Optimisation of Revenue Collection
13
Note: ¹Data from the Annual Integrated Report March 17Customer Services
Total electricity sales of 214 121 GWh and R175Bn in Revenue as at 31 March 2017.
Approximately 5,9m customers, across SA (CS) and Cross Border (Tx). Supported by channels including personalised service
(Top 50 customers), contact centres, hubs and online channels.
Payment levels of average 95% of bills rendered, notwithstanding challenges in the municipalities (FS, MP and NW) and Soweto.
The Top Customer Segment comprising of key industrial and mining customers, with consumption of 100GWh and above,
consists of 150 customers and contributes to 33% of revenues;
Municipalities contribute 41% to revenue and the rest including residential billed and prepaid at 8% .
Customer satisfaction indicators show Top Customers rate us at 108 (out of 120); The rest od customers at rate 96%.
Eskom is a member of the Southern African Power Pool (“SAPP”)
Key figures for 31 March 2017
Sales Split Gross Electricity Revenue Split Number of customers
Total: 214 121GWh Total: R175 815m Total: 5.7 million
Residential Traction Agricultural Prepayme Residentia Traction Agriculture
Agricultura Other Commercial
2% 1% 2% 1%
nt l 2% 0% 1%
l
Prepaymen 5% 3%
4%
t
4% Mining
Mining 15%
14% Internation
al Sales
Internation Municipalities 6%
al Sales 42%
7% Municipalities
Industrial 41%
18% Residentia
Industrial
23%
l
98%
Commercia Commerci
l al 14
5% 6%Critical Business Challenge – Debt Management
Drastic Increase
Since PAJA on New PAJA
Total overdue debt as on End July 2017 (Rm)* Started Debt overview
Hold
Total municipal debt overdue at
Steady decrease in 11 454 11 074 the End July 2017 at R11.074bn
debt since the 10 223
implementation of 10 453 Reduction of R380m from End
9 604 9 674 9 774 9 827
PAJA 9 527 June high of R11.454bn
9 180 9 406
Top 10 overdue municipalities are
overdue by R7.301bn
7 342 Top 20 overdue municipalities are
overdue by R8.692bn
6 012 6 005 There are 69 municipalities that
5 589 are overdue by more than R10M
5 299
99 municipalities have overdue
4 953
debt in excess of R500k
4 520
4 004 Three Provinces contributing
R8.788bn
3 288
2 593 FS R5.156 bn
MP R2.536 bn
NW R0.848 bn
First Interruptions planned for 13
September 2017
Mar- Jun- Sep- Dec- Mar- Jun- Sep- Dec- Mar- Jun- Sep- Oct- Nov- Dec- Jan- Feb- Mar Apr May Jun Jul
14 14 14 14 15 15 15 15 16 16 16 16 16 16 17 17 17 17 17 17 17
15Various challenges impacting effectiveness and
efficiency in municipalities have been identified
Main issues/ drivers underlying the municipal debt situation (from an Eskom perspective)
Inadequate skills/ resources in Municipalities
Skills competency Separation of financial and technical duties within Municipalities,
High turnover in management and key staff and prolonged acting positions in
Municipalities
Municipal Billing system not always functional
Revenue Losses and ineffective revenue collection
Management Penalties when exceeding NMD due to bad load management
Municipality electricity revenue not ring-fenced
Municipal Ineffective sales forecasting and budgeting processes
Cash Flow
Arrear Debt Eskom billing dates vs Municipal billing dates to their customers
Municipal equitable share payments to municipalities have reduced and are
no longer able to cover municipal arrear debt
Funding
Dependency on funding to settle outstanding municipal debt
Municipality tariff structure not always cost reflective
Tariffs Inadequate capacity within municipalities regarding electricity tariffs
practices and philosophies
• Provincial & National Treasury and CoGTA have recognised that, due to local economic circumstances, certain
municipalities are not financially viable. 16
• Root causes are systemic in nature and cannot be tackled by Eskom alone to reduce municipal debtTo ensure a sustainable solution Eskom is considering
initiatives to address the top 5 issues raised by the
municipalities
Initiatives proposed to address municipal issues
In addition to Board
• Eskom is proposing the Rationalisation of approval, the proposals
1
Municipal Tariffs to reduce tariff options from 11 to may require the following
3 approvals:
• Eskom to decrease the Interest Rate charged on 1. PFMA approval
2 2. Competition Commission
overdue balances from Prime plus 5% to Prime
plus 2.5% opinion on selective
benefit of 15 days to 30
days offered to
3• Eskom to change the payment period on Municipal municipalities only (not
Bulk accounts from 15 Days to 30 Days the other Large Power
Users)
• Eskom to change its payment allocation policy to 3. Acceptance of installation
4 allocate payments to capital first and then interest of smart and secure
prepaid, as part of the
revenue enhancement
5• Allowing municipalities to pay connections charges strategy
over a 20 year period at relevant interest rate in
stead of Cash up Front
Note: The first four proposals were approved by Eskom Board to enable implementation by 1
July 2017.
17The electricity distribution industry is characterised by
two key role players, Eskom and municipalities
Electricity Distribution Industry (“EDI”) is characterised largely by two key role-players
Electricity Supply Industry
Municipalities Eskom
• Generally confined their areas
of supply to their municipal
• Historically responsible for
areas not supplied by the
boundaries
municipalities in the country
as a whole.
• Traditionally responsible for
supplying a bulk supply to
the municipalitiesA legislative framework governs the supply of electricity
Stipulates powers and
functions of municipalities.
Section 156(1) grants
executive authority and not
Stipulates that exclusive authority
other licensees are
permitted to Constitution of the Republic of
distribute and South Africa, 1996
supply electricity
within the Section 84(1) (c)
municipality states “bulk supply
boundaries of electricity, which
Electricity Regulation Municipal Systems Municipal Structures includes for the
Act, of 2006 Act, No 32 of 2000 Act, No 117 of 1998 purposes of such
Implies Eskom supply, the
may be appointed transmission,
as a service distribution and,
provider. In that where applicable,
capacity, it will be the generation of
supplying electricity” is a
electricity on behalf function and power
of the appointing National Energy Regulator Act of 2004
of a district
municipality in municipality.
areas outside its Eskom’s right to
supply area supply not
Issues licenses that permit Eskom and Municipalities to reticulate electricity excluded.
within the municipal areas, but in different geographical areasThere are currently different views between Eskom and
Municipalities on certain matters
Matters to be resolved Eskom view
1 Municipalities do not have “exclusive” executive
authority to reticulate electricity within its area of
jurisdiction
Do municipalities have exclusive
authority to reticulate (supply)
Municipalities current financial viability and health
electricity within a municipal boundary
does not support their legal position that they
have exclusive executive authority to provide
electricity within municipal boundaries
2 Within a municipality's geographical area of
jurisdiction, both the municipality and Eskom can
Does the license issued to Eskom by distribute and supply electricity to consumers.
NERSA authorise Eskom to reticulate
electricity within municipal areasThere is misalignment between interpretations of Section
1 156 of the Constitution concerning reticulating electricity
within municipal boundaries
Eskom’s interpretation
• While a municipality has executive authority in respect of electricity reticulation, this is not an
exclusive local government function, and is accordingly subject to national legislation
• Part B of Schedule 4 of the Constitution, affords Eskom the power to reticulate electricity
within a municipal jurisdiction
• The power to supply and reticulate given to Eskom in terms of the national legislation
supersedes the municipalities’ executive authority and the right to administer matters listed
under Part B of Schedule 4
• Section 156 of the Constitution is not to be read in isolation
Eskom exercises its right to supply power and reticulate electricity within a municipal
area pursuant to its distribution license issued to it in terms of the ERA
Municipalities have similar rights in terms of their distribution licenses issued to them in
terms of the ERA. The respective rights co-exist in terms of the ERAActive Partnering... our contribution towards a
functioning industry
The unacceptable state of the wider electricity distribution industry (EDI)
is not debatable.
The industry is in need of a transformational type overhaul. Incremental
fire fighting fixes will not address the underlying issues.
Applying system thinking, we understand that the industry issues are all
interrelated and in the end they become your issues, regardless of
which side of the fence you reside.
A well functioning distribution industry is in the national interest.
Industry engagements and collaboration have been ongoing for a while
Eskom developed an Active Partnering approach as a vehicle toward
resolving some of the operational issues
222
The license issued to Eskom by NERSA authorises
Eskom to reticulate electricity within municipal areas
In terms of Section 156 (1) of the Constitution, municipalities have executive authority (not exclusive)
in respect of electricity reticulation
National government’s legislative and
National government executive authority is subject to section
44(1)(a)(ii), which confers on Parliament
the right to exercise its legislative
authority to pass legislation with regard to
any matter falling within certain functional
areas, including electricity reticulation
NERSA
Provincial government
(ERA)
Municipal government ESKOM
Municipalities have functions and Eskom exercises its right to supply power
executive authority over matters that and reticulate electricity within a
have been legislated upon and assigned municipal area pursuant to its distribution
for administration by municipalities in license issued to it in terms of the ERA.
terms of Section 156(1) of the
Constitution
Eskom’s and the Municipalities rights co-exist in terms of the ERAThe industry needs a different approach in dealing with
issues within the current policy dispensation, all stakeholders
need to resolve this to ensure service delivery…
Current Perspective on Industry Issues : Reporting, Data Sharing, Provision of Free Basic Electricity, Tariff
Parity, Credit Control and Debt Management, Public Lighting all affects Service Delivery to all Stakeholders
The unacceptable state of the EDI requires This provides us with an opportunity to
that industry players apply system thinking influence alternative solutions to address
towards resolving these issues industry issues
We have identified and developed an active We need to partner within the industry in
partnering approach that we believe will defining an industry operating approach that
address issues within the current industry addresses industry operational issues
structure
A different approach is required
Through this approach we have developed a • An approach that focusses more on resolving industry issues than on the
desired operating state institutional form of the industry
• An approach that will foster a shared commitment towards resolving
industry issues.
• An approach that effectively utilises the strengths and capabilities within
the industry to assist those players that lack these strengths and
capabilities
• An approach for the industry that effectively heals from within
• An approach that allows for some consolidation within the industry where
this make sense
• An approach where own interests are suspended and the national
interest dominatesFrom an industry perspective working towards a common
vision must continue, to build a sustainable industry going
forward
Active Operational
engagements(BAAM, customer
MOU) interaction
Common Industry Vision
Provide accessible and sustainable electricity services to South Africa
Active Industry Partnership
Research
COGTA Municipalities ESKOM NERSA
Institutions
Large Energy
DOE SALGA AMEU DPE
Users
Existing industry capacity
Build on existing industry relationships
External Capacity
Voluntary contribution to a repository of best practices for efficient electricity consumption and management
Eskom continues to partner within the Industry and Industry Stakeholders, with the aim of meeting the Customer’s
25
InterestsEskom Active Partnering Engagements
Collaboration efforts with SALGA on Industry and Operational Issues
Stakeholder Engagement Revenue Management Technical/Operational
Training
Intervention
Sharing Training
Signed MOU agreements Facilitating review on Credit OU Partnerships and programmes with SALGA.
Management burning issues engagements ongoing Training workshop
Technical Workgroup (payment periods, interest engagement SALGA and
Engagement rate charges, connection Points of Supply EDF
charges…) engagements and Draft Training Agreements
Legal Work group (In Intervention (Ekurhuleni Phumelela Munic (Vrede/
Progress Municipal Tariff Parity discussions) Warden in the Free State)
workshop has requested Eskom to
AMEU Workshops assist with training in their
Debt Management workshop revenue Department
Ongoing Steering discussions with SALGA New Energy Loss
Committees Management Module
….thus prompting Eskom to work on other actions in dealing with industry challenges.
Other
Distribution is currently engaging with other Industry Stakeholders and working with CoGTA
Further stakeholder interventions will be required to ensure Eskom plays a pivotal role in the industry.
261 Orientation on the Electricity Value Chain
Distribution, Customer Services and EDI
2
Concluding Remarks
3
27Concluding Remarks
We continue to respond to the changes in the social
economic and political environment.
In reference to our operational performance; we are
collaborating with all critical stakeholders through out the
industry whilst leveraging on our stakeholder relationships.
Customer Satisfaction remains the cornerstone for our
business in ensuring positive customer experience.
28You can also read