THE LEADER IN INSPIRATION-BASED HOME & LIVING ECOMMERCE IN EUROPE - *June 2019 - Investor ...

Page created by Jane Carter
 
CONTINUE READING
THE LEADER IN INSPIRATION-BASED HOME & LIVING ECOMMERCE IN EUROPE - *June 2019 - Investor ...
THE LEADER IN INSPIRATION-BASED
HOME & LIVING ECOMMERCE IN EUROPE

                                    *June 2019
THE LEADER IN INSPIRATION-BASED HOME & LIVING ECOMMERCE IN EUROPE - *June 2019 - Investor ...
Disclaimer

             Certain statements in this communication may constitute forward looking statements. These statements
             are based on assumptions that are believed to be reasonable at the time they are made, and are subject
             to significant risks and uncertainties. You should not rely on these forward-looking statements as
             predictions of future events and we undertake no obligation to update or revise these statements. Our
             actual results may differ materially and adversely from any forward-looking statements discussed on
             this call due to a number of factors, including without limitation, risks from macroeconomic
             developments, external fraud, inefficient processes at fulfillment centers, inaccurate personnel and
             capacity forecasts for fulfillment centers, hazardous material / conditions in production with regard to
             private labels, lack of innovation capabilities, inadequate data security, lack of market knowledge, risk
             of strike and changes in competition levels.

                                                                                                                         2
THE LEADER IN INSPIRATION-BASED HOME & LIVING ECOMMERCE IN EUROPE - *June 2019 - Investor ...
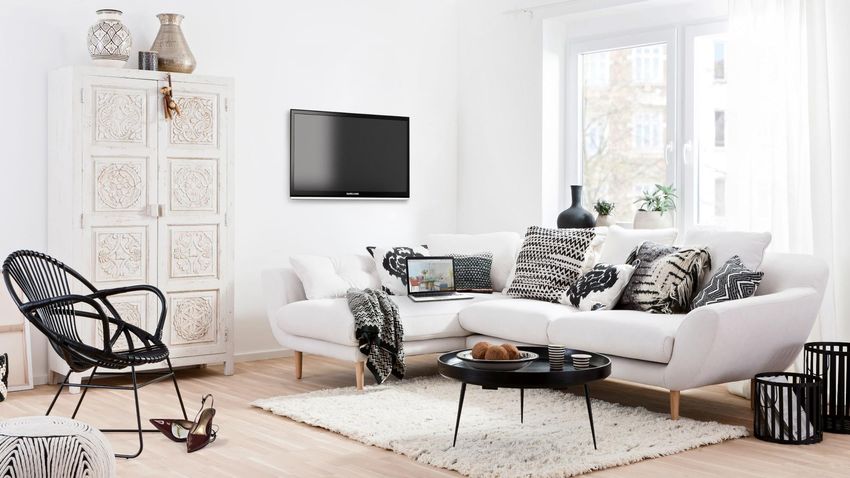
OUR MISSION

To inspire and make
every home a
beautiful home        3
THE LEADER IN INSPIRATION-BASED HOME & LIVING ECOMMERCE IN EUROPE - *June 2019 - Investor ...
Westwing has always been led by the founders

We are pursuing a long-
term vision to revolutionize
home & living

                                      STEFAN                               DELIA                              DR. DR. FLORIAN
                                      SMALLA                              FISCHER                                 DRABECK
                               Founder &                           Founder &                                  Chief Financial Officer
                               Chief Executive Officer             Chief Creative Officer
                                •   At Westwing since 2011          •   At Westwing since 2011                 •   At Westwing since 2011
                                •   20 years of professional        •   13 years of professional experience    •   12 years of professional experience
                                    experience, thereof 12 years    •   ELLE Magazine,                         •   RBR Capital Advisors,
                                    eCommerce/Internet                  ELLE Décoration                            Bain & Company
                                •   Bain & Company, dooyoo,                                                    •   2 PhD’s (Mathematics, Economics),
                                    Friendity, Daimler                                                             CFA

                                                                                                                                                     4
THE LEADER IN INSPIRATION-BASED HOME & LIVING ECOMMERCE IN EUROPE - *June 2019 - Investor ...
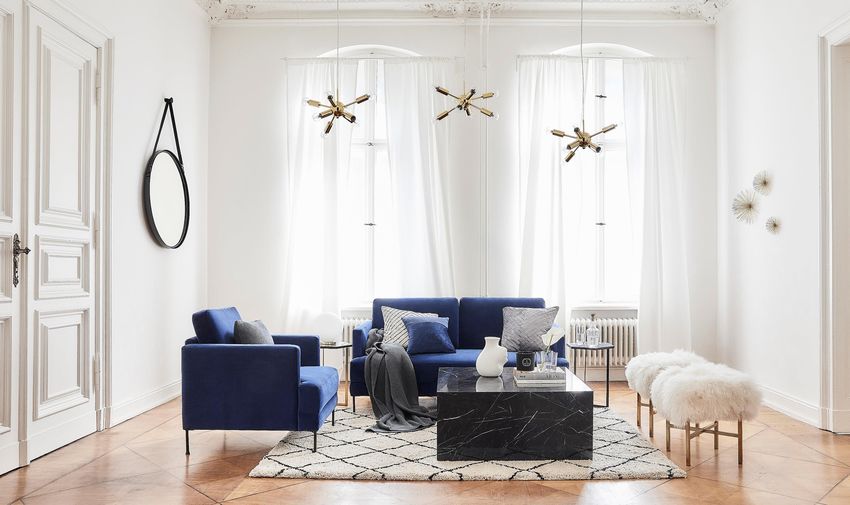
We founded Westwing 8 years ago to become the leading inspiration-based Home & Living
eCommerce brand in Europe
•   Our mission is “To inspire and make every home a beautiful home”

•   We sell beautiful home & living products like textiles, rugs, furniture, lighting, decoration

•   Westwing is a “curated shoppable magazine”, fresh every day

•   Our customers are 90% women, and they are very loyal:
    We do 85% of our sales with customers who visit us on average 100 times a year

•   The opportunity is massive: EUR 117bn market in our geographies, very early in eCommerce

•   Customer loyalty leads to profitable growth: EUR 254m in Revenue in FY 2018, we are Adj. EBITDA profitable, and
    have net cash of >EUR 100m on the bank

                                                                                                                      5
THE LEADER IN INSPIRATION-BASED HOME & LIVING ECOMMERCE IN EUROPE - *June 2019 - Investor ...
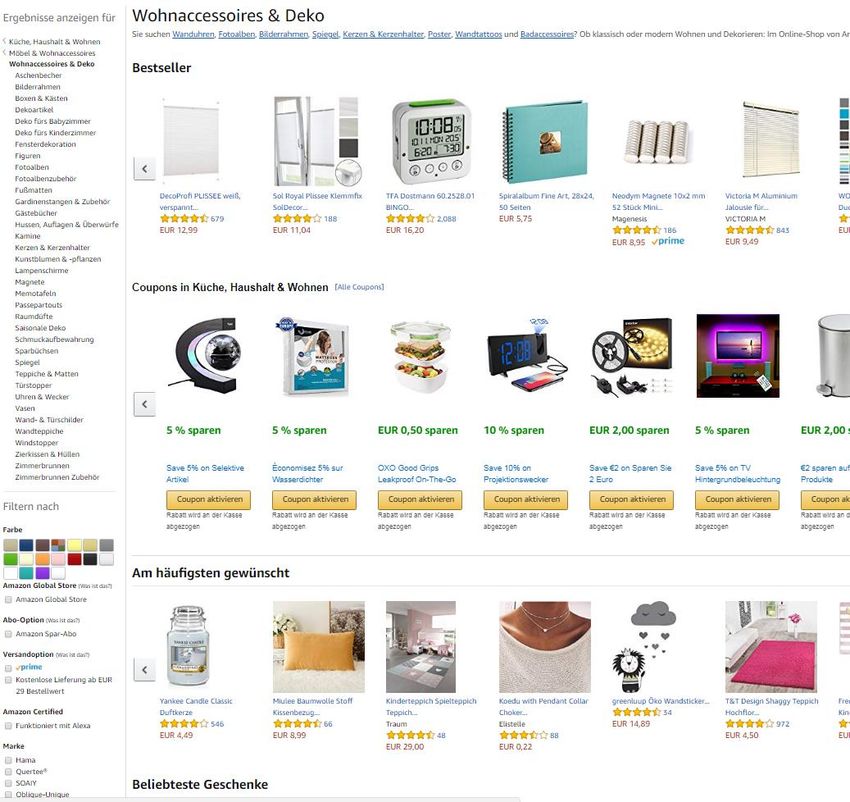
Our brand has very strong customer loyalty

                      85%
             of our sales are with
                customers who
              visit us on average

                   100x
                   per year

                                             6
THE LEADER IN INSPIRATION-BASED HOME & LIVING ECOMMERCE IN EUROPE - *June 2019 - Investor ...
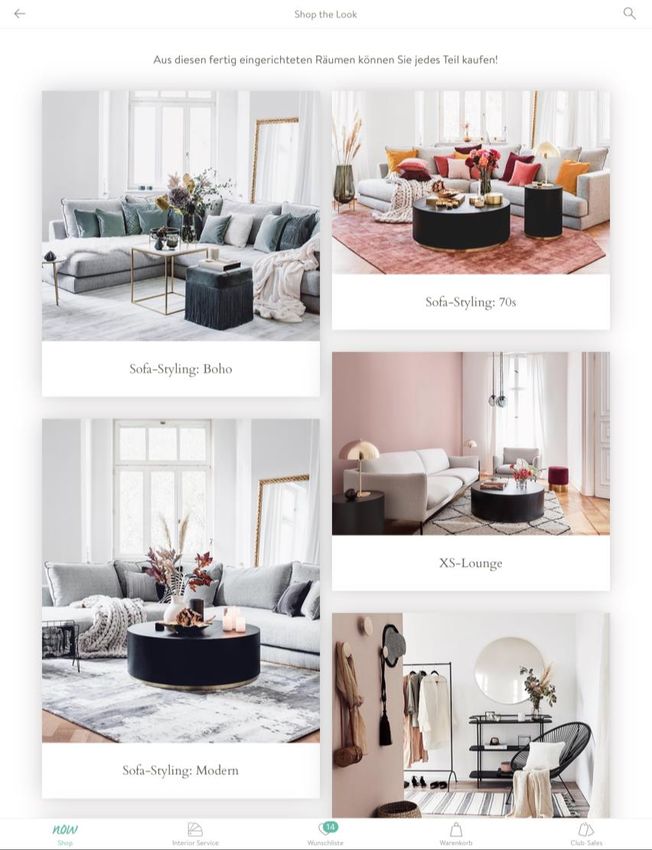
We focus on women as they take the vast
 majority of home decisions

                                                       90%
                                                       Women

                                           Westwing customers

Source: Westwing annual customer survey 2017 Germany
                                                                7
THE LEADER IN INSPIRATION-BASED HOME & LIVING ECOMMERCE IN EUROPE - *June 2019 - Investor ...
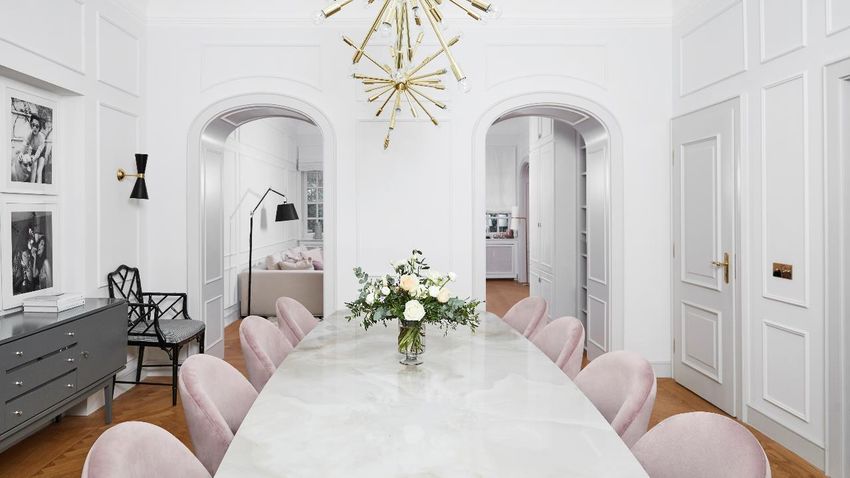
“Men buy, women shop”

                        • Women aged 25-60 years

                        • Interior decoration interested
                          Want guidance and ideas. Want their home as
                          stylish as their wardrobe

                        • Want to have a home not just a house,
                          see their home as reflection of their personality

                        • Enjoy redecorating and hosting,
                          important part of their lifestyle,
                          desire to add decoration pieces

                        • Enjoy bargains, no compromise on quality and style

                        • Impulse buyers, not necessarily always seeking to
                          completely re-furnish

                                                                              8
THE LEADER IN INSPIRATION-BASED HOME & LIVING ECOMMERCE IN EUROPE - *June 2019 - Investor ...
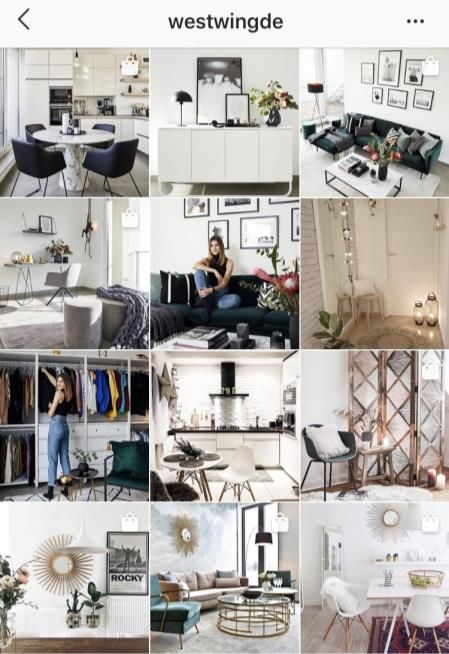
We are the leader in “inspiration-based eCommerce”,
which works much better for home & living than typical eCommerce

                                                     Typical eCommerce

                                      VS

                                                                         9
THE LEADER IN INSPIRATION-BASED HOME & LIVING ECOMMERCE IN EUROPE - *June 2019 - Investor ...
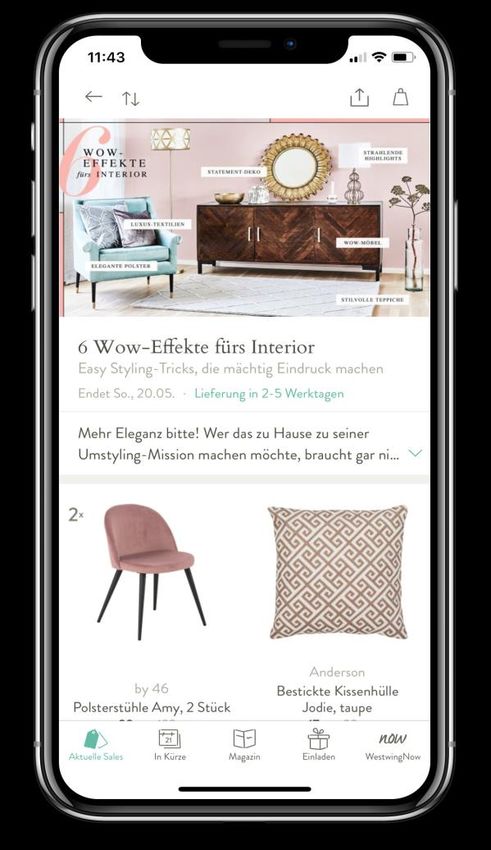
We uniquely combine inspiration and shopping in a
“curated shoppable magazine”

     Inspiration/Content                                       Commerce

                             Combining ‘best of both worlds’
                              in an online curated platform

                                                                          10
Westwing sells gorgeous, inspirational products across the full range
of the home & living category

                                                                      9%
                                                                      Other               23%
                                                     10%                                  Textiles
                                                     Lighting                             & Rugs

                                                 11%
                                                 Kitchen &
                                                 Dining

                                                       16%                                23%
                                                       Home décor &
                                                                                          Large
                                                       Accessories
                                                                              8%          Furniture
                                                                              Small
                                                                              Furniture

Note: Based on GMV 2018
                                                                                                      11
Our Creative Team is powering our brand and business model with
>100 world-class Creatives

Senior Creative Leaders (4 of 10 Senior Creative Directors)                                                           Full Creative Team >100 world-class experts strong

                                Munich                                                    Warsaw                      •   Creatives covering all business areas
                    Before founding Westwing, Delia                          Marta is an experienced home &               Marketing, Daily Themes, Permanent Assortment,
                    worked at ELLE Magazine / ELLE                           living journalist. Before Westwing,
                    Decoration / Burda Media as Editor                       she worked for the most popular
                                                                                                                          Own & Private Label, International
                    for Home & Living, Lifestyle and                         Polish interior design magazine
                    Beauty                                                   „Cztery Kąty“ and „Dom&Wnętrze“.
                                                                             She also ran a TV show. Marta
                                                                                                                      •   Key roles
                                                                             studies Exterior Architecture.               Editors, Creative Merchandisers, Stylists, Art Directors, Interior
DELIA FISCHER                                            MARTA
Founder &                                                SUCHODOLSKA
                                                                                                                          Designers, Photographers, Cinemagraphers
Chief Creative Officer                                   Creative Director
                                                                                                                      •   Typical backgrounds
                                Munich                                                      Milan                         Magazine editors-in-chief and editors (from home & living and
                    Before joining Westwing, Christine
                    worked for more than 20 years as a
                                                                             Alexandra is an architect and a
                                                                             product designer with a vast
                                                                                                                          fashion), Fashion stylists, Interior designers, Filmmakers,
                    journalist for several women                             international experience. She                Fashion photographers, Graphics designers
                    magazines such as EKKE, Marie                            worked as a product designer in the
                    Claire, Glamour, Vogue Business.                         biggest Design Studio in Brazil (India
                    Most recently, she was the deputy                        da Costa) and also as interior
                    editor-in-chief of ELLE Decoration                       designer at Esther Giobbi.
                    Germany
CHRISTINE BÜRG                                           ALEXANDRA
Founder &                                                TOBLER
Creative Director                                        Creative Director

                                                                                                                                                                                               12
We are targeting a huge addressable market ...

                                                                                                                                                      ~ €575bn
              Global
              Home & Living market(1)

              Westwing footprint
              Home & Living market(2)                                                                                                                 ~ €117bn

Source: Euromonitor
Notes: (1) Home & Living market defined as Euromonitor Passport: Home and Garden categories “Homewares” and “Home Furnishings”. Refers to global retail value sales including sales tax at current prices (EUR using 2017 fixed   13
exchange rates); (2) Home & Living market defined as Euromonitor Passport: Home and Garden categories “Homewares” and “Home Furnishings”. Refers to retail value sales including sales tax at current prices (EUR using 2017
fixed exchange rates) for countries in which Westwing is present
…that is at the tipping point of online acceleration

Online penetration by industry in                                                                 Home & living online                                                                     Comments
Westwing markets(1)                                                                               penetration by geography

   25%                                                                                               25%                                                                                   Drivers of online acceleration later than other
                                                                                                                                                                                           verticals
                                                                Consumer
                                                                electronics 24%(2)
   20%                                                                                               20%                                                                                   • Demographics: home & living customers are
                  5x Penetration                                                                                                                                                             typically older than e.g. fashion or consumer
                         Upside                                                                                                                                                              electronics customers
   15%                 Potential                                                                     15%
                                                            Fashion 14%(3)                                                                              US / UK 14%
                                                                                                         3x Penetration                                                                    • Shopping is not search-based, rather
                                                         Consumer
                                                                                                                Upside                                                                       inspiration-based, so search-based websites
   10%                                                   appliances 13%(4)                           10%      Potential                                                                      don’t work as well

                                                                                                                                                                                           • Highly fragmented market and no strong
   5%                                                                                                5%
                                                Home & Living (5)                                                                                                                            brands to push eCommerce adoption
                                                                                                                                                 Markets(5)
   0%                                                                                                0%                                                                                    • Complex operations that need to be set up
                                                                                                                                                                                             due to breakable and large-sized products
                Early days         Acceleration            Growth                                                Early days         Acceleration           Growth

Source: Euromonitor
Notes: (1) All numbers refer to countries in which Westwing is present; online market size refers to internet retailing sales; in EUR using 2017 fixed exchange rates as per June 2018; (2) Consumer electronics market defined as           14
Euromonitor Passport: category Consumer Electronics; (3) Fashion market defined as Euromonitor Passport: category Apparel and Footwear; (4) Consumer Appliances market defined as Euromonitor Passport: category Consumer
Appliances; (5) Home & Living market defined as Euromonitor Passport: Home and Garden categories “Homewares” and “Home Furnishings”.
Huge opportunity in Home & Living eCommerce for Westwing

Opportunity for Westwing when comparing                                                                                                      Opportunity for Westwing when comparing
to other industries: Fashion                                                                                                                 to other Geographies: US
         €222bn(1)                                                                                                                                €250bn(3)

                                    €117bn(1)                                                                                                                               €117bn(1)

                                                                                                                                                                                                         €5bn(4)
                                                              €2.8bn(2)

                                                                                        €254m                                                                                                                                €254m
          Fashion              Home & Living                                                                                                     US          European
          Market                 Market                                                                                                      Home & Living Home & Living
     in Westwing countries       in Westwing countries
                                                                                                                                               market         market                                         US
                                                                                                                                                                          in Westwing countries

Notes: (1) Euromonitor Passport. Home & Living market: Home and Garden categories “Homewares” and “Home Furnishings. Fashion market: category Apparel and Footwear. Global retail value sales including sales tax for
Westwing countries (2) Asos global retail sales as of FY 2018 ended 31 August 2018, ~32% of revenues are outside Europe and UK (3) 2018 US Home and Living market as per Euromonitor, Wayfair estimates (4) Wayfair US Net           15
Revenues FY2018
Highly fragmented & subscale
            supplier base leading to the
            absence of strong consumer
            brands in Home & Living market

                                     Cushion

                                      ?
            APPLE

                                           16
14 of 4 4
We are active in 11 countries in Europe

  52%
  DACH
  SEGMENT
  (3 countries)

  48%
  INTERNATIONAL
  SEGMENT
  (8 countries)

Note: Segment basis is FY 2018 Revenue
                                          17
Highly scalable platform with full value chain control

Inspiration &                   Integrated supply               Fulfillment                   Customer service
Curation                        chain

• Dedicated, creative staff     • 3rd party and Own & Private   • 6 warehouses with           • 5 local customer service
  including over 100 editors,     Label                           c. 75k sqm                    centers
  journalists and content
                                • 5,000 suppliers from across   • 20 last-mile carriers and   • 116 FTE
  creators
                                  the globe                       multiple other logistics
                                                                                              • 453k new calls p.a.
                                                                  partners
                                • Growing share of Own &                                      • 630k new emails p.a.
                                  Private Label                 • 15 payment methods
                                                                                              • 44k chats p.a.

Note: As of Dec 2018
                                                                                                                           18
Our full business model: Rolled out in DACH since 2015;
international roll-out ongoing

Tapping comprehensive platform                               Virtuous cycle of all elements working together

                                                                             Organic             Daily Themes
     Creatives              Technology           Logistics                  Marketing

                                                                                         BRAND

                 Strategy            Processes
                                                                               Own &             Permanent
                                                                               Private           Assortment
                                                                                 Label

                                                                                                                19
We operate a unique business model where we acquire customers in one model
and monetize them in both models

               • Efficient acquisition and                                          • Scalable supply at
                 retention                                                            even higher margins
               • Very high customer engagement                                        (esp. Own & Private Label)
                 and repeat purchases                                               • High growth and profitablity
               • Rich data on customer                                              • Leverage collected customer data to
                 preferences and supplies                                             offer relevant assortment

          Acquire, retain, engage                                         Cross-sell and up-sell
                                                       PLATFORM
                    (Own & Private Label, marketing, technology, warehouses, data, etc.)

                                                                                                                            20
Own & Private Label is our most powerful strategic initiative

Own & Private Label share (% of GMV)

   50%

                                                          Strategic target   • 5,000 + Own & Private Label SKUs
   25%
                                                                  DACH
               Own & Private Label                Q4-2018: 24%               • Beautiful products that our customers crave and desire
               upside potential
   20%                                                        DACH
                                              Q4-2017: 20%                   • Full control over supply chain and quality

                                           Q4-2018: 18%
                                                                             • Highly competitive pricing
   15%

                                                                             • Contribution margins are ~10ppts higher
   10%                                 Q4-2017: 12%

   5%

   0%

                                                                                                                                        21
Some of our bestselling Own & Private Label products

  VELVET SOFA ALVA                                                    DECORATIVE FUR CODY     BED LINEN MARLA
  Price: €999                                                         Price: €49              Price: Starting at €29.99(1)

  RUG JANE                                                            XL HANGING LAMP SPIKE   ARMCHAIR CLAIRE
  Price: Starting at €119(1)                                          Price: €199             Price: €114

Notes: German selling prices including VAT and are as of March 2019
(1) Price depends on size                                                                                                    22
Organic Marketing model is asset-building and leverages our most important and
fast-growing channel Instagram

                 • We use our content from daily
                                                        Instagram followers at 1.5 million across Europe
                   themes and content produced in
                   our social media film studio         1.50m

                 • Free user-generated content
                                                                     Massive
                                                        1.25m        increase in followers
                   #mywestwingstyle and
                   influencers to expand our reach
                                                        1.00m
                 • All based on our unique creativity
                   and our love brand (hard to copy     0.75m
                   for competitors)

                                                        0.50m
                 • Massive results after a few years
                   with largely stable cost base
                                                        0.25m

                                                           2016–40                                         2019-08

                                                                                                                23
Our DACH segment is leading the way

                                                                     Results FY 2018

Key elements of strategy                                          Share of Group Revenue

 •   Daily themes and loyalty model                                      52%
 •   Permanent bestseller assortment
                                                                    Revenue growth of
 •   Focus on Own & Private Label

 •   Brand building and Organic Marketing                                36%
                                                                   Adj. EBITDA margin of

                                       International rollout of           4%
                                      DACH role model ongoing

                                                                                           24
Result #1: Substantial customer lifetime value

Cumulative GMV per customer DACH over 5 years                                          Exemplary real customer purchases
 (in EUR)
                                                                                       Helene L. from Augsburg (Germany)(1), some of her
   Ꞓ1,000                                                                              lifetime Westwing purchases

      Ꞓ800

      Ꞓ600

      Ꞓ400

      Ꞓ200

         Ꞓ0
                    First             1 year   2 years   3 years   4 years   5 years
                    purchase

Scope: DACH, 2013 First Time Buyers
Note: (1) Customer name and city anonymized                                                                                                25
Result #2: Best-in-class marketing ratio

Marketing ratio
 (in % of Revenue)

                                                                                                                                                                                                                               21%

                                              Mid-term guidance
                                                    6-9%                                                                                                                      11%

                                    7%                                                                                           7%

                                                                                  4%

                                                        (1)                                   (2)                                            (3)                                           (4)                                       (5)

Source: Company reports
Notes: (1) Westwing as FY 2018; (2) Asos as FY 2018 ended 31 August 2018; (3) Zalando as FY 2018; (4) Wayfair as FY 2018 includes advertising costs; (5) Home24 as LTM per Q3-2018. Q4 2017 from Home24 prospectus, YTD 2018               26
from financial publications, includes above the line marketing share-based compensation expenses related to media service agreements
Result #3: Superior CLV/CAC(1) ratio ahead of other eCommerce companies

CLV/CAC ratio (12 months)

                            1.9x

                                                                                      1.5x

                                                                                                                                               1.2x
                                                                                                                                                                                                         1.0x

                                               (2)                                                 (3)                                                            (4)                                               (5)

Notes: (1) CLV = Customer Lifetime Value, CAC = Customer Acquisition Cost; (2) Westwing average Q4 2016 and Q1 2017; (3) Target 12m CLV/CAC ratio mentioned in home24’s prospectus. Home24 numbers do not include
branding/TV cost so actual LTV/CAC is lower; (4) October 2011 cohort for Germany as per Zalando disclosure in IPO prospectus; (5) Target 12m CLV/CAC ratio mentioned in Wayfair earnings call transcript Q4 2017          27
Financials: We are profitably growing

          Phase I: Rapid                                                                Phase II: Move to                                                              Phase III: Profitable growth
          growth/rollout                                                                profitability
                                                                                                                                                                                254
            Revenue                                                                                                                               220
            (in EUR m)                                                                                                   205
                                                                                                                                                                                                      • Expected revenue growth
                                                                                                 174
                                                                                                                                                                                                          2019: 6% to 12%
                                                                135
                                                                                                                                                                                                      • Expected Adj. EBITDA 2019:
                                         78                                                                                                                                                               Break-even (-1% to +1%)

                                                                                                                                                                                                      • Expected Cash profile:
                                                                                                                                                                                                          Continued highly efficient,
              2012                     2013                    2014                             2015                    2016                    2017                           2018
                                                                                                                                                                                                          best-in-class cash profile
            Adj. EBITDA margin                                                                                                                                                    1%
                                                                                                                                                    (2%)
            (% of Revenue)                                                                                                 (6%)

                                                                                               (24%)

Note: Preliminary and unaudited; All figures continuing operations (ie excluding Brazil and Russia); Adj EBITDA excluding share-based compensation expenses, IPO costs recognized in profit and loss and central costs allocated to
discontinued operations (Brazil and Russia were sold in Oct/Nov 2018, central costs were allocated for full year due to eg ongoing handover)                                                                                            28
Our Contribution Margin is attractive at 21%, with a 43% Gross Margin
and 22% Fulfilment expenses

Revenue and cost breakdown FY 2018
 (EUR, in % of revenue, unaudited)

                                 Average order value                                                   €121

                                              Return rate                                              14%

                                                    Revenue                                     100%

                                            Cost of Sales                                       57%

                                           Gross margin                   43%

                                  Fulfilment expenses                     22%

                                 Contribution margin
                                                                    21%

                                  Marketing expenses
                                                                    7%         Very high
                                                                          Contribution Margin
                           Contribution margin less                         after Marketing
                                                              14%
                               marketing expenses

Scope: Group, excluding share-based compensation.
                                                                                                              29
Westwing has best-in-class cash efficiency and net cash reserves of EUR 108m1
Working Capital Ratio comparison                                                                                                           Capex Ratio comparison
(% of Sales)                                                                                                                               (% of Sales)

25%                                                                                                                                      10%

20%
                                                                                                                                            8%

15%
                                                                                                                                            6%

10%

                                                                                                                                            4%
 5%

                                                                                                                                            2%
 0%

-5%                                                                                                                                         0%
              Offline           Online           Online           Online           Online                            Offline                             Online           Online          Offline    Offline     Online    Online
              Fashion          Fashion          Fashion          Fashion          Home &                             Fashion                            Fashion          Fashion          Fashion    Fashion    Fashion   Home &
             Company          Company          Company          Company            Living                           Company                            Company          Company          Company    Company    Company     Living
                                                                                  Company                                                                                                                                 Company

Source: Berenberg „General Retail: Safety in numbers?“ Feb 14, 2019; Westwing based on FY 2018; Capex is defined as sum of property, plant, equipment, and intangible asset purchases.
                                                                                                                                                                                                                                    30
Our business combines a number of drivers for profitable growth

Structural tailwinds:                                    Own & Private Label increase:
Online transition of €575bn                             Scale offering, internationalize,
Home & Living market                                            personalized marketing

Technology innovations,                                          DACH business model:
especially Augmented                                             Rollout to our current
Reality (AR) and mobile                                           international markets

Customer experience,                                                  Expand into new
e.g. social media, last-mile                                    geographies, especially
delivery                                                          non-covered Europe

                                                                                            31
Contact:
Westwing Group AG
Moosacher Strasse 88
80809 Munich
Germany
www.westwing.com

          DACH Press
          Hannah Neumann
          presse@westwing.de

          International Press
          Julia Schygulla
          global-pr@westwing.de

          Investor Relations
          Vidhi von Liel
          ir@westwing.de
Basic Information

    Westwing Definitions

       Gross Merchandise Volume (GMV): Value of all valid customer           Marketing ratio: Marketing costs as % of Revenue in a given period
       orders placed in a given period. (i.e. excluding cancelation, but
       including returns), excluding VAT.                                    Customer acquisition costs (CAC): Total Marketing Costs of a
                                                                             reporting period divided by First Time Buyers of the same reporting
       Revenue: Value of all valid customer orders shipped in a given        period
       period excluding cancelations, returns and VAT
                                                                             Customer lifetime value (CLV): Cumulated contribution profit per
       Adjusted EBITDA: EBITDA adjusted for share-based compensation         customer since first order over specified time period
       expenses, IPO costs recognized in profit or loss, and central costs
       allocated to discontinued operations                                  Net Working Capital (NWC): Inventories plus prepayments on
                                                                             Inventories plus Trade and other Accounts Receivables less Trade and
       Private Label share of GMV: GMV of Private Label business as % of     other Accounts Payable less Customer prepayments
       GMV Group in the same reporting period
                                                                             Capex: Purchase of property, plant and equipment plus Purchase of
       Number of orders: Total number of valid orders (i.e. excluding        intangible assets (including capitalized technology costs)
       cancelation)

                                                                                                                                                    33
Basic Information

    KPI overview

   Group KPIs                                                                  Unit          Q1 2017   Q2 2017   Q3 2017   Q4 2017   Q1 2018   Q2 2018   Q3 2018   Q4 2018
   Own and Private Label share                                                 in % of GMV       7%        9%       11%       12%       13%       15%       18%       18%
   Active customers                                                            in k             794       788       802       838       881       907       921       934
   Number of orders                                                            in k             510       492       496       723       611       555       507       726
   Average basket size                                                         in EUR           115       114       114       113       119       120       124       122
   Average orders LTM per active customer                                      in #              2.6       2.7       2.6       2.7       2.6       2.6       2.6       2.6
   Average GMV LTM per active customer                                         in EUR           289       293       297       301       302       305       307       312
   GMV                                                                         in EUR m          58        56        56        81        72        67        63        89
   Mobile visit share                                                          in %             67%       69%       71%       71%       72%       73%       74%       74%

    Note: All figures continuing operations (ie excluding Brazil and Russia)
                                                                                                                                                                       34
Basic Information

    Westwing Shareholder structure

    Shareholder structure                                                             Founders with long term commitment and
    as of Jun 2019 based on Voting Rights disclosures                                 incentive
                                                  Kinnevik
                                                  13.5%                               • Pre-IPO investors have a 180 day lock-up period
                                                                                        that expired on 8 April, 2019
                                                             The Capital Group        • Top ~20 founders and managers with
                                                             8.0%
                                                                                        24 months lock-up
         Public Float/
                Other
                                                               Access Industries      • “Long-term incentive program 2019” vests for
                46.5%
                                                               6.9%                     top ~20 people only end of 2022. There is no in-
                                                                                        between vesting and constitutes ~10% pts of
                                                             Summit Partners            the 19% fully diluted active management
                                                             6.9%                       shareholding
                                                          Ruane, Cunniff & Goldfarb
                           Odey                           5.5%
                           3.0%                    Tengelmann Ventures
                                          Fidelity 4.9%
                                             4.8%

                                                                                                                                           35
International

    Replication of DACH business to International Segment progressing very well

     DACH is a fast-growing business model …                                                                                                                … successfully being rolled out in
                                                                                                                                                            international markets

        • DACH highly attractive: EUR 133m revenue,                                                                                                         • International markets have had daily themes
          36% yoy growth, +4% Adj EBITDA                                                                                                                      and loyalty model from the beginning, and
                                                                                                                                                              are learning from DACH with local focus
        • Daily themes and loyalty business model as
          customer acquisition and retention machine                                                                                                        • Permanent assortment already rolled out
                                                                                                                                                              to 6 of 8 markets, thereof 3 new in 20182
        • Permanent assortment WestwingNow since
          2015, for up-selling and cross-selling                                                                                                            • Own Label and Private Label offering
                                                                                                                                                              approaching 10% of GMV
        • Rapidly growing share of Own Label and
          Private Label (24% of GMV in Q4)                                                                                                                  • Ramping up Organic Marketing for
                                                                                                                                                              international markets
        • Organic Marketing driving strong growth and
          branding at only 6% marketing ratio1                                                                                                              • Country-by-country, we are following the
                                                                                                                                                              DACH example, e.g. Poland3 farthest along
    Note: Preliminary and unaudited; (1) Target marketing cost ratio at 6-9% of revenues; (2) Poland, Italy, France launched in 2018; Spain launched in Q1 2019; as of today, permanent assortment is live in 6 international markets;
    (3) Poland is CEE i.e. includes Czech Republic and Slovakia                                                                                                                                                                          36
International

    Permanent assortment WestwingNow live in 9 of 11 Westwing countries

          9

          8

          7

          6

          5

          4

          3

          2

          1

          0

                                                                                                                           Q2 -18
                Q1-15

                        Q2 -15

                                 Q3-15

                                         Q4-15

                                                 Q1-16

                                                         Q2 -16

                                                                  Q3-16

                                                                          Q4-16

                                                                                  Q1-17

                                                                                          Q2 -17

                                                                                                   Q3-17

                                                                                                           Q4-17

                                                                                                                   Q1-18

                                                                                                                                    Q3-18

                                                                                                                                            Q4-18

                                                                                                                                                    Q1-19
                                                                                                                                                        37
International

    International rollout of business model: What’s next

       • Daily Themes: Optimize in every market (launched mostly in 2011/12),
         increasingly leverage synergies from pan-European suppliers and with organic marketing

       • Permanent Assortment: Ramp up in recently launched markets (Netherlands/Belgium 2017,
         Poland/Italy/France 2018, Spain 2019), launch remaining markets (Czech/Slovakia), and
         continue to further optimize in DACH (launched in 2015/16)

       • Private Label: Expand category scope continuously in all markets, and drive penetration towards
         long-term goal of 50% share especially via Permanent Assortment business

       • Organic marketing: Strongly invest into social media internationally (e.g. increase content/social
         media marketing team); leverage assets across all markets

                                                                                                              38
Growth

   Strong cohorts: High customer loyalty drives profitable growth

    DACH GMV break down by customer cohort
    (in EUR m)
                                                                                        +41
                                                                                                        158

                                                             +25
                                                                         117
                                   +21
                                                                                        84%
                                                92
                                                             81%
                    71
                                   81%

                   2015                        2016                      2017                          2018

                          New Customers GMV   Repeat Customer GMV   xx   Repeat customer GMV retention as % of prior year GMV

                                                                                                                                39
P&L deep dive
    Strong operating leverage drives profitability:
    G&A ratio improved from 28% in 2015 to 17% in 2018

    G&A costs over time
    (EUR m, in % of revenue)

                                               49
                                                       44                        45
                                                                                        42

                                              28%

                                                       22%                       21%
                                                                                        17%

                                             2015      2016                      2017   2018

                                                       SG&A ratio   SG&A costs

    Note: 2018 numbers are preliminary and unaudited
                                                                                               40
P&L deep dive

    DACH Segment and International Segment: P&Ls

    Segment revenue and adj. EBITDA development
     (EUR, in % of revenue, 2018 unaudited)

                                                                                  2015                2016                 2017                     2018

     DACH
                                                                                                                                                                                       • DACH is where we have
                                                                                                                                                                                         implemented the complete
        Revenue                                                                       62                   79                  98                     133
                                                                                                                                                                                         business model first (i.e. daily
        Adj. EBITDA                                                                 (13)                  (3)                    1                         6                             themes, permanent
        Adj. EBITDA margin                                                      (21%)                  (4%)                   1%                       4%                                assortment, Own & Private
                                                                                                                                                                                         Label, organic marketing)
     International
                                                                                                                                                                                       • We have started to roll it out
        Revenue                                                                     112                  126                 122                      121                                to our International Segment.
        Adj. EBITDA                                                                 (29)                  (9)                  (5)                     (3)                               Most countries progressing
                                                                                                                                                                                         well.
        Adj. EBITDA margin                                                      (26%)                  (7%)                (4%)                     (2%)

    Note: Preliminary and unaudited; All figures continuing operations (ie excluding Brazil and Russia); Adj EBITDA excluding share-based compensation expenses, IPO costs recognized in profit and loss and central costs allocated to
    discontinued operations (Brazil and Russia were sold in Oct/Nov 2018, central costs were allocated for full year due to eg ongoing handover)                                                                                          41
NWC & Cash Flow

   Neutral Net Working Capital: Low inventories and strong supplier payment terms

    Net Working Capital (NWC) break down
    (EUR m)

                                                                                                               10

                                  23                                        2

                                                                                                                              -32

                                                                                                                                              -8

                                                                                                                                                        -5
                           Inventories                          Prepayments                               Trade & other   Trade & other     Customer    NWC
                                                                on inventories                             receivables       payables     prepayments

    Note: Preliminary and unaudited; All figures continuing operations (ie excluding Brazil and Russia)
                                                                                                                                                              42
NWC & Cash Flow
   Very strong balance sheet based on cash at hand and extremely cash-efficient
   business model

            Cash                                                                                                                                  Adj EBITDA to Free Cash Flow
            (in EUR m)                                                                                                                            (in EUR m)
                                                                                                                       EUR 108m
                                                                                                                       Net Cash2

                                                                                                                  123                                              3

                                                                                               114
                                                                                                                                                                                        -12

                                                                                                                                                                                                               -1

                                                                                                                                                                                                           4             -5
                     14
                                        -10                 4                  0

                Cash SoP Operating Investing    Disc.    Financing Cash EoP                                                                               Adj. EBITDA                Change Investing CF1 IPO cost/      FCF
                            CF        CF 1   Operations/ CF        FY 2018                                                                                 FY 2018                  in NWC3               Dis./ Tax/   FY 2018
                                              FX effects                                                                                                                                                    Other
    Note: Preliminary and unaudited; Free Cash Flow defined as the sum of Operating Cash Flow and Investing Cash Flow; (1) Investing Cash flow includes ~11m of proceeds from sale of Brazil and Russia;
    (2) Net cash calcualted as EUR 123m in cash less EUR 15m debt = EUR 108m; (3) Change in Net Working Capital based on Net Working Capital definition presented on previous slide.                                             43
OUR MISSION

To inspire and make
every home a
beautiful home        44
You can also read