Revaluation of teaching: improving presentation activities at high school
←
→
Page content transcription
If your browser does not render page correctly, please read the page content below
Received: 31 May 2017
                                                                                                               Accepted: 21 June 2017
                                                                                                               Published: 15 July 2017
Journal of Applied Multimedia 2./XII./2017

  Revaluation of teaching: improving presentation
             activities at high school
                                             Beáta Berkéné Varbíró* — Dávid Berke**
                                                *Vajda
                                                   János Gimnázium, Keszthely
         **Budapest    University of Technology and Economics, Faculty of Electrical Engineering and Informatics
                       Doctoral School of Informatics, Department of Networked Systems and Services
                                      berkene65@gmail.com* — berked@hit.bme.hu **

Abstract — Applications of the proper presentation skills                                    I. INTRODUCTION
and abilities is typical, and important in our digital society,
                                                                             In this paper, we are presenting the most important
nowadays. This active knowledge can be used by students
not only during their secondary school or academic years
                                                                         components of our presentation improver program in
but also during following years. Our opinion is that
                                                                         2016/17 education period, which is the second year from
supporting high school students in special parts of                      four. After this introduction which serves as a short
presentation activities, like text and image management,                 summary of contents, we are going to describe what tools
usage of multimedia, and right techniques of presentation                and methodologies had been applied by us to improve
communication,        improves       student’s        information        presentation activities of the students, especially in case of
technological skills, helps in their common communication,               teamwork. We are also going to present what tools of
and adds some engineering and artistic attitude as well. In              multimedia had been used by the students for the purpose
addition, via presentation activities self-assessment and                of communication and effective teamwork (II. Working
teamwork also can be supported and improved [3, 4].                      flow of presentation activities).
On the Multimedia in Education (MMO) international                           We are dedicating an own chapter for result
conference in Keszthely 2016, we have shown our own-                     evaluations, which contains not only the result but the
designed education methodology firstly, thorough which                   applied statistical methods as well. The most complex
presentation activities of secondary school students can be              result compilation will be come at the end of the 4th year,
measured and improved [1]. We were presenting the details                presumably on summer of 2019. Now, we are presenting a
of this methodology in last year, as well as group members               little bit easier way comparing placement test results to the
of the student who had been involved into our four-year                  second-year ones (III. Statistical evaluations on 20016/17
long learning program. This program fits into the main                   results).
curriculum of a high school class in Keszthely. During these
                                                                             The third part of this paper contains following elements
years we would like to improve the control class’s
                                                                         of our four-year methodology like adaptability. Our goal
presentation activities gradually, the personal and the team
                                                                         in this case teaching students how they can handle, adapt
working skills as well.
                                                                         to, or get used to different types of presentation
The students should participate lessons held by
professionals. During these lessons the students get to know
                                                                         environment, like exam situations, teaching effects or
about different parts of presenting, like basic graphics, data
                                                                         giving basic information (IV. Summary, further
and metadata handling, teamwork, purposes of the                         objectives).
presenter, environment of the presentation, animation and                 II.   WORKING FLOW OF PRESENTATION ACTIVITIES
visualization, multimedia management, presentations at the
Hungarian universities.                                                     In this chapter, we are going to specify and summarize
In every year, the student team members should create two                all IT and pedagogical tools, elements and components
different presentations individually or in small teams. These            which were used by us from the past year. We are going to
exercises include processing and collection of proper                    describe what kind of presentation exercises had to be
literature, design of a presentation slideshow, sketches of the          done by student teams, and what was the way of the
presentation speech, presenting verbally, participating in
                                                                         creation of those teams.
evaluation, and self-assessment.
For our part evaluation is done according to an own-                     A. Preparations, presentations exercises [9]
designed scoring guide which contains four presentation
activities: expression, content, visualization, text. In 2016, we           Our control group was a specific mathematical class
presented this scoring guide as our main tool of the                     with 18 persons (16 boys and 2 girls) from Vajda János
evaluation. In addition, results of a placement test in the              Secondary School, Keszthely. Our first task was an
education period 2015/16 was also presented. According to                introduction, where they had to introduce our class (in a
these results we had diagnosed that the knowledge of the                 professional way) for primary school students
students was middle-high, dispersion wasn’t uniform. We                  theoretically.
had noticed all the students had been problems with proper
                                                                            On the second half of the year they had to present about
usage of text contents.
In this paper, we would like to present results of the second            proportionality in different areas: nature, human,
year, and comparing to the aforementioned results of the                 architecture and arts.
placement test.                                                          B. Team organization
Keywords: presentation activities, statistical evaluation, skills           At the fist exercise students had a chance to organize
development, secondary school, self-assessment                           teams themselves. As a result, there were four teams, who

                                                                    15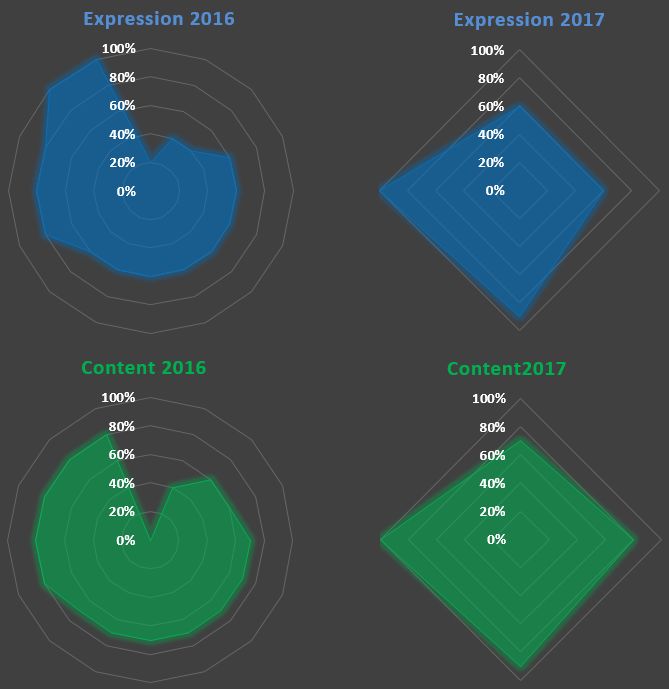
Journal of Applied Multimedia 2./XII./2017

had to hold a 10-min long presentation in front of their
teacher one of us. Right after the presentations had been
evaluated team by team in a verbally way. It was just a
short reaction near to fill a score guide. The scientific
lever was proper and there was the same in case of three
teams, but the fourth team had taken some mistakes in
expression as well as content part of the presentation.
Those three teams which could reached a proper level,
                                                                                 Table 2 – Class’s Kolb-map evaluation
gave a chance to repeat their presentation in from of
primary school students, at the Open Day of our school.                The dispersion of the class members was not uniform
They liked that possibility so much, preparation for this           so that we reorganized teams according to learning styles
event has not been a simple homework already, but also              with learning habits together. As a result, we had 1-1 team
an honor for us. Teams accepted our proposals and                   which use to use divination, use to be an active
suggestions to make their presentation better. As a result,         experimenter, an abstract conceptualization, and finally a
                                                                    consciously observation (see last line on Table 3).
primary school students were interested in their
performance.
   At the second half of the year we changed the
composition of the teams because the fourth team had
reached too weak results at the first exercise as we
mentioned. We didn’t want to compile teams arbitrarily,
thus we did it using a pre-compile survey about learning
behavior of our students [16]. This survey was a Kolb-test
which contains 12 different questions about personal
learning behavior, tools, and materials [2]. As a result,
                                                                            Table 3 – Team reorganization based on Kolb-map
form our students there were 2 persons in learning style A,
4 persons in learning style B, 8 persons in C and finally             In Table 3 we can see proper information from Table 1
the remained 4 persons in D (see 1st line on Table 1).              and Table 2 which could be important for the
   Right after the A, B, C, D members discussed together            reorganization of our teams.
what was the three most important common learning                   C. Presentations in academic year 2016/17
elements what they use to apply (see 2nd, 3rd, and 4th lines
                                                                      Presentations about proportionality had been on April
on Table 1). After that it was possible to define the               2017. Every team could be finished with their exercises,
dominant learning techniques in each category (see last             and added personal and unique elements into their slide
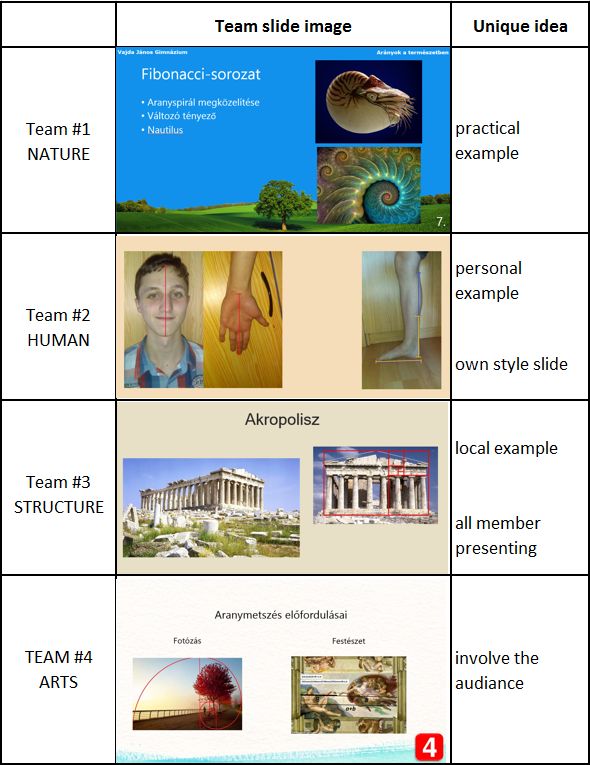
line on table 1).                                                   show. On the following table, Table 4. 1-1 slide (as a
                                                                    snapshot) can be seen from all four of them, and also the
                                                                    most important unique elements of the presentations.

               Table 1 – Student result of the Kolb’s test
          th
   On 20 December in 2016. According to the previous
investigation everybody was able to create an own Kolb-
map which contains a Descartes coordination system with
four axes: A, B, C and D. Students calculated values of
these parameters which presented the aforementioned four
different learning styles. Due to the mechanism of the
Kolb-map creation, learning styles are not independent
from each other. As a result, Kolb-map identify four
different learning habits: divergent, adaptable,
convergent, assimilating (see on Table 2).

                                                                               Table 4 – Snapshots from the presentations

                                                               16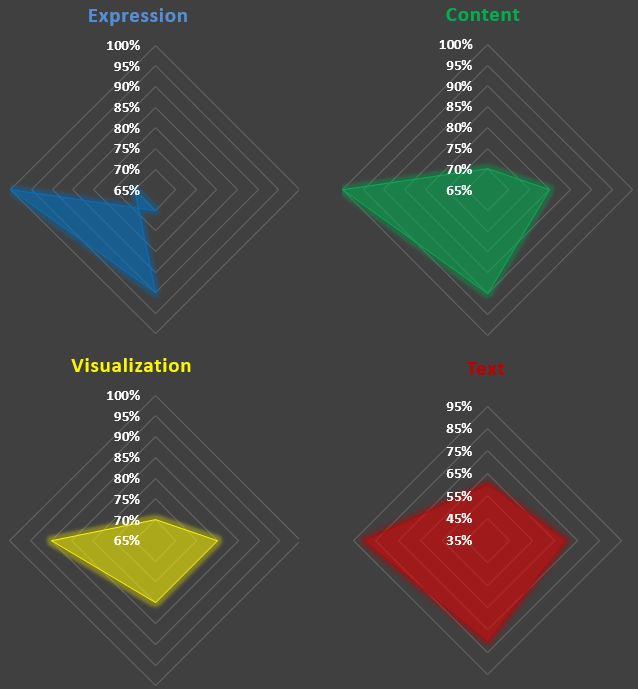
Journal of Applied Multimedia 2./XII./2017

   After the presentations teams were using our scoring              a short summary about other team’s presentations
guide evaluating other teams, moreover they had to                   including advantages and disadvantages.
complete it with a short justification in a paper format. As
we mentioned we could use our scoring guide in which                 D. Education materials
the whole presentation is divided into four different                  During this one-year period we were holding lectures at
presentation activates: expression, content, visualization,          classroom two times about How to work as a member of a
and text. Every activity consists of 5 presentation                  working team. The first lecture was theoretical, on the
viewpoints which describe a given activity. The scoring              second lecture one of them was speaking about personal
guide includes all activities with their viewpoints (see on          experiences in the area of team working at university and
Figure 1.). An evaluator person can give only 0, 0.5, or 1           engineering environment as well [10, 11].
point to every single viewpoint independently [1].                     We made some electrical documents as materials
                                                                     available for our students on a cloud system. Using cloud,
                                                                     we could share exercise requirements, deadlines,
                                                                     specifications and results of evaluations easily. We could
                                                                     check out all those documents which had to be made by
                                                                     the teams like [14, 15]:
                                                                           •    presentation slideshow,
                                                                           •    summary of presentation speech,
                                                                           •    used references,
                                                                           •    working diary.
                                                                     E. Other interested elements
                                                                     Working diaries [8]
                                                                        These diaries had to include detailed information about
                                                                     working activities of students. They administrated their
                                                                     working phase and spent time into the team diary.
                                                                     According to these documents we were able to find some
                                                                     interesting statements which had been sent to teams as
                                                                     feedback.
                                                                        One person was working only 3 hours on the second
                                                                     presentation but average working hours of the class
                                                                     exceeded 15. It was acceptable, so we initiated a personal
                                                                     conversation with this student.
                                                                        Another interesting thing was found, where another
                                                                     team had administrated time reports completely equal.
                                                                     This way of administration is not so preferred, because
                                                                     differences always appear between personal working
                                                                     times, bypassing is not a possible way.
                                                                     Using multimedia
                                                                        Including all team presentations, there were only two
                                                                     works which contained multimedia elements. This is a
           Figure 1 - Presentation activities and viewpoints         very low number, because the topics could have been
                                                                     illustrated or represented well by designed animations,
   After the performances of the presentations teams gave            short videos, or audio files. Students didn’t dare to use
a chance to correct their works due to our suggestions, and          these wide ranged tools, so for the future it’s very
repeat the modified presentation in front of a specialist.           important to teach them, how and in what situations they
Most of the teams took our advices and reached better                can apply multimedia based presentation elements [13,
performance in case of the second time. Two teams made               17].
some little corrections on the first work, one changed 80%
of their presentation, but there was one team who made a             Taking notes
content modification in a terrible bad way.                             As we have mentioned before, teams had to write a
   Sometimes students want to put funny elements into                summary about other team’s presentations according to
their work to make it more interesting for their classmates.         their own outlines, written right after the presentations.
It is not a bad idea at all, but using multilateral or               Contents of these summaries weren’t so proper in case of
ambiguous images and other contents like actual politics             three of teams, their submitted documents contained
is highly not recommended. Right after the second                    critical notes rather than key points of the real
attempt, team had got a short but detailed evaluation by             presentations. We would like to increase efficiency of
our professional. We want students to know what were                 taking notes of our students, this ability would be
their relevant mistakes, how they can make corrections,              important for them, especially during academy years [12,
what was the reason behind every single mistake.                     13].
   Finally, students got a grade for their work dependent            Nature of the presentations
on teamwork and personal activity inside the team. As a
                                                                     Although, there were only two different presentations, we
last part of this presentation exercise students had to write
                                                                     gave a chance to our students to make corrections and re-

                                                                17
Journal of Applied Multimedia 2./XII./2017
present their modified presentations in a real – not in
classroom – environment.
III. STATISTICAL EVALUATIONS ON 20016/17 RESULTS
We have done evaluations in different levels as we
represented it in our previous paper in 2016. Now we are
going to follow that logic and separating our analysis into
few parts:
• Summarized results
• Presentation activity based results
• Comparison of team and teacher evaluation
• Self-assessment
• Team performance in the mirror of personal
results
Figure 3. – Result comparison of the presentation activities (2016, 2017)
A. Summarized results According to relevant increase of the previously worst
In this category, all scores are counted equally. The category, spread of individual (personal, team) result
result of the placement test on last year was 57%, but this reduced which can be seen on Figure 2. Let us present
year our students could reach more than 20% better those presentation activity categories on a different
results. This improvement is well presented by the diagram, on ordered spire diagrams (Figure 4).
following figure (Figure 2).
Figure 2 – Personal result (2016) and summarized team result (2017)
On the left diagram, we can see the personal result of
the students from the last year; on the right one, we can
see the team results from this year. Because the result
elements (with blue) are represented in ascending order,
not only the differences of the average can be seen, but
decrease of dispersion as well.
So, differences between the best and the worst element
is much less in this year than 2016. Exactly, spread
parameter of result elements decreased from 38% (2016)
to 7% (2017). We know first subject was a personal,
second was a team work, comparison is not entirely
trivial, but it is a good starting-point.
B. Presentation activity based results
We have already written about our four presentation
activities (expression, content, visualization, text).
Analyzing those categories independently give us a deeper
way of evaluation, supporting to understand details and
impacts of our teaching work. On Figure 3 presentation
activity results in 2016 and 2017 can be seen.
Without any exceptions, the results of all teams were
improved in cases of all activities. The amount of the
improving is probably 10-15% in case of first three
categories. Last year the fourth activity – text – was the
worst, so the 40% result improving is better than we have
expected (see on Figure 3 – red columns).
Figure 4. – Results of the presentation activity categories
18Journal of Applied Multimedia 2./XII./2017
The rate (between years) of rates (inside a year) of
maximal area per colored area of shapes describes
magnitude of improvement. On Figure 4 that effect can be
seen well, even we can abandon the forms of the shapes
and focus on only the areas.
According to Figure 3 the greatest area increase should
be found in case of text. That effect can be seen also on
Figure 4 well, the difference between 2016 and 2017 in
text category is significant.
Analyzing minimum values of all four presentation
activities together not negligible differences can be
measured. The minimum value inside minimums in 2016 Figure 6 – Differences between student and teacher based scoring
was 0%, the maximum value of minimums was 40%. results
Nevertheless, similar parameters of 2017 is 60% and 70%.
According to that significant growing of results, It is a general ascertainment that a good and unified
increasing personal skills and abilities should be class scoring our members higher that a professional
reasonable even if this year we were working with teams. examiner. That effect can be seen well on Figure 6. In
case of every team student rate is higher than teacher’s,
based on that the previous hypothesis seems to be right.
The size of that differences found between 4% and 10%,
compared to the theoretical maximum of score.
The result is not significant but differences exists. That
is very important because without similar scoring and
evaluation principles student can never understand exactly
evaluation results from their teachers. This might be basis
of some kind of misunderstandings, taking offense, feeling
injustice which all should be avoided if teachers have
chance.
D. Self-assessment
When all presentation had done, teams had to estimate
sequence of four teams as a tricky way of self-
assessment. This was a team to team examination, result
can be seen on Figure 7. As we saw on Figure 6 the
sequence of the teams was right in case of student scoring
too. So, scoring mechanism can be used by students, but
sequence estimation is another story.
Figure 5 – Increase detection on presentation activities between 2016
and 2017
We wanted to show the relative differences between the
examined years (see on Figure 5), so defined the average
value of each activity category as a zero points of our
coordinate system. Then we got previous diagrams of
results in 2017 and modified the starting point into the
aforementioned average value. Due to that manipulation,
colored shapes on Figure 4 represented the size of
improvement from 2016 to 2017. Figure 7 – Self-assessment of the teams
C. Comparison of team and teacher evaluation On Figure 7 colors represented given team estimations,
This year as a new evaluation way, students had to grouped columns represented given values in each team.
examine other team’s presentations. On Figure 6, The average estimations were not so far from our scoring
differences between student and teacher scoring results result, namely the right sequence is #3, #2, #1 and #4 as
can be seen. In this examination, we are not going to can be seen on Figure 7 as well. But if we are focusing
describe deeply the results, we are going to present only on just estimation values from own team, interesting
on summarized level.
assumptions can be noticed. We have summarized self-
assessment estimations in the following:
• #1 à 2. (3.)
• #2 à 2. (2.)
• #3 à 1. (1.)
• #4 à 2. (4.)
19Journal of Applied Multimedia 2./XII./2017
Inside brackets we can see the real places of teams, performance and attitude of students on subject and
which not to be equal exactly with estimated values. In lecture independently way [18].
case of #1 and #4 team estimated self-value was bigger,
IV. SUMMARY, FURTHER OBJECTIVES
than the right result.
This examination highlighted for us, a simple guess In this paper we have represented a practical phase of a
about sequence is not so exact and accurate than a realization of our 4-year teaching methodology in the area
designed scoring guide which might be more useable. of presentation activity. We wrote about the second year
learning program. We kept important describing
E. Team performance in the mirror of personal results pedagogical and also technical methods which have been
Interesting and informative to compare personal results used for the previous 9 months.
of students in 2016 to team results in 2017. Since the We pointed possibilities of statistical tools as well as
placement test students have created one double and two visualization in the area of data evaluation and analysis.
team presentations with several corrections and mistake Our main goal this year only was finding useable
management. Through these exercises and because of our statistical techniques through which we will be able to
lectures and feedbacks, they learnt a lot. We were excited describe improvements between first and fourth year
about whether there is any measurable differences or not. results in a proper level.
Result of this investigation is presented on Figure 8. During the following year which will be the third, we
would like to improve flexibility and adaptability of our
students against different presentation environment and
different composition of audience. We want students to
capable of presenting for professionals, elderly people,
and kindergarteners too. Practicing will also be important
when the main goal of a presentation is not so simple, we
call it situation presenting. According to audience and
presentation environment the presenter’s goal might be
informing, teaching, proving and any lineal combination
of them.
Although technical level of our teams was quite good,
some problematic elements remained. Using multimedia
element was not so preferred by students, but possibilities
of it is illimitable. They should know identify proper
Figure 8 – Comparison of individual and team results presenting situations when multimedia elements would or
wouldn’t be used.
Information about team results this year was presented
So far topics of exercise presentations was not so
by green line. Individual results from past year were
personal, but we know presenting an own work is so much
represented by red circles grouped by teams of this year.
better, easier and motivating than a common one. Thus
Finally, with blue line we represented average value of
next year we will organize a GPS measurement day on
individual results of students within teams. field near Keszthely. They will have to create a report
We wanted to see positive differences between document and after that hold a presentation about their
averages which can be detected according to our complex work. We hope that more personal work will be a better
diagram. Moreover minimum value of team results is topic for presenting, and expression and motivation will
better than maximum of personal results within teams. be better due to this situation.
The main influencing parameter of increased averages Two years later when our program will be done, we
might be the best individual result of each team. That would like to write one or more detailed articles
would be logic, but it is not so true, because other supporting other teachers and presenting our final results.
parameters should be important supporting development Due to the results of a 4 years, we want to repeat or
of students. In the following we try to collect those continue teaching other students in this way.
attributes, which could be helpful for students creating
better presentations than the beginning: REFERENCES
• Detailed feedback [1] Berkéné V. B., Berke D., Prezentációs tevékenység fejlesztése és
mérése gimnazista diákok körében, XXII. "Multimédia az
• Education materials Oktatásban" (Multimedia in Education): internatioan conference,
• Lectures Keszthely, 2016. pp. 95-100.
(ISBN:978-615-80204-3-5)
• Method of team compilation
[2] Kolb test: URL: http://moodle.appi.bme.hu/pluginfile.php/
• Personal abilities 50517/mod_resource/content/3/kolb_LSI.pdf
• Possibility of corrections [3] KOVÁCS K, BAKONYI P., Future Internet and Smart Cities, avagy a
jövő internete és az okos városok, Híradástechnika, ISSN: 0018-
• Real presentation situations 2028, LXXI. No.1., pp. 15-21. (2016)
• Self-assessment [4] NEMZETI HÍRKÖZLÉSI ÉS INFORMATIKAI TANÁCS, Égen-Földön
informatika, Typotex, Budapest, 2008, ISBN 978-963-279-024-4
• Teamwork, team spirit
[5] BERKE D., Applications of satellite based location services in long-
As we can see there are many tools and methods which distance running competitions, Conference presentation,
could motivate students. We believe that way of teaching: Multimedia in Education XXII., Keszthely, Hungary (2016)
finding techniques, create own methodologies to increase [6] BERKE D., KOVÁCS K., Térinformatika a tömegsportban
(Hungarian), Multimedia in Education XXI., Conference
20Journal of Applied Multimedia 2./XII./2017
proceedings, University of Újvidék, Faculty of Hungarian Teacher [12] Magyar M., Az ICT – a multimédia alkalmazásának módszertani
Training, Subotica, Serbia, pp. 188-193., ISBN 978-86-87095-54- kérdései, Journal of Applied Multimedia 1./VII./2012, pp. 15-28.
0, (2015) URL: http://magister.uns.ac.rs/upload/ict/ICT2015.pdf [13] Mohai I., Tipográfiai alapismeretek – Kiadványszerkesztés,
[7] BERKE D., A given optimization task modelling of fixed route tantárgyi segédlet, Pannon Egyetem Kihelyezett Képzési Hely,
moving units with smart and GIS tools, M.Sc. theses, Budapest Székesfehérvár, 2006, URL: http://www.grafikanagy.hu/koskaroly
University of Technology and Economics, (2016) URL: /11b/A%20tipogr%C3%A1fia%20alapjai.pdf
https://diplomaterv.vik.bme.hu/en/Theses/Utvonalhoz-kotott- [14] Prezentációs ismeretek portál, módszerek, eszközök, környezet,
rajban-halado-egysegek időtartam, URL: http://www.prezentacios-ismeretek.hu/index.php/
[8] Berke J., Kelemen D., Kozma-Bognár V., Magyar M., Nagy T., kornyezet.html
Szabó J., Temesi T., Digitális képfeldolgozás és alkalmazásai, [15] Magyar M., A Power Point jelenség, avagy a „csirkék
Kvark, Keszthely, 2010, ISBN 978-963-06-7825-4. hipnotizálása”, Journal of Applied Multimedia 1./VI./2011, pp.
[9] Bóta B. A kiadványszerkesztés alapjai, prezentációs videó, 2011, 26-35.
URL: https://prezi.com/sdnsrzsuacst/a-kiadvanyszerkesztes- [16] Seebauer I., Seebauer G., Bolyai János tanító - tanuló
alapjai/ rendszerszemléletére épült módszertan alkalmazása a 21.
[10] Carmine G., Steve Jobs a prezentáció mestere, HVG Kiadó Zrt., Században, Journal of Applied Multimedia 2./X./2015, pp. 26-31.
2010., ISBN978-963-304-023-2. [17] Tuli K., Copy Service, BSc thesis, 2013., Kaposvári Egyetem
[11] Előadás, felkészülés, hibalehetőségek, Felkészülés a prezentációra (University of Kapaosvar).
– Mitől lesz sikeres a prezentációnk, Pécsi Tudomány Egyetem, [18] KETSKEMÉTY L., IZSÓ L., KÖNYVES T. E.: Bevezetés az IBM SPSS
URL: http://igyk.pte.hu/files/tiny_mce/File/kari_projektek/tehetse Statistics programrendszerbe (Hungarian), Alinea, Budapest,
gmuhely/prezentaciok/a_sikeres_prezentacio_szej.pdf ISBN 978-963-08-1100-2 (2011)
21You can also read


