New Features in MAXQDA 2018 - Released December 2017
←
→
Page content transcription
If your browser does not render page correctly, please read the page content below

New Features
in MAXQDA 2018

                 Released
              December 2017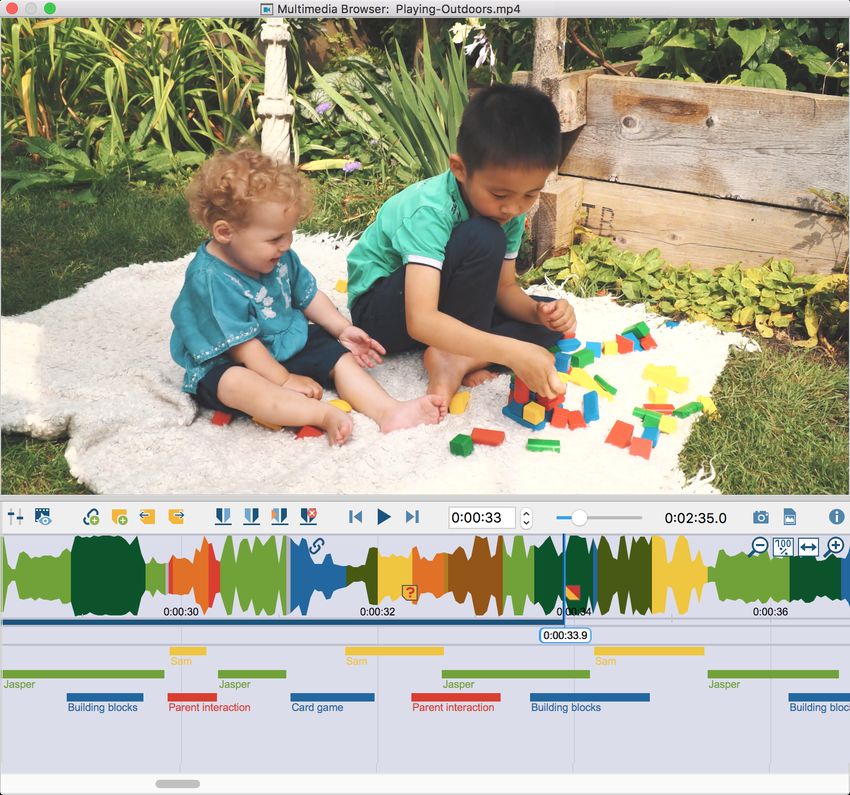
The QDA Software of the Future
Dear MAXQDA users,
After over two years of intensive development, it’s finally here: We are delighted to
introduce you to the latest version of our software, MAXQDA 2018.
And there are plenty of reasons to be excited: We have added over 60 new features,
including seven newly developed analysis tools offering innovative ways to evaluate your
data. We have also significantly improved many of our core features. Getting started with
MAXQDA has never been easier, with simplified access to both new and well-known
existing functions.
I would like to take this opportunity to extend my thanks not only to the VERBI team but
also to you, the MAXQDA community, for your ongoing feedback and insightful
comments – and, of course, for all our interesting discussions at conferences and
workshops throughout the year. We are confident MAXQDA 2018 will once again
provide valuable support for your work and lead to rewarding results.

                    Research is a journey – travel it well!

With best wishes,

Anne Kuckartz
CEO

                                                                                            1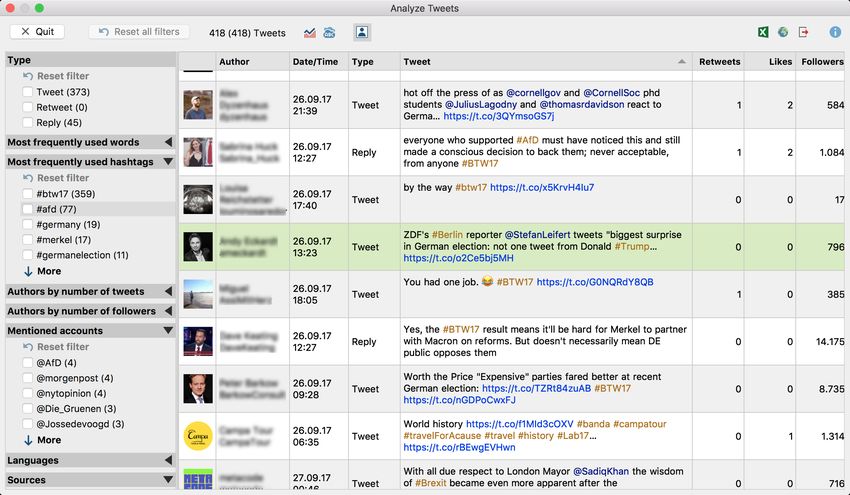
Contents

NEW INTERFACE                        3

NEW FEATURES: SEVEN HIGHLIGHTS       4

Paraphrasing                         4

Smart Coding Tool                    5

Code coverage                        6

Code configurations                  7

Twitter statistics                   8

Comparing groups                     9

Categorizing survey data             9

IMPROVEMENTS TO EXISTING FUNCTIONS   11

MAXMaps                              11

Transcription                        12

Video analysis                       13

Global undo                          14

SWITCHING TO MAXQDA 2018             19

                                          2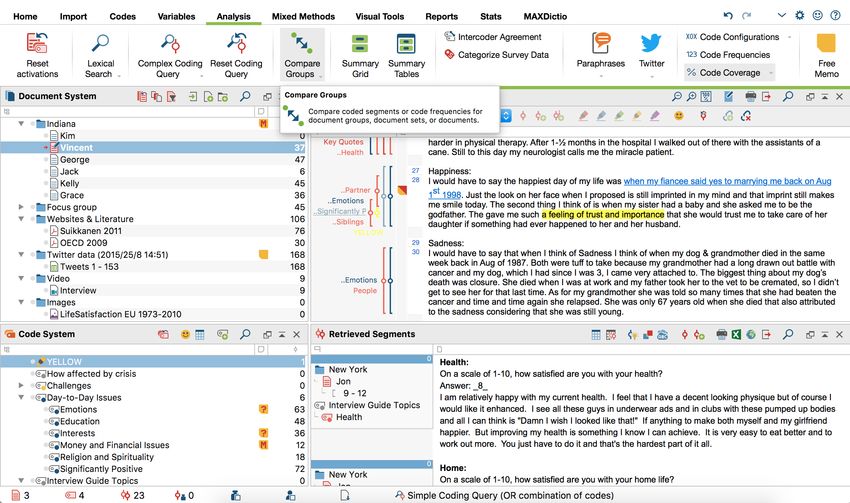
The New Interface
At a glance: the ribbon menu and tooltips
MAXQDA’s powerful functionality has a new look! But don’t worry, we’ve kept the classic
four window design. Instead, we’ve replaced the old toolbars with a ribbon menu and
integrated several functions into the windows themselves – right where you need them.
Meanwhile, we’ve also restructured the entire menu system to make it even more
intuitive and easier to navigate. And if you’d like to see more of your data – instead of
our beautiful new icons – you can simply hide the new menu with one click.
To make MAXQDA even easier to use, all the options in the ribbon menu’s tabs are not
only labelled but come equipped with tooltips that offer quick insights into each function.

                                                                                              3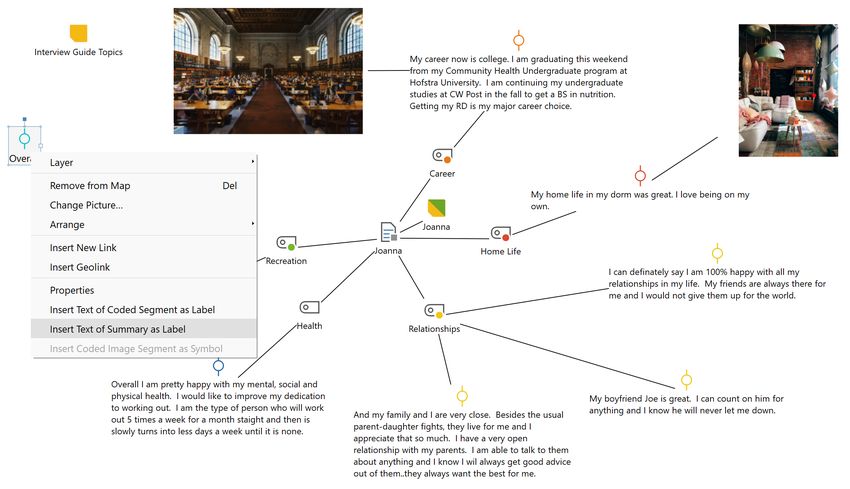
New Features: The Highlights
Paraphrasing
Summarize material in your own words - next to the original
Summarize sections of your data in your own words with MAXQDA’s handy Paraphrase
mode. Paraphrases you have already written can then be displayed directly adjacent to
the text, so you can always keep them in view.
The new Categorize Paraphrases function can help you create new code systems. This
practical tool is ideal for inductively forming new categories for your material and is suited
to numerous methodological approaches.

Example: When you activate MAXQDA’s Paraphrase mode, selecting a text passage
opens a new paraphase window. Already exisiting paraphrases are displayed
immediately next to the text.

                                                                                                 4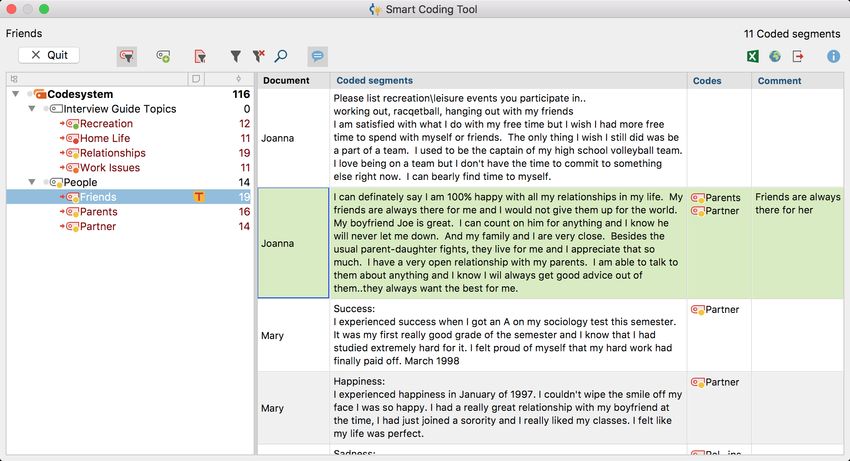
Smart Coding Tool
Manage coded segments quickly and easily
The categorization of data segments is a key function of any QDA software and thanks
to its user-friendly four window interface and creative coding function, MAXQDA is
already global pioneer in this area. Our new Smart Coding Tool takes this strength one
step further.
This tool makes allocating individual data segments to codes that much easier, faster and
- above all - clearer. Particularly in advanced coding stages, the Smart Coding Tool helps
you check allocations, make corrections, and keep track of the overall picture.

 Example: The Smart Coding Tool lists all the segments that have been coded with the
 code "Friends". The table also displays in which document the segment appears, which
 further codes have been assigned to it, and any comments written about it. From here
 you can add new codes to your code system or assign further codes to the displayed
 segments.

                                                                                             5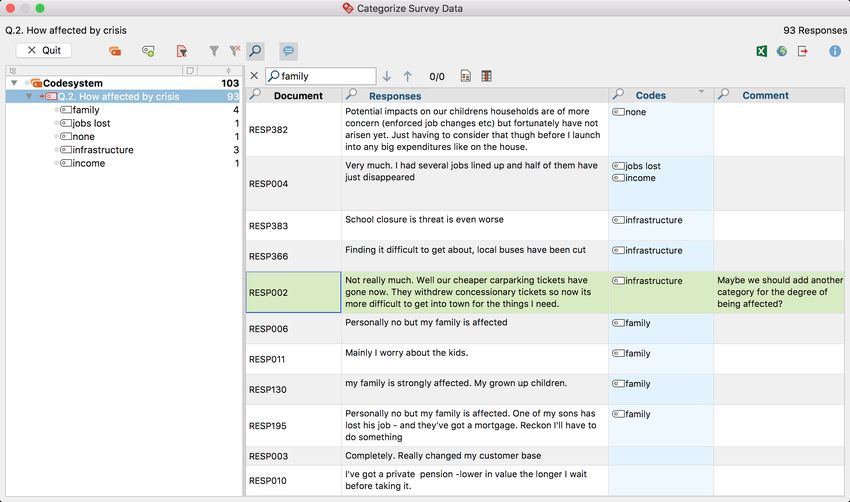
Code coverage
A milestone for many analysis methods …
The analysis of code frequencies is one of MAXQDA’s oldest standard tools and
represents a fundamental component of countless methodoligcal approaches. With
MAXQDA 2018, we have complemented this analysis approach with two new and
universally useful functions.
The Code Coverage tool compares the extent to which coded segments cover different
texts, images and videos. You can analyze the percentage to which a document – or only
the coded parts of a document – are assigned to specific codes.

With its inbuilt statistics functions for generating and customizing tables and charts, you
can process this information with MAXQDA and export it in several formats.

Example: The top line of the code
coverave table below displays
how much of the coded text in
the interviews with Jon, Mary,
and Vincent are covered by the
"Health" code. The statistics
function creates a chart of the
percentages for specific docu–
ments (here the interview with
Vincent) or document groups.

                                                                                              6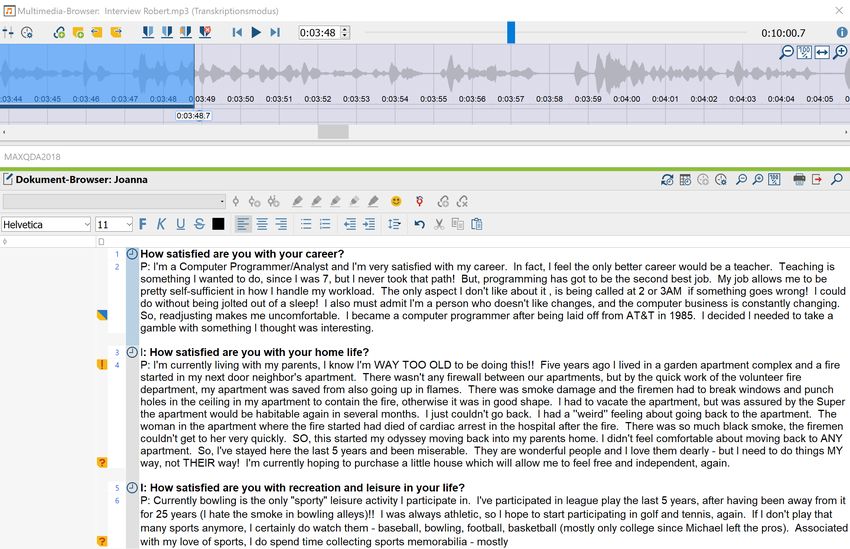
Code configurations
… and “complex” code configurations at a glance.
This is a particularly useful tool for almost all forms qualitative and mixed methods
analysis. The Code Configurations function enables you to quickly and easily display
which codes occur in combination and how frequently they do so – and you can visualize
all these results as charts too.
With the Complex Code Configurations extension, you can examine up to six dimensions
at once! And as these results tables are interactive, you can click on a code combination
to display all the data segments to which it applies in the Retrieved Segments window.

Example: You can combine up to six parent codes in the complex code configuration. This
example shows a code configurations table listing various overlaps between the subcodes
of “teacher”, “child” and “game”. The most overlaps exist for Ms. Berkempers playing
hide & seek with Joshua.

                                                                                            7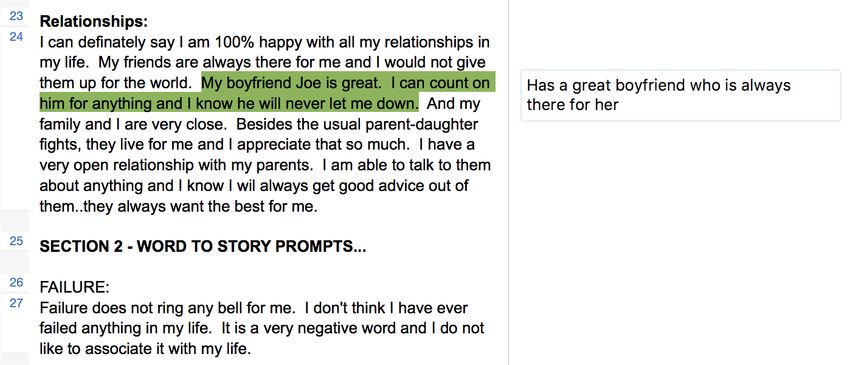
Twitter statistics
New twitter analysis functions
Great news for everyone working with Twitter: With MAXQDA 2018, we’ve massively
expanded the program’s Twitter functionality!
The new Twitter analysis tool includes multiple filters that let you conduct a
comprehensive statistical evaluation of collected tweets. Automatic charts offer
information about a tweet’s reach, the number of "Likes", and the date and time of their
publication.
In addition to all the features available in the last version, you can now also include the
tweet type (tweets, retweets and replies), the profile picture of its author, the language,
device type, geolocation and all replies to a tweet in your analysis.

Example: On the left side of the Twitter Analysis window you can filter your data to search
for and analyze specific types of tweets, e.g. only tweets that include the most frequently
used hashtags. With one click you can open the charts window which lets you edit and save
diagrams to use in reports or presentations.

                                                                                              8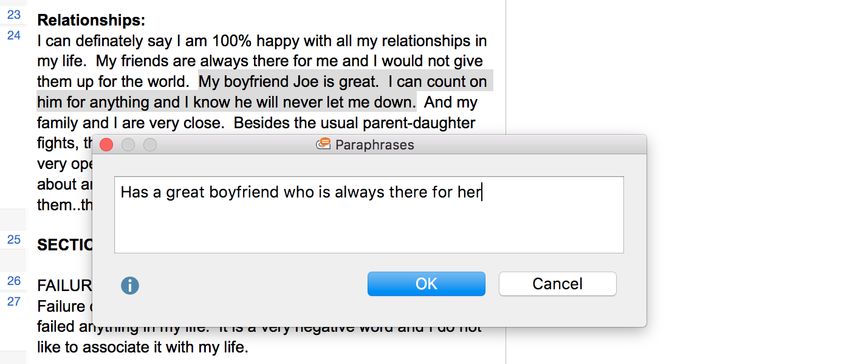
Comparing Groups Made Easy
Compare coded segments from several data sources
The group comparison feature offers researchers a simple and intuitive way to compare
coded content or code frequencies across different groups. In the case of the qualitative
approach, coded segments from selected codes for specific groups can be displayed side-
by-side in an interactive table. As for the quantitative approach, the code frequencies for
the individual groups are displayed in a crosstab, which you can then convert into a
percentage representation for easier comparison and interpretation.
A new group comparison is created with a simple drag & drop of both data sources and
topics (codes). MAXQDA allows you to use this feature not just for groups, but also for
individual cases – or combined comparisons of groups and individual cases.

Example: The qualitative group comparison above displays comments coded with the topic
“Health” in two columns. The table displays statements from interviews that were conducted
in the state of New York on the left, and statements from interviews in Indiana on the right.
In this example the source information and any added memos are displayed underneath each
segment. The table is interactive, which means you can click on any of the codes on the left
to view their corresponding coded segments. You can also click on the source information
below the comments to jump directly to the original source document.

                                                                                              9
Categorizing survey data
Quick analyses of responses to open survey questions
MAXQDA 12 already allows you to import surveys from Excel so that closed questions
are imported as variables and open questions as automatically coded texts. MAXQDA
2018 also expands on the advanced processing of partially standardized and open surveys
- in the form of the new Categorize and Evaluate Survey Responses function.
Similar to the Smart Coding Tool, this feature allows you to assign relevant codes to
responses to open questions quickly and easily. You can display which responses have
already been coded with a particular category and add comments to identify unclear code
assignments. You can also code quickly and easily using drag & drop.
Example: Answers to a question regarding how respondents were affected by the
financial crisis are seen here in an interactive table and have been assigned a new code
or one of the already created subcodes. You can search and filter the table to find similar
responses and/or add comments.
10Improvements to Existing Functions
The new MAXMaps
A complete mapping makeover
A new look interface, four new and unique MAXMaps models, new options for directly
importing coded image segments, memo texts and summaries, new free objects, the
ability to save maps as PDFs and DOCs, and so many small improvements that we would
have to write up an entire newsletter just to list them all. Curious? Why not explore the
new MAXMaps and find out for yourself!
11Transcribing with MAXQDA 2018
It doesn’t get much faster than this
Transcribing is a time-consuming affair. MAXQDA 2018 makes the job easier with a
focused transcription view and automatic label changes for speakers whenever you start
a new paragraph. You can also define your own shorthand symbols for words and
phrases, e.g. where "1” changes to "Person 1" or "x" to "(incomprehensible)". It’s fun
and it saves a lot of time!
Already started transcribing with another software? MAXQDA 2018 lets you import
transcriptions including their timestamps in the exported format of all the following
transcription programs: easytranscript, f4 / f5, HyperTRANSCRIBE, Inqscribe, Transcriva,
Transana, Transcribe, Transcriber Pro.
12Video analysis
Filter, fix and link
Video analysis has become even easier with MAXQDA 2018 thanks to several
improvements. From now on the display of coding stripes in the multimedia browser can
be filtered according to activated codes, users and colors. So if you’re working with a
large number of coded segments, you can concentrate on the essentials.
Coding stripes of selected codes can now be fixed at the top of the multimedia browser.
If you have assigned a specific code to the contributions of a particular person or a
particular filming location to better break down the video material, this code will be
displayed at the top to help you navigate through the footage.
And you can now easily link any video segment to another segment or document with
the document links tool.
Example: The codes with each child’s name have been fixed to the top of the window to
easily jump from one of their actions to the next. Memos and links are displayed as icons
in the waveform display and can be opened with a click.
13Global undo
Take it all back!
Undo functions were already available in earlier versions of MAXQDA - but they were
limited to specific processes (such as coding, editing documents and making changes in
MAXMaps).
MAXQDA 2018 takes this several steps further, because with the new global undo
function you can undo anything MAXQDA. So now you can retrieve that accidentally
deleted code with one click.
14Save anonymized projects
If your project contains sensitive data, MAXQDA 2018 lets you automatically save an
anonymized copy of the project. A prerequisite: The sensitive text areas must first be
appropriately coded. When you save an anonymized copy, all the text locations coded
with selected codes will be replaced by XXX and/or the code name, rendering them
anonymous.
Interactive Quote Matrix
The Interactive Quote Matrix function allows you to display coded texts or image
segments from specific source documents. These documents are selected and compared
according to conditions for document variables which you can freely define. This allows
you to quickly and easily compare the views of different groups on a selection of topics.
You can also view all your memos and/or comments connected to the displayed segments
as a further option. And as the function is interactive, you can jump from the segment to
the original with a single click to view the material in its original context.
Reports for summaries with coded segments
With MAXQDA 2018, you can now create reports in Word, which displays your
summaries together with their corresponding coded segments in a table overview. For
each selected code, the generated report displays the coded segments in selected
documents in a separate column and supplements these with summaries in another
column.
Codes and coding
• Create multiple codes directly in the "New code" dialog window without closing
the window
• Display columns with variable values in the "Overview of Retrieved Segments"
• Previously assigned shortcuts are visible in the property menu of a code
• You can hide the display of a segment’s weight in your “Retrieved Segments”
• Frequencies in the “Code System” can either show the total number of times a
code has been assigned, or display in how many different documents a code was
assigned
• Assign or change code colors more quickly with predefined colors
• Include codes that don’t have a code memo in the codebook export
• Frequency tables and charts display more information about the number of
documents and segments in which selected codes occur.
• Statistics for subcodes: informative labels for easy interpretation
• The Complex Coding Query now allows you to drag and drop codes directly
from your “Code System”
15• You can display comments on coded segments right next to the document in a
separate comment column
• Intercoder Agreement: Analyze coded segments in a document against a
reference document
Documents
• Add selections from texts, PDFs or image documents as a new document to the
"Document System"
• Simpler and faster creation of new text documents
• New text format option: “Struck-through”
Lexical Search
• Easier entry of multiple search terms using the return key
• Your last search terms are saved with the project file
• Save and load advanced search settings
• A "beginning of words" option for contextual searches in the "Document
Browser" and the "Retrieved Segments" window
• The default lemmatisation corresponds to your MAXQDA interface language
Memos
• Sort the “Overview of Memos” by date and time of your last memo edit
Summaries
• Add summary tables as table documents to your "Document System"
• Show and hide comments, memos, and source documents
Visualizations
• Create a Word Cloud of the most frequently occurring words from the content
of the"Retrieved Segments” window
• The Code Relations Browser (overlapping codes) can be limited to the segments
in your "Retrieved Segments" window and can be opened from directly here
• The Code Relations Browser lets you select filter codes so that only the coded
segments that occur within this code are evaluated
• Code Matrix Browser (codes per document) and Code Relations Browser: the
size of the square symbols factors in the difference between the smallest and
greatest values
16• Code Matrix Browser and Code Relations Browser: both allow you to change the
code system display between a hierarchical or list structure; unactivated parent
codes are ignored in the case of a list display
• Code Matrix Browser and Code Relations Browser: Improved calculation for size
of visualizations (squares/circles) for more intuitive interpretation
• Document Comparison Chart: compare texts, PDF documents and media files of
any length by standardizing the length to 100 units
• Document Portrait: four new sizes for the overall portrait picture picture and you
can choose either a square or rectangular shape
Mixed Methods
• When activating documents according to variables, several new comparative
operators can be used, including "variable value is less than or equal", "Greater
or equal" and "contains". These additions are also useful for other processes,
such as creating a quote matrix or crosstab
• Create a quote matrix for your coded segments and comments or only
comments
• Quote matrix shows information about the number of documents in each
column heading
• Quantitizing: Transform all activated codes into document variables at once
• Crosstab: Display codes with a “collapsible” hierarchy so that subcodes can be
aggregated
Teamwork
• Limit Teamwork exports to include only content in activated documents and/or
codes
• Save activated (as well as coded) documents as a separate project
Overview tables
• Filter and sort table columns in multiple levels and reset sorting for all columns of
a table
• Simplified filter customization
Logbuch
• Search within your logbook
Export
• Project components can be exported collectively as Excel files
17• The export function for coded segments as text and tables has been greatly
expanded with respect to the exportable information (11 new options)
• RTF exports include footers and headers
MAXDictio
• You can store the number of words in a document as a document variable
Stats
• The contents of the output viewer remain stored even after you close Stats
• Document sets created in Stats can also be viewed and deleted without closing
Stats
Miscellaneous
• Quick contact to the MAXQDA team via built-in feedback field
• New start screen with up-to-date news
• Progress indicators have been improved
• Improved context menus providing better overviews
18Switching to MAXQDA 2018
Free Upgrades
Customers who purchased MAXQDA 12 within 6 months prior to the release of
MAXQDA 2018 (June 1st, 2017 or later) can request a free upgrade to MAXQDA 2018
from our website.
Link: http://www.maxqda.com/shop/upgrade-maxqda
50% Upgrades
Customers who purchased MAXQDA 12 more than 6 months before the release of
MAXQDA 2018 can purchase a regular upgrade with a 50% discount as per the original
price on our website (this does not apply to student licenses).
Link: http://www.maxqda.com/shop/upgrade-maxqda
Upgrade your MAXQDA 12 Subscription License
Customers who own a subscription license for MAXQDA 12 will automatically receive all
information about the free upgrade of their license(s) to MAXQDA 2018 shortly after the
release.
For questions about your subscription license, please contact us at: cs@maxqda.de
Try MAXQDA 2018 for 14 days
You can try MAXQDA 2018 with our for 14-day trial version without obligation. The trial
version gives you access to all the features of MAXQDA Analytics Pro.
Link: http://www.maxqda.com/demo
Continue Working with MAXQDA 12 Projects
You can still open and edit your existing MAXQDA projects with MAXQDA 2018! Simply
select the file type "MAXQDA 12-Project” in the Open Project window.
19You can also read