Business Plan 2018-2022 - Fincantieri
←
→
Page content transcription
If your browser does not render page correctly, please read the page content below
Business Plan 2018-2022
Safe Harbor Statement

This Presentation contains certain forward-looking statements. Forward-looking statements concern future circumstances and results and
other statements that are not historical facts, sometimes identified by the words "believes," "expects," "predicts," "intends," "projects,"
"plans," "estimates," "aims," "foresees," "anticipates," "targets," and similar expressions. The forward-looking statements contained in this
Presentation, including assumptions, opinions and views of the Company or cited from third party sources, are solely opinions and
forecasts reflecting current views with respect to future events and plans, estimates, projections and expectations which are uncertain and
subject to risks. Market data used in this Presentation not attributed to a specific source are estimates of the Company and have not been
independently verified. These statements are based on certain assumptions that, although reasonable at this time, may prove to be
erroneous. By their nature, forward-looking statements involve a number of risks, uncertainties and assumptions that could cause actual
results or events to differ materially from those expressed or implied by the forward-looking statements. If certain risks and uncertainties
materialize, or if certain underlying assumptions prove incorrect, Fincantieri may not be able to achieve its financial targets and strategic
objectives. A multitude of factors which are in some cases beyond the Company’s control can cause actual events to differ significantly
from any anticipated development. Forward-looking statements contained in this Presentation regarding past trends or activities should
not be taken as a representation that such trends or activities will continue in the future. No one undertakes any obligation to update or
revise any forward-looking statements, whether as a result of new information, future events or otherwise. Market data used in this
Presentation not attributed to a specific source are estimates of the Company and have not been independently verified. Forward-looking
statements speak only as of the date of this Presentation and are subject to change without notice. No representations or warranties,
express or implied, are given as to the achievement or reasonableness of, and no reliance should be placed on, any forward-looking
statements, including (but not limited to) any projections, estimates, forecasts or targets contained herein.
Fincantieri does not undertake to provide any additional information or to remedy any omissions in or from this Presentation. Fincantieri
does not intend, and does not assume any obligation, to update industry information or forward-looking statements set forth in this
Presentation. This presentation does not constitute a recommendation regarding the securities of the Company.

Declaration of the Manager responsible for preparing financial reports
Pursuant to art. 154-BIS, par. 2, of the Unified Financial Act of February 24, 1998, the executive in charge of preparing the corporate
accounting documents at Fincantieri, Carlo Gainelli, declares that the accounting information contained herein correspond to document
results, books and accounting records.

                                                                                                                                            2
Table of Contents
Section 1   Market overview and strategic developments

Section 2   Short and medium term financial targets
The story so far…

              What we said…                           …what we did…                            ….what we will achieve

Cruise                                                                                         • Only 3 prototype ships to be delivered
                                                      • Delivered 5 prototypes on time in
                                                                                                 in 2018-2022
              • Backlog de-risking                      2016 - 2017
                                                                                               • Continuing operational integration of
              • Synergies with Vard: integration of   • Tonnage delivered to Italian yards
                                                                                                 Romanian shipyards with Italian yards
                Tulcea shipyards                        from Tulcea doubled from 2016 to
                                                                                                 and further coordination in procurement
                                                        2017
                                                                                                 strategy

Naval                                                                                          • Leveraging established known how and
                                                      • Acquired Qatari Navy contract            reputation through development of well
              • Entry into new markets in Naval
                                                      • Bid for highly strategic and visible     proven products and new concepts
                segment
                                                        programs                               • Identified opportunities: Australia, US
                                                                                                 FFG(X)

Offshore
                                                                                               • Consolidating acquired know-how to
                                                      • Over 90% of orders acquired in 2017      exploit opportunities in Offshore
              • Diversification of VARD
                                                        not related to core Offshore           • Expansion into luxury cruise and
                                                                                                 military segments

Equipment,                                                                                     • Developing Equipment, Systems and
                                                      • Consolidated Cabins and Integrated       Services business to fully transform
Systems and   • Insourcing of high value added
Services                                                Systems businesses                       Fincantieri into a “one stop shop” for its
                activities
                                                      • Newly acquired Naval contracts           clients
              • Expansion of after sales services                                              • From Cabins to complete
                                                        include sizable after sales services
                                                                                                 Accommodation

                                                                                                                                        4
...and continuing successfully on a profitable growth path

    Strong top line                                                                     Greater efficiency
    expansion and                                                                      and positive market
  consolidation as a                                                                   momentum to drive
  global champion in                                                                       a structural
   the shipbuilding                                                                        increase in
       industry                                                                            profitability

                                                   Targets

                                 Key pillars of the 2018-2022 Business Plan
              Long term                                      Innovation            Streamlined
               visibility        New horizons and                                  production
                                                         Proven capability to
          Backlog supported            markets             develop cutting      Continued focus on
              by positive        Expansion into new       edge designs and      seamless execution
              underlying         geographical areas         technological             through
              momentum,          and development of       solutions to meet       streamlining of
           particularly in the   after-sales services      clients’ evolving      processes and
            cruise segment                                      needs               production

                                                                                                             5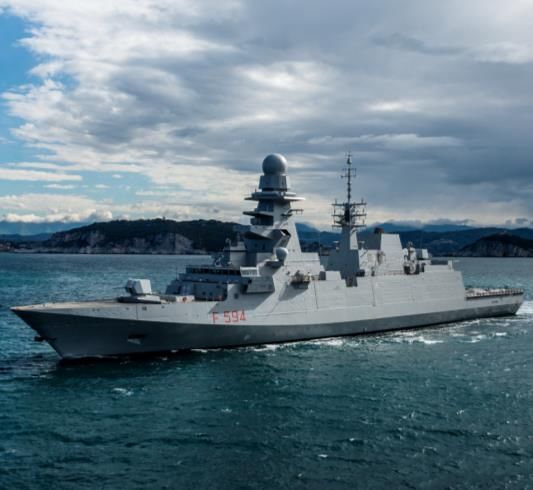
Section 1

Market overview and strategic
developments

                                            LCS 7
                                            LCS 7
                                          US
                                          US Navy
                                      FREMM
                                      FREMM  Navy
                                    MSC Seaside
                                Iitalian
                                Iitalian Navy
                                         Navy
                                      MSC Cruises
Shipbuilding - Cruise: growing market

Dynamics of cruise ships market                  Dynamics of global tourism and cruise passengers

Historical trends (2013-2017)
                                                 MM people                                                                                                                                       CAGR(1)

                                                            Total tourists
                                                                                                                                                                                              ’08-’17 ’17-’22
• Starting from 2014, significant recovery
                                                            Cruise tourists                                                                                                                     +4.0%      +2.4%
     in demand, with record orders in the last
                                                                                                                                                                                      1,800
     two years (49 units) and consequent
     increase of workload and shipyards
     production visibility
                                                                                                                                                                            1.489
     − Demand recovery in “traditional
                                                                                                                                                                  1,322
          markets”                                                                                           Global financial
                                                                                                                 crisis
     − Entering new markets with great
          potential (e.g. China and Australia)                                                                         929

     − New players / new brands (e.g. Virgin
          Cruises, Costa Asia)                                                       678
                                                  530
Forecast (2018-2022)
                                                                                                                                                                                                +6.1%      +5.5%
• Production capacity already filled
     through 2022 with ships currently in
     backlog or close to finalization                                                 9.9 10.8 11.6 12.5 13.4 14.3 15.1 15.1 17.9 18.7 20.1 20.3 21.3 22.1 23.2 24.7 25.8      33.8      49.0
                                                  5.6 6.1    6.7   7.4   8.0   9.7

• Steady growth in demand for lower               '95 '96 '97 '98 '99 '00 '01 '02 '03 '04 '05 '06 '07 '08 '09 '10 '11 '12 '13 '14 '15 '16 '17                                  '22       '30
                                                                                                                                                                                                  % pax
                                                                                                                                                                                                  cruise
     berths, going beyond 2022, thanks to        1.1%                                1.5%                             1.6%                                        2.0%      2.3%      2.7%
     growing number of cruise passengers

                                                             Source: Total Tourists: World Tourism Organization, UNWTO – Tourism Highlights, 2017 Total cruise Tourist: Fincantieri estimates

(1) Compounded annual growth rate

                                                                                                                                                                                                             7
Shipbuilding - Cruise: strategy and action plan

Description

Revenue growth      • Deployment of vast backlog
                      − over 90% of cruise revenues spanning the Plan’s horizon covered by existing contracts and/or MOAs
                    • Acquisition of new clients and expansion into new geographical areas

Positive market     • Confirmed positive trend in lower berth pricing
momentum              − Substantial uptick in the latter part of the plan period
                    • Demand for ships over 140,000 GRT spurs increase of project size and contract values
                    • Expansion in niche market spaces (luxury-exploration and ice class cruise ships)

Favorable backlog   • Leverage on the commercial efforts of previous years and on a proven track record of consistent execution and
composition           timely delivery
                    • New prototypes lay the base for future order acquisitions (on average a prototype generates 4 sister ships)

Production/         • De-risking prototype construction by relying on consolidated know-how in both engineering and project management
engineering         • Further focus on production efficiencies
                    • Continuing implementation of:
                      − Operational integration of Tulcea shipyard with the Italian yards in order to build complex sections of cruise ships
                      − Coordinated procurement strategy to exploit low cost production platform advantages

                    • Capital investments in Italy and Romania to further optimize construction yards and project development capabilities
Capex and           • Hiring of additional, highly specialized workforce to better execute backlog deployment
Human Resources

                                                                                                                                           8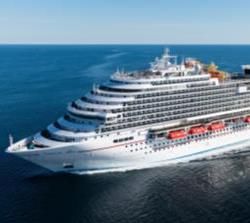
Shipbuilding - Naval: market opportunities
Description Programs value and expenditure
Fincantieri’s accessible markets(1)
Value of programs 2018 -2022 Expenditure 2018-2022
• The value of high-likelihood programs(2), with expected allocation
date in the 2018-2022 period, amounts to approx. €52 billion # of
€ 51.8 bln € 9.2 bln
Programs
• In the 2018-2022 period these programs should generate a (36) 15.0
4.9
commitment to expenditures approaching € 9.2 billion
(9) 30.8 1.6
• 9 countries make for 74% of the orders: USA, Australia, Brazil,
(37) 2.6
Saudi Arabia, Singapore, Poland, Thailand, Egypt, Philippines. 6.1
Progams value (€ Mld) Expenditure 2018-2022 (€ Bln)
• The main programs expected to be assigned in 2018-2022 Big surface combatant Mid or small surface combatant Auxiliary vessels
include: vessels(3) vessels(4)
− Australia: SEA 5000 Future Frigates
Programs value, expenditure and number of units
− USA: LCS and FFG (X) Future Frigates
− Canada(6): Frigates
Value of programs %(5) Expenditure 2018-2022 %
− Brazil: FSGHM CV03 (Tamandaré), OPV NPa 500-BR India
Other Other 12%
− Saudi Arabia: Multi-Mission Surface combatant frigates USA
26% 21% 32% Poland
− Singapore: Corvette, LPD 10%
− Poland: Corvette, AOR Supply
Philippines Romania
− Romania(6): Corvette 3% Philippines 7%
Egypt 4%
− Thailand: Frigates, OPV Brazil
4%
− Egypt: Frigates Australia Nowegian 6%
Thailand 21% 4% USA
4% 6%
− Philippines: Frigates, OPV
Brazil Vietnam Saudi
Poland Singapore Saudi Finland
Arabia 6% 4% Arabia Singapore
4% 5% 4% 6%
6% 5%
Source: IHS Jane’s – January 2018, Fincantieri analysis
(1) Excluding submarines, minehunters and programs of self-sufficient / non accessible countries
(2) High likelihood programs are considered to be those with a probability of actual deployment greater than or equal to 75%, based on the evaluation of a series of elements such as the definition of the ship
configuration, Country situation, availability of defense budgets, etc.
(3) Including aircraft carriers, destroyers and frigates
(4) Including patrol vessels and corvettes
(5)
(6)
The program related to the construction of Frigates for the Canadian Navy is valued only in terms of the potential revenue for Fincantieri
Not included in the analysis
9
Shipbuilding - Naval: commercial strategy

Description

Consolidation and   • Italy: continuing execution of Italian Navy’s fleet renewal program
development of        − 9 vessels in backlog (7 Multipurpose Offshore Patrol units, 1 Logistic Support Ship, 1
existing programs
                        Multipurpose amphibious unit), with first delivery in 2019
                      − options for 3 vessels (Multipurpose Offshore Patrol units)
                      − Deliveries of remaining FREMM vessels (4 units)

                    • US: completion of current backlog of LCS program

                      − 9 vessels in backlog
                      − 1 option
                      − Awarded budget for design phase of FFG(X)

                    • Qatar: execution of contract with the construction of 7 vessels
                      − 4 corvettes, 1 amphibious vessel (LPD - Landing Platform Dock), 2 patrol vessels
                        (OPV - Offshore Patrol Vessel), with first delivery in 2021

Other programs      • Australia
                    • US FFG(X)
                    • Italian Navy (submarines – 3rd batch)

                     Leveraging established know-how and reputation to access new markets through the development of both well
                                                       proven products and new concepts

                                                                                                                             10
Shipbuilding: quantifying main drivers of growth and increasing profitability
Cruise ships by delivery year: prototypes, sister ships and quasi-sister ships
# of ships
5 5 5 5 • Deliveries heavily skewed
Cruise: mix Sister ships
4
prototypes/ and quasi- towards sister ships with
sister ships and 80% 80% 80% sister ships lower execution risks and
100%
quasi-sister ships 100% Prototypes better margins
20% 20% 20%
2018 2019 2020 2021 2022
Cruise ships >90k GRT: revenues per lower berth by delivery year
2016 = 100
160 • Positive trend due to
130 135
114 115 progressive, structural
Cruise: pricing
trends increase in base line pricing
for contracts acquired at
greater margin
2018 2019 2020 2021 2022
Naval revenues/Shipbuilding revenues
39% 40%
Naval revenues/ 34% 34% 36%
• The relative contribution is
Shipbuilding
influenced by the strong
revenues
uptick in cruise volumes
2018 2019 2020 2021 2022
11Offshore: market overview
Description E&P Expenditure
Offshore Oil&Gas: forecast USD BN
365
• Exploration & Production Expenditure is expected to reach a 320
345
310
275 285
minimum in 2018, then slowly return to growth 245 260
230 220 235
• Negative outlook for PSV and AHTS demand due to oversupply
following oil price fall and significant postponements of drilling
projects
• VARD uses a tender driven approach to establish itself in other
2011 2012 2013 2014 2015 2016 2017 2018 2019 2020 2021
market segments of the offshore business
Focus on new business opportunities
New business opportunity
• Small FPSO: Requires partnerships with producers of topside or
FPSO operators
• Gas (LNG): increase in future demand, also thanks to new
environmental rules. The market for smaller FLNG and LNG carriers
will likely ramp up. VARD to leverage on existing patent (Brevik
containment system) for small LNG vessels
• Offshore wind: expected installed capacity in 2022 at 46,4 GW Small FPSO Gas Offshore wind
(2018-2022 CAGR at 15%)
• Norwegian coastal ferries: sector characterized by old fleet
• Aquaculture & fisheries: sustained market growth with increasing
complexity related to higher technological and industrial contents
• Specialized vessels: old fleet of cable layer and pipe layer. New
market for mining vessels
Norwegian Acquaculture Specialized vessels
coastal ferries & fisheries
Suorces: International Energy Agency - World Energy Outlook 2017: Global Energy Trends.
Rystad Energy - 2017 Annual Offshore Oil & Gas Market Report
Pareto Securities Equity Research, E&P Survey, Agosto 2017
12Offshore: strategy and action plan
Description
Revenue growth • Tender driven approach in the Offshore market, where first signs of recovery are becoming visible
• Furthering diversification efforts in expedition cruises, fishery/aquaculture and select opportunities in the
military segment, in countries where VARD already operates directly (Brazil, Norway)
Production footprint • Finalizing Tulcea’s cruise ship building capabilities
− segments of large cruise vessels to be transported to Italian yards
− autonomous production of smaller scale ships
• Production specialization in Norwegian yards
• Rightsizing and refitting of Vard Promar in order to seize local market opportunities and potential military tenders
Improvement of cost • Continued focus on
position and operating − rightsizing of operations with improvements to increase efficiency and quality
efficiency − Strengthening of procurement efficiency
− Increasing of the scope of work in Romania to lower the average cost base
13Equipment, Systems and Services: strategy
Description
Continuous growth of • Development of large backlog already acquired
traditional businesses • Strong focus on expanding non-captive markets (in both System & Components, and After Sales)
• Enhancing After Sales services
− to include full lifecycle management for military vessels,
− as well as extending offering to the cruise clients in established high value areas (e.g. Fincantieri Services USA)
• Potential expansion into new geographical areas
Insourcing of other • Leveraging internalization of Cabins business to bolster product offering in other high value-adding segments, such
high value added as:
businesses: from − Public areas
cabins to complete over the plan period, Marine Interiors will provide a total of 160,000 sq. meters of public areas, on 18 ships,
accommodation representing 27% of total public areas to be installed (in 2017 it provided 15,400 sq. meters, on 3 ships,
representing 13% of installed public areas)
Developing Equipment, Systems and Services business to fully transform Fincantieri into a “one stop shop” for its
clients
14Section 2
Short and medium term
financial targets
LCS 7
US Navy
FREMM
Iitalian Navy
FREMM
Iitalian NavyShort and medium term financial targets
+18/20% +17/21%
€ bln +3/6%
5.0
Revenues
2017A 2018E 2020E 2022E
~7.5% ~8.0% 8.0-9.0%
6.8%
EBITDA margin
Consolidated – 2017A 2018E 2020E 2022E
Fincantieri Group
3.0-4.0%
Adjusted 2.0-3.0%
1.8% 1.8-2.0%
Net income(1)
margin
2017A 2018E 2020E 2022E
€ bln 0.4-0.6
0.3 0.2-0.4
Net Debt
0-0.1
2017A 2018E 2020E 2022E
(1) Net income before extraordinary and non-recurring items
16Short and medium term financial targets – key take away messages
• Revenues expected to increase between 3% and 6% driven by the progress of cruise construction volumes, also supported by
the increasing workload of Romanian yards
2018 • EBITDA margin around 7.5% thanks to the increased contribution of profitable cruise projects and naval programs
Guidance
• Net debt increasing vs. 2017 due to the continued growth of cruise construction volumes
• Revenues estimated to grow in a range of 18% to 20% vs. 2018 supported by the continuing increase in volumes in cruise, the
effects of the diversification actions implemented by VARD, as well as the stronger contribution of naval both in Italy and abroad
2020 • EBITDA margin around 8.0% thanks to the consolidated recovery of cruise profitability and the increasing effects of the economies of
Objectives scale
• Operating cash flow starting to kick-in driven by the stabilization of volumes in cruise and the contribution from naval projects
with net debt expected to decrease vs. previous years
• Revenues estimated to grow in a range between 17% and 21% vs. 2020 thanks to the expansion of volumes across all the
segments, especially outside Italy
• A sound profitability in the cruise sector, the continuing contribution from naval, the recovered performance of VARD and the effects of
2022 the economies of scale across the whole Group are expected to push EBITDA margin up to 8.0%-9.0% in 2022, leading to a
Objectives
structural increase in performance
• Net debt substantially reduced (essentially zero excluding construction loans) thanks to a stronger operating cash flow and the
gradual completion of the investment plan pursued over the plan period
• Revenues growth: up to approx. 50% by 2022
• EBITDA growth: up to approx. 100% by 2022
• Increasing reliance on self-financing from operational cash flow to reduce net debt substantially and fund an investment plan tailored to
support an expanding business
17Q&A
18You can also read