Investor Presentation - Citi CEO Conference Investor Deck March 2021
←
→
Page content transcription
If your browser does not render page correctly, please read the page content below
Investor
Presentation

Citi CEO Conference
Investor Deck
March 2021

Current Business Update

                          Lightview | Boston, Massachusetts
                                                              1
CURRENT BUSINESS UPDATE

Recent highlights.
ACC experienced an improved operating environment as it moved into the Spring 2021 semester.

– 2020 and COVID impact summary.                                                                            Improved Operating Environment
  •   Achieved an average rental rate increase of 1.1% and 90.3% leased rate for 2021 same store                                       2Q20    3Q20    4Q20
      properties as of September 30, 2020.
                                                                                                            Rent Collections           93.7%   94.6%   97.6%
  •   Received payments for approximately 97.6% of rent in the fourth quarter, compared to 93.7%
      and 94.6% in the second and third quarters, respectively.                                             Refunded Rent (millions)   $15.1   $2.1    $1.5
  •   Refunded rent of only $1.5 million in 4Q compared to $15.1 million and $2.1 million in on-            RHP Rent Abatements
      campus rent refunds in 2Q and 3Q, respectively.                                                                                  $8.6    $4.7    $0.9
                                                                                                            (millions)
  •   Rent abatement through the Resident Hardship Program totaled $0.9 million in the fourth
      quarter compared to $8.6 million in the second quarter and $4.7 million in the third quarter.

– Current environment.
  •   Signed 3,600 leases for spring 2021 move-ins, ~50% more than last year’s 2,400 leases.
  •   Industry-wide preleasing is progressing at a slower pace than in years prior to COVID, however
      asking rental rates remain in-line or slightly above prior year pricing and ACC leasing velocity is
      outpacing peers in the majority of markets.
  •   Incrementally positive university announcements regarding Fall 2021 in-person classes,
      exemplified by the announcements by the U-Cal and Cal State university systems as well as
      several other major universities who have been fully online in the current academic year.
  •   Early indications on college application data and university admissions commentary indicate a
      potential increase in demand for higher education in the fall for Tier 1 universities.                 Lightview | Boston, MA

                                                                                                                                                               2
CURRENT BUSINESS UPDATE

Students desire to be in college environment.
Universities were able to successfully manage enrollment despite the turmoil caused by COVID-19.

– ACC achieved an average same store rental rate increase of 1.1% and 90.3% leased rate for Fall 2021.

– As of September 30th, classes at 13 of the universities ACC serves were primarily in-person, while 55 universities were using some level of
  online curriculum delivery methodology.

– However, Fall 2020 total enrollment at the universities ACC serves is flat compared to 2019 (-0.3% year over year).

– Leasing at properties that primarily serve first-year students was most impacted by COVID-19 but the company expects the long-term impact
  to be limited as first-year enrollment was only down 1.6%.

– Universities that reported on international enrollment statistics were also able to absorb a 14.1% decline in international enrollment by
  admitting more domestic students and ultimately only experiencing a 0.4% decrease in total enrollment.
                                                                                                                Fall 2020 Enrollment Data by CHE Curriculum
Fall 2020 Enrollment Data                                                                                       Delivery
                                                                                      # Markets w/                                      # Markets
                                                                                          Data       % Change   Fall Curriculum Plans    w/ Data % Change
Change in Total Enrollment                                                                  68        -0.3%     Hybrid                    21         1.2%
      Total Change in Enrol. - Growth Markets                                               33         2.5%     Primarily in person       13        -0.1%
      Total Change in Enrol. - Decline Markets                                              35        -3.0%     Primarily online          30        -1.2%
Change in First-Year Enrollment                                                             61         -1.6%    Fully online               4        -3.3%
Change in International Enrollment                                                          60        -14.1%    Total                     68        -0.3%

Source: The Chronicle of Higher Education data as of September 30, 2020 and ACC Research.
                                                                                                                                                              3
CURRENT BUSINESS UPDATE

Consistent enrollment growth.
Enrollment growth at ACC targeted universities has remained steady throughout the economic cycle.
– Declining national enrollment statistics over the last decade have been driven by non-traditional students leaving private for-profit universities
  and community colleges to return to the workforce as the economy has recovered.
– Public 4-year universities have averaged 1.6% annual enrollment growth since 1970 and have continued at these levels since the Great
  Recession.
                                                                                                                                                                     Public 4-year University
Public 4-year Universities Remain in Demand                                                                                                                         Enrollment Growth (CAGR)

                                     20%
                                                                                                                                                                        Since 1970   1.6%
                                     10%                                                                                                                                Since 1980   1.5%
      Cumulative Enrollment Growth

                                      0%                                                                                                                                Since 1990   1.5%
                                                                                                                                                                        Since 2000   2.2%
                                     -10%
                                                                                                                                                                        Since 2010   1.6%
                                     -20%

                                     -30%

                                     -40%

                                     -50%
                                            2009       2010    2011           2012             2013         2014      2015        2016        2017           2018

                                            Public 4-year     Private 4-year Nonprofit                Public 2-year      Private For-profit          Total

Source: National Center for Education Statistics 2019 Table 303.25 (Data through Fall 2018).                                                                                                    4
CURRENT BUSINESS UPDATE

College is affordable and a sound investment.
Public 4-year universities still provide a good return and student debt is manageable.
– At four year public universities, 34% of students graduate with no debt1.
      • Of those graduating with debt, the average student loan balance is only $26,9001.
– $23,000 salary differential between college graduates and high school graduates2.
– Annual average in-state tuition costs at the 60 public universities served by ACC is less than $11,000.
– Annual net tuition and fees is less than $10,000 for 77% of students at four-year public institutions (after grant aid)3.
– Student loan default rates average sub-4% at Power 5 and Carnegie R1 institutions.

 Average Earnings by Level of Education2                                                                                         Student Debt Levels1 and Default Rates4
  $60,000                                                                                                      14%                $45,000                                                                                              16%
                        13%                          $23,000                                                                                                 Sub-4% default rates
  $50,000
                                                   incremental                             $54,990             12%
                                                                                                                                  $40,000
                                                                                                                                                              at Power 5 and R1                                        14%
                                                                                                                                                                                                                                       14%
                                                     earnings                                                                     $35,000                         institutions                                                         12%
                                                                                                               10%
  $40,000                                                                                                                         $30,000
                                                                                                                                                                                                                                       10%
                                                                                                               8%                 $25,000
  $30,000                                       7%                  $35,000
                                                                                                                                                                                                                                       8%
                                                                                                               6%                 $20,000                  7%                             7%
                      $25,980                $31,990
                                                                                                                                                                                                                                       6%
  $20,000                                                              4%                                                         $15,000
                                                                                                               4%
                                                                                                                                                                                                                                       4%
                                                                                                                                  $10,000
  $10,000                                                                                     3%
                                                                                                               2%                                                                                                                      2%
                                                                                                                                   $5,000
                                                                                                                                                         $26,900                        $31,450                       $39,900
         $0                                                                                                    0%                        $0                                                                                            0%
                 Less than high           High school          Some college, Bachelor's or                                                           4-year Public             4-year Private Non-               4-year Private For-
                     school               completion           no bachelor's higher degree                                                                                            Profit                            Profit
                   completion                                     degree

                    Median Annual Earnings ($)                            Unemployment Rate (%)                                                            Average Loan Balance ($)                   Default Rate (%)

Source: Company data
1. TICAS, “Quick Facts about Student Debt”, April 2019.                                                              3. The College Board, Trends in College Pricing 2018.                                                                   5
2. National Center for Education Statistics 2018 Table 502.30 and Table 501.80. For persons 25-34 years old.         4. Federal Student Aid an Office of the U.S. Department of Education, September 26, 2018.
Company Competitive Position

                               Plaza Verde | Irvine, California
                                                                  66
COMPANY COMPETITIVE POSITION

Who we are.
ACC owns the industry’s preeminent portfolio—located a median distance of only one-tenth of a mile
from campus.
We primarily focus on developing and owning on-campus and pedestrian-to-campus properties serving Power 5
conferences and Carnegie R1 institutions.
Investment criteria focuses on differentiated properties in close proximity to campus within submarkets with high
barriers to entry.

Current Portfolio                                                                                                                     Portfolio NOI Composition by Distance to Campus1

                                                                                                                                                                     34                           115                             10          1
                                                                                                                                        PROPERTIES
                                                                                                                                           NOI                      33%                           61%                             6%         0%
                                                                                                                                                                             94% of NOI within ½ mile from campus

                                                                                                                                                                                                         1/2   1  1+
                                                                                                                                                              University                                mile mile mile
                                                                                                                                                                             0.1 miles median distance to campus

     Single Property in Market

     Multiple Properties in
     Market

1. Includes owned properties, properties currently under construction, and properties expected to commence construction during the current calendar year. NOI used for percentage calculations for properties (i) open for the entire trailing 12 month period
   are based upon historical data, and (ii) owned for less than the full trailing 12 month period are based upon historical data and management’s estimates. Excludes properties classified as held for sale. Actual results may vary.                           7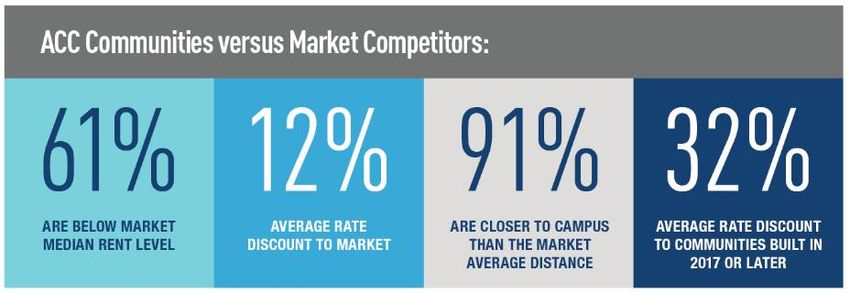
COMPANY COMPETITIVE POSITION

Modernizing an industry.
Composition of student housing should continue to transition toward more modern, purpose built supply.

Modernization is opportunity.                                                                                                                          Supply in 68 ACC University Markets2
On-campus
– Primarily consists of residence halls built in the 1950’s-60’s designed for the Baby                                                                           Drive: 13%
                                                                                                                                                             Median Age: 11 years
  Boom generation.
– The median age of existing on-campus housing exceeds 50 years old in ACC
  markets.                                                                                                                                    Purpose Built 25%
– New purpose built living learning communities will replace these antiquated
  dormitories with productmeeting the needs of currentstudents.                                                                          Pedestrian: 12%
                                                                                                                                        Median Age: 7 years
Off-campus
– Majority of current stock is low density alternate housing such as absentee                                                                                                                             Alternate Supply
  landlord communities and single family residences not designed for today’s                                                                                                                                    52%
  student.
                                                                                                                                                     On-Campus
– New purpose built development off-campus is replacing this sub-standard                                                                               23%
  alternate housing with modern purpose-built product.
– Currentpurpose built communities began in the mid 1990’s.                                                                                                            Modernization
       • The majority of early communities (pre-2010)were drive properties.
                                                                                                                                                                       is opportunity.
       • Since 2010, the majority of development has been built pedestrian to
         campus.1

1. According to the Company’s most recent annual review of overall market composition.
2. According to the Company’s analysis; estimated based on 2020 supply categories divided by academic year 2020/2021 preliminary enrollment within ACC’s 68 university markets. Purpose built reflects certain off-campus properties that may   8
    lease by the unit rather than by the bed, but compete with ACC properties in the student housing market.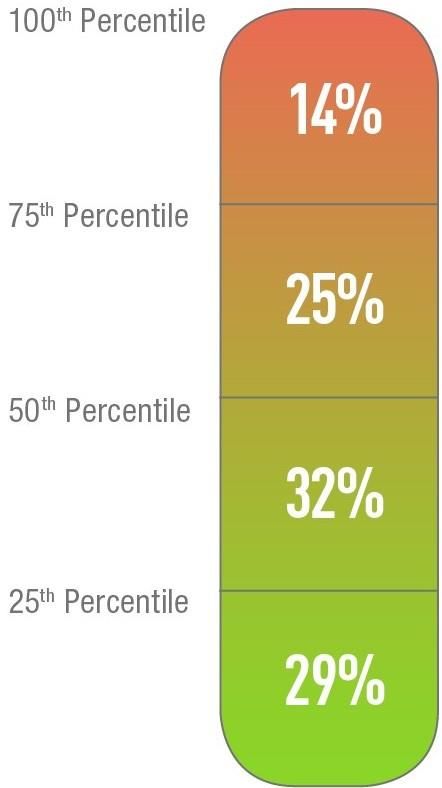
COMPANY COMPETITIVE POSITION
Historically recession resistant cash flows.
Stable Performance Through Cycles
200 40.0%
180 30.0%
160
Year over Year Growth
20.0%
140
Indexed Growth
10.0%
120
0.0%
100
-10.0%
80
60 -20.0%
40 -30.0%
20 -40.0%
0 -50.0%
2004 2005 2006 2007 2008 2009 2010 2011 2012 2013 2014 2015 2016 2017 2018 2019
4 Yr Public University Enrollment Same Store NOI Growth (Indexed) Multifamily Same Store NOI Growth (Indexed)
1 S&P 500 Annual Return
Portfolio Improvement Since Last Downturn
Distance to Campus (% of Beds)
ACC’s recession resilient cash flows have produced similar same store
< 1/2 Mile 1 Mile 1+ Miles
NOI growth to multifamily, with less volatility throughout the economic 2009 58% 22% 20%
cycle. 2019 93% 7% 0%
Strategic capital recycling has further strengthened portfolio quality relative % of Beds On-Campus
to last downturn. 2009 2019
8% 26%
Sources: U.S. Department of Education, National Center for Education Statistics, Integrated Postsecondary Education Data System (IPEDS), Fall Enrollment component final data (2002, 2003, 2006 - 2016) and provisional data (2004, 2005, 2017). ACC Research.
1. Multifamily peer group includes AVB, AIV, EQR, ESS, CPT, MAA, UDR. 9
Note: 2018 & 2019 enrollment growth based on ACC portfolio.COMPANY COMPETITIVE POSITION
Repositioned for value creation.
− ACC’s strategically refined portfolio is positioned to have resilient performance over the long term.
• Closer location to campus.
• Higher product quality & correspondingly lower cap-ex requirements.
• Enhanced price point and product differentiation.
• Improved sustainability of cash flows.
− Portfolio of primarily core assets offers an accretive reinvestment opportunity into higher yielding
developments.
− Increased focus on match-timing and sizing capital raises relative to deployment into income
producing assets, as frequently as possible.
− Operational systems enhancement through Next Gen and business intelligence investment have
increased the efficiency and scalability of the company’s platform.
− Prior to COVID, FY 2019 FFOM per share growth of 5% reflected the beginning of a return to
improved earnings per share growth.
AMERICAN CAMPUS COMMUNITIES :: 10
10COMPANY COMPETITIVE POSITION
Creating value through selective development.
ACC has consistently delivered high-quality, value-enhancing developments throughout the economic cycle.
– ACC has set a high standard on what projects are
selected to be on-balance sheet.
0.10
Average miles to
• Over the last decade, ACC closed on only 15% of all
campus for ACC’s
underwritten development deals.
developed assets.
– $8.1 billion in owned and third-party development for
our university partners since inception.
Per bed 2019 annual
$155
recurring capex for
– $4.8 billion in owned developments.
development assets
• $2.7 billion through the on-campus ACE program. compared to $292 for
• $2.1 billion in off-campus development. acquired properties.
– Current yields of 6%+ represent an attractive 150-200 Development NOI
60.8%
basis point spread to private market values. margin compared to
51.2% for acquired
properties1.
Source: Internal company data and public filings.
11
1) Pre-COVID as of 2019.COMPANY COMPETITIVE POSITION
Build for the masses, not the classes.
– ACC’s properties are strategically positioned to offer a
wide array of unit types and price points within the same
ACC Effective Rental Rates versus
community which appeals to a broader set of student Competitive Set (% of ACC Properties)
residents.
– Proprietary unit design and configuration maximizes rent
per square foot while creating affordable per bed price
points not previously available in the market.
Competitors target the highest socio-economic, while ACC
targets the widest socio-economic
12
Source: Data from RealPage Axiometrics’ Student Housing Performance Time Series by Month report as of 10/24/2019. Market statistics are based on all properties tracked by RealPage in ACC’s 69 markets located within 1 mile from campus with effective rental rate data for September 2019.COMPANY COMPETITIVE POSITION
On-campus modernization opportunities post-COVID.
Enhanced opportunities to capitalize on the potential acceleration of modernization due to COVID-19.
– Impact of COVID highlighted need to accelerate
modernization, especially of community bath residence halls “The coronavirus pandemic resulted in fiscal challenges
– Financial stress from COVID will push more universities to P3 at institutions and virtual learning dampened housing
and off-balance sheet financing structures, like the ACE demand, but Fitch anticipates an increase in project
program. financings and public private partnerships (PPPs) over
the medium term as institutions look to expand housing
– ACC’s public company platform makes us the only company and repurpose assets.”
that offers single-source partner equity/developer/manager
Project Financings in U.S. Higher Education
solution. Report, October 2020
Traditional community bath-
53 183k
Average age of existing on-
style beds within ACC markets,
campus housing in ACC
representing over 39% of
markets.
existing on-campus housing.
Universities being tracked by
60 62%
Win rate for P3 projects
ACC that are evaluating
pursued and awarded in 2018-
potential privatized residential
2019.
projects.
13
Source: Internal company data and public filings.COMPANY COMPETITIVE POSITION
Next Gen-enhanced proprietary operating platform.
ACC’s proprietary operating platform created a significant core competency that will be enhanced with the
implementation of our Next Gen business intelligence systems.
Current Proprietary Platform Next Gen Enhancements
- 100% Digital Leasing
- “Instant Leasing” Capabilities
Leasing - Intelligent Marketing Campaigns
- Enhanced Self-Service Customer Experience
Targeted Social University Brand
Ads / SEO Media Relationships Value
- Dynamic & Perpetual Inventory Management
Operations/
- Enhanced Current Period Leasing
Revenue
Management - Automated Data Generation
- ‘Smart’ Rate Setting Through BI
Centralized Proprietary LAMS
Corporate Support Systems
Allows for the combined analysis of ACC’s
Investment sector leading Market, Competitor, Leasing and
Decision Financial Data Warehouses in ways previously
Making unobtainable allowing for unprecedented
insights into the business.
Analytics Business Portfolio
Intelligence Optimization
14COMPANY COMPETITIVE POSITION
Balance sheet positioned to weather disruption.
The company benefits from broad access to capital, ample liquidity and limited near-term debt maturities.
Balance Sheet Management Balance Sheet Liquidity (in millions)1
Investment Grade Credit Profile Revolver Capacity $1,000.0
• BBB negative / Baa2 stable2.
• Provides access to broadest set of capital options.
Drawn to Date ($371.1)
• Consistent cash flows and credit statistics. Available to Draw $628.9
Cash and Cash Equivalents $54.0
Maintain a staggered debt maturity schedule
• Limited mortgage maturities in 2021. Total $682.9
Broad access to capital
• ACC has raised $6.4 billion from dispositions, joint
ventures and capital markets activity since the Debt Maturity Schedule1
beginning of 2015. $1,000 Unsecured Notes On-Campus Participating Properties
Access to GSE’s and other secured debt provides flexibility $900
Unsecured Term Loans Unsecured Revolving Credit Facility
$800
Manageable development exposure with approximately 2% Mortgage Loans
of gross assets in annual developments through 2023 $700
• $142 million development cost remaining to fund is $600
covered by current liquidity.
$500 $200
$800
$400
$400 $2
$300
$371 $400
$200 $400 $400
3
$330
$100 $24
$132
$75 $26 $9 $8 $40
1. As of December 31, 2020. $0
2. A credit rating is not a recommendation to buy, sell, or hold securities and may be changed or withdrawn at any time. 2021 2022 2023
3. In February 2021, $24.0 million of on-campus participating property mortgage debt scheduled to mature in 2021 was refinanced, which extended the maturity to February 2028.
2024 2025 2026 2027 2028 2029 2030+ 15FORWARD-LOOKING STATEMENTS AND NON-GAAP MEASURES
In addition to historical information, this presentation contains forward-looking statements under the applicable federal securities law. These statements are based on
management’s current expectations and assumptions regarding markets in which American Campus Communities operates, operational strategies, anticipated events
and trends, the economy, and other future conditions. Forward-looking statements are not guarantees of future performance and involve certain risks and uncertainties,
which are difficult to predict. For discussions of some risks and uncertainties that could cause actual results to differ materially from those expressed or implied by the
forward-looking statements, please refer to our filings with the Securities and Exchange Commission, including our Annual Report on Form 10-K for the year ended
December 31, 2020 under the heading “Risk Factors” and under the heading “Business - Forward-looking Statements” and subsequent quarterly reports on Form 10-Q.
We undertake no obligation to publicly update any forward-looking statements, including our expected 2021 operating results, whether as a result of new information,
future events, or otherwise.
This presentation contains certain financial information not derived in accordance with United States generally accepted accounting principles (“GAAP”). These
items include earnings before interest, tax, depreciation and amortization (“EBITDA”), net operating income (“NOI”), funds from operations (“FFO”) and FFO-Modified
(“FFOM”). The National Association of Real Estate Investment Trusts (“NAREIT”) currently defines FFO as net income or loss attributable to common shares
computed in accordance with GAAP, excluding gains or losses from depreciable operating property sales, plus real estate depreciation and amortization, and
after adjustments for unconsolidated partnerships and joint ventures. The Company presents FFO because it considers FFO an important supplemental
measure of its operating performance and believes it is frequently used by securities analysts, investors and other interested parties in the evaluation of REITs. We also
believe it is meaningful to present FFOM, which reflects certain adjustments related to the economic performance of its on-campus participating properties,
impairment charges, losses on early extinguishment of debt related to property dispositions, and other non-cash charges. FFO and FFOM should not be considered
as alternatives to net income or loss computed in accordance with GAAP as an indicator of the Company's financial performance or to cash flow from operating
activities computed in accordance with GAAP as an indicator of its liquidity, nor are these measures indicative of funds available to fund its cash needs,
including its ability to pay dividends or make distributions. The Company defines property NOI as property revenues less direct property operating expenses,
excluding depreciation, but including allocated corporate general and administrative expenses.
1613
The Summit | Philadelphia, PA Plaza on University | Orlando, FLYou can also read