FINCANTIERI Update post FY 2017 Results
←
→
Page content transcription
If your browser does not render page correctly, please read the page content below
FINCANTIERI
Update post FY 2017 Results

April, 2018
Safe Harbor Statement

This Presentation contains certain forward-looking statements. Forward-looking statements concern future circumstances and results and
other statements that are not historical facts, sometimes identified by the words "believes," "expects," "predicts," "intends," "projects,"
"plans," "estimates," "aims," "foresees," "anticipates," "targets," and similar expressions. The forward-looking statements contained in this
Presentation, including assumptions, opinions and views of the Company or cited from third party sources, are solely opinions and
forecasts reflecting current views with respect to future events and plans, estimates, projections and expectations which are uncertain and
subject to risks. Market data used in this Presentation not attributed to a specific source are estimates of the Company and have not been
independently verified. These statements are based on certain assumptions that, although reasonable at this time, may prove to be
erroneous. By their nature, forward-looking statements involve a number of risks, uncertainties and assumptions that could cause actual
results or events to differ materially from those expressed or implied by the forward-looking statements. If certain risks and uncertainties
materialize, or if certain underlying assumptions prove incorrect, Fincantieri may not be able to achieve its financial targets and strategic
objectives. A multitude of factors which are in some cases beyond the Company’s control can cause actual events to differ significantly
from any anticipated development. Forward-looking statements contained in this Presentation regarding past trends or activities should
not be taken as a representation that such trends or activities will continue in the future. No one undertakes any obligation to update or
revise any forward-looking statements, whether as a result of new information, future events or otherwise. Market data used in this
Presentation not attributed to a specific source are estimates of the Company and have not been independently verified. Forward-looking
statements speak only as of the date of this Presentation and are subject to change without notice. No representations or warranties,
express or implied, are given as to the achievement or reasonableness of, and no reliance should be placed on, any forward-looking
statements, including (but not limited to) any projections, estimates, forecasts or targets contained herein.
Fincantieri does not undertake to provide any additional information or to remedy any omissions in or from this Presentation. Fincantieri
does not intend, and does not assume any obligation, to update industry information or forward-looking statements set forth in this
Presentation. This presentation does not constitute a recommendation regarding the securities of the Company.

Declaration of the Manager responsible for preparing financial reports
Pursuant to art. 154-BIS, par. 2, of the Unified Financial Act of February 24, 1998, the executive in charge of preparing the corporate
accounting documents at Fincantieri, Carlo Gainelli, declares that the accounting information contained herein correspond to document
results, books and accounting records.

                                                                                                                                            2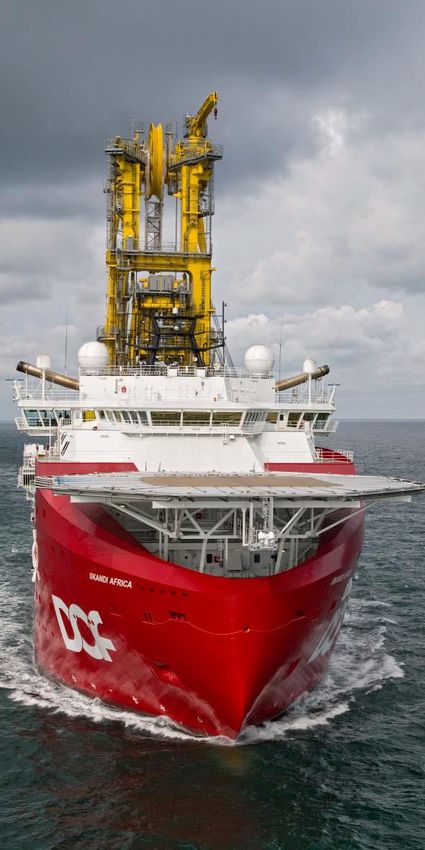
Table of Contents
Section 1 Introduction
Section 2 FY 2017 results and outlook
Section 3 Appendix - Historical financial performance
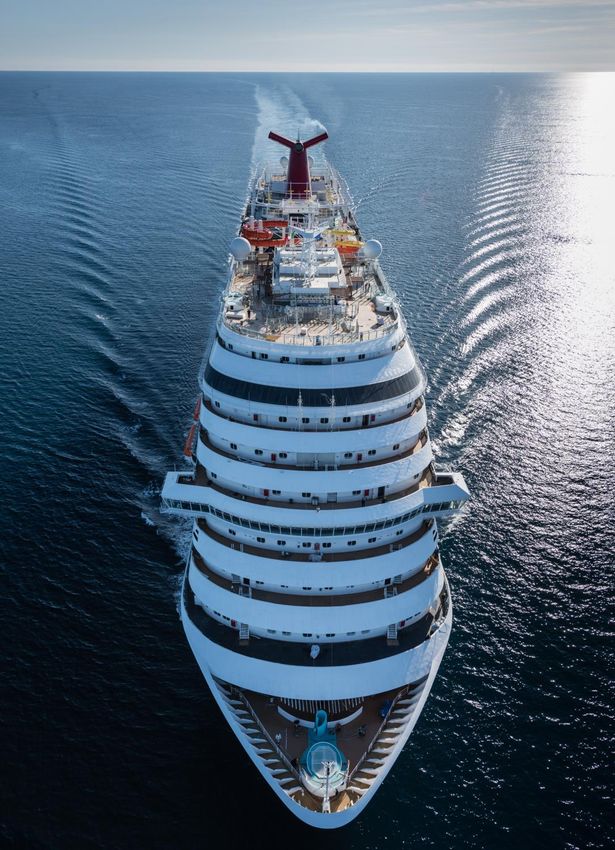
Carnival Vista
Carnival Cruise Lines
“ECO Notation” by Lloyd‘s Register
for exceeding environmental
standards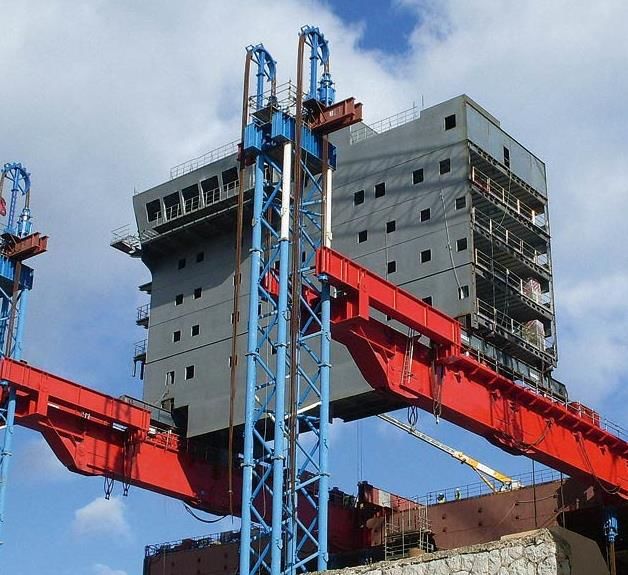
Section 1
Introduction
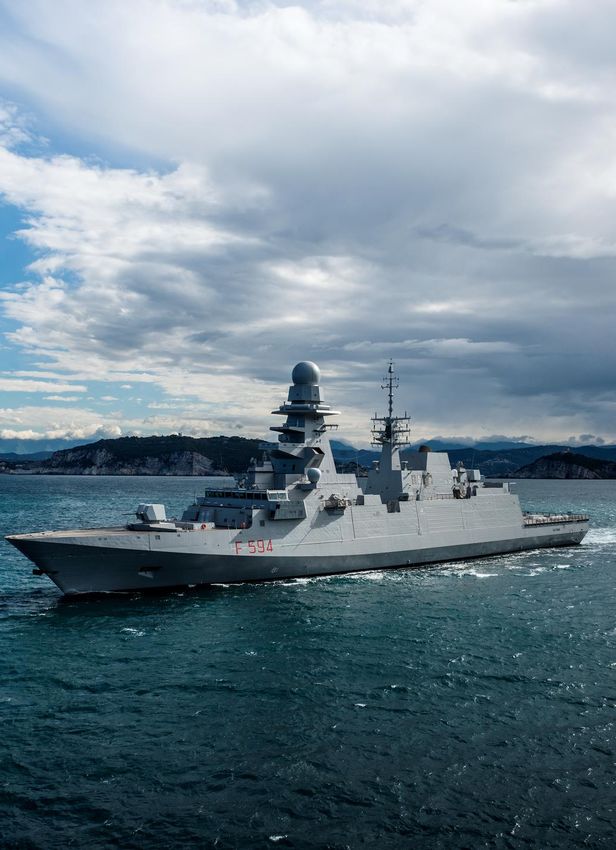
FREMM “Alpino”
Italian Navy
Best in class in terms of endurance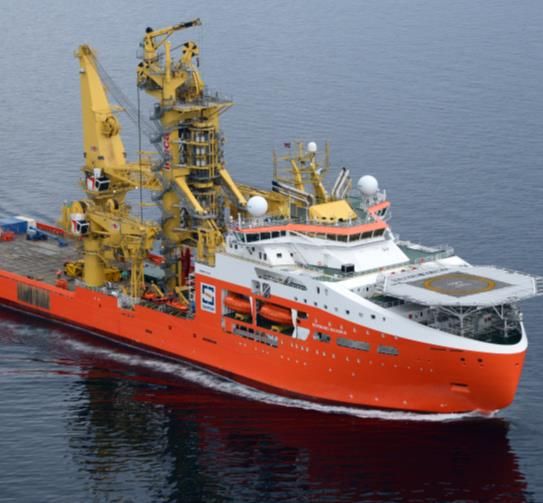
Fincantieri at a glance

                                                                                     #1 Western designer & shipbuilder(1)
                                                                                 with 230 years of history & >7,000 ships built

                                                                                                                                    Norway
                                                                                                                                     • 5 shipyards                                                                20 shipyards
     € 5,020 mln revenues
                                                                                                                                                                                                                  4 continents
                                                                                                                                                         Romania
                                                                                                                                                                                             China
                                                                                                                                                             • 2 shipyards
                                                                                                                                                                                              • 1 Joint Venture
    ~ € 26.1 bln total backlog(2)
                                                                                                                                                                                                                  ~ 19,500 employees
       • € 22 bln backlog
                                                                                                                                                                                                                  ~ 80,000 subcontractors
       • € 4.1 bln soft backlog                                                  USA
                                                                                                                                                        UAE
                                                                                 • 3 shipyards                                                                                               Vietnam
                                                                                                                                                                • 1 Joint Venture            • 1 shipyard
     Revenues by geography                                                                                                                                                                                        Employees by location
                                            Italy
                                            15%                                  Brazil
                                                                                                                                                                                                                                      Italy
                                                                                 • 1 shipyard                                                                        Italy                                                            43%
                            € 5.0 bln                                                                                                                                                                                       ~19,500
                                                                                                                                                                     • 8 shipyards                                   RoW
            RoW                                                                                                                                                                                                      57%
            85%

Note: all figures reported at December 31, 2017                                                                                                                       Corporate/BU headquarters
(1) By revenues, excluding naval contractors in the captive military segment. Based on Fincantieri estimates of shipbuilders’ revenues in 2016
(2) Sum of backlog and soft backlog; soft backlog represents the value of existing contract options and letters of intent as well as contracts in advanced            Shipyard      Joint Venture
    negotiation, none of which yet reflected in the order backlog                                                                                                     Operating subsidiary
                                                                                                                                                                      Representative / Sales office
                                                                                                                                                                                                                                              5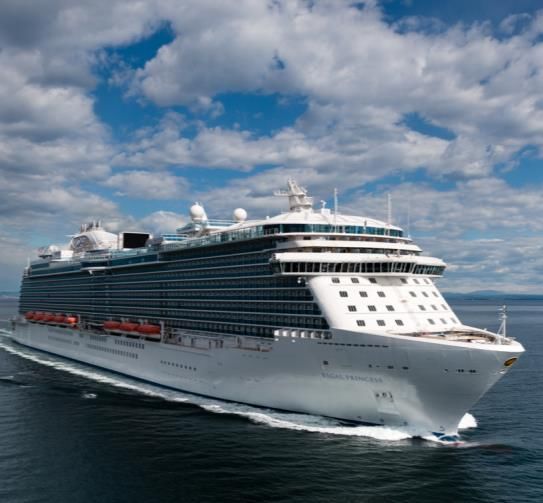
Business units, products and positioning
                                End markets                    Main products                                          Positioning                                                               Revenues 2017(4) Backlog(5)
                                   Cruise                        • All cruise ships                                   • #1 worldwide
                                                                   (from contemporary to luxury)                        (~45% market share(1))
                                                                                                                                                                                                  € 2,649 mln
                                                                                                                                                                                                  (49.2% on total)

                                    Naval                       • All surface vessels (also stealth)                  • Leader:
                                                                • Support & Special vessels                             − #1 in Italy(2)
                                                                                                                                                                    € 1,212 mln                                      € 20,238 mln
   Shipbuilding                                                 • Submarines                                            − Key supplier for US Navy & Coast
                                                                                                                          Guard  (3)                                (22.5% on total)                                 (58 ships)
                                                                                                                        − Key supplier for Qatar Emiri Naval Forces

                                    Other                       • High tech ferries                                   • Leading player:
                                                                • Large mega-yachts                                     − High tech ferries
                                                                                                                                                                                                  € 22 mln
                                                                                                                        − Large mega-yachts
                                                                                                                                                                                                  (0.4% on total)

                                                                • OSV                       • Offshore wind           • Leading player in
                                                                • Drilling                  • OPV                       high-end OSVs
                                                                                                                                                                                                  € 943 mln          € 1,418 mln
       Offshore                                                   units                     • Expedition
                                                                • Fisheries/                  cruise                                                                                              (17.5% on total)   (48 ships)
                                                                  aquaculture               • Special vessels

                                                                • Marine systems, components &                        • Leading player worldwide
     Equipment                                                    turnkey solutions
                                                                • Ship interiors                                                                                                                  € 558 mln
     Systems &                                                                                                                                                                                                       € 1,186 mln
                                                                • Naval services                                                                                                                  (10.4% on total)
      Services
                                                                • Ship repairs & conversions
(1) By oceangoing cruise ships > 10,000 gross tons ordered in the 2004 – june 2017 period (including VARD). Source:             (4) Breakdown calculated based on revenues gross of consolidation effects
    Fincantieri analysis based on IHS Lloyd’s Fairplay – Shippax data and Company press releases                                (5) At December 31, 2017
(2) For all the large ships and excluding minesweepers and small ships below 45 m in length
(3) For medium size ships, e.g. patrol vessels and corvettes

                                                                                                                                                                                                                                   6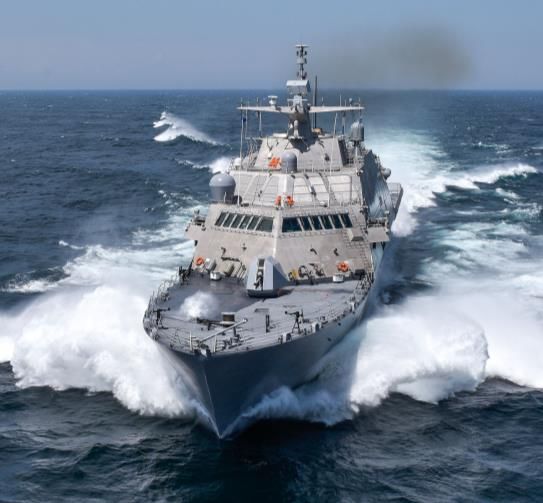
Track record, clients and technological leadership
1 Track record 2 Clients 3 Technological leadership
Cruise (3)
Ship deliveries • Carnival Vista: “ECO Notation” by Lloyd‘s
• Twofold Register for exceeding environmental standards
• 1990 – 2001 23 • Royal Princess: 1st cruise ship fully compliant
increase
• 2002 – 2017 57 with new regulations
in activity • Costa Luminosa & Costa Pacifica: Guinness
World Record for joint-christening of 2 ships
Shipbuilding
Naval Italian Navy United Arab
Ship deliveries Emirates • LCS Freedom: world’s fastest steel frigate
and Coast
• Steady, Navy
• 1990 – 2001 51(1) Guard • Aircraft Carrier Cavour: world’s most powerful
low risk Qatar Emiri non-nuclear propulsion system
US Navy
• 2002 – 2017 65(1) Naval Forces
• More than 20 prototypes developed over the
business
Algerian Indian last fifteen years
Navy Navy
Ship deliveries • Normand Maximus: largest offshore vessel
• Acquired ever built in Norway
• 1990 – 2001 72(2)
Offshore VARD in • Skandi Africa: “Ship of the Year 2015”(4)
• 2002 – 2017 305(2) • AMC Connector: world’s largest cable layer(5)
2013
• Far Samson: most powerful offshore vessel(6)
Italian Navy United Arab • Innovative and technologically advanced products
and Coast Emirates
• Strong revenue in terms of performances, lifecycle cost
Equipment • Start-up
Guard Navy
reduction and environmental standard
Systems & growth to € 558 US Navy
Qatar Emiri
in 2005 Naval Forces • Full product lifecycle management with unique
Services
mln in 2017 capacity to support vessels’ maintenance and
repair all over the world
(1) Includes other products delivered by Naval business unit. Includes US subsidiaries pre Fincantieri acquisition, excluding (4) Award instituted by the major Nordic shipping magazine Skipsrevyen
174 RB-M delivered since 2002, of which 28 in 2014 and 3 in 2015 (5) In terms of loading capacity (2011)
(2) Includes other products delivered by Offshore business unit. Includes VARD and predecessor companies (6) In terms of bollard pull at the date of construction (423 tons)
(3) Parent company of several brands: Carnival Cruise Lines, Costa Crociere, Cunard, Holland America Line, P&O Cruises,
Princess Cruise Lines and Seabourn Cruise Lines
7
Section 2

FY 2017 results

                          Skandi Africa
                                   DOF
                  Ship of the Year 2015
FY 2017 Key Messages

      • Results in line with Business Plan 2016-2020 targets

      • Record-high revenues, exceeding € 5 billion (+13% vs FY 2016), EBITDA at € 341 million (+28% vs FY 2016), Adjusted Net Profit(1)
         of € 91 million (+52% vs FY 2016) and Profit for the year at € 53 million (279% vs FY 2016)

      • Order intake at € 8.6 billion (+31% vs FY 2016), reconfirming the commercial effectiveness of the Group and the positive market
         environment. The important order for the new client Norwegian Cruise Line and the order for two new Seaside EVO cruise ships by MSC
         highlight the ability to attract new and retain existing clients
      • Total backlog(2) in excess of € 26 billion, covering ~ 5 years of work if compared to revenues:
                       − backlog at € 22 billion (+21%) with a portfolio of 106 units

                       − soft backlog(3) at € 4.1 billion

      • Sound operational performance in shipbuilding with 12 units delivered, of which 5 cruise ships (including MSC “Seaside”, the first
         prototype unit for MSC Cruises)

      • Net Debt at € 314 million (vs € 615 million in FY 2016)

      • Signed a share purchase agreement for the acquisition of 50 % of the share capital of STX France

      • Announced the delisting proposal for VARD

      • Proposed Dividend payment of € 0.01 per share

(1)   Net result before extraordinary and non recurring items
(2)   Sum of backlog and soft backlog
(3)   Soft backlog which represents the value of existing contract options and letters of intent as well as contracts in advanced negotiation, none of which yet reflected in the order backlog
                                                                                                                                                                                                  9
FY 2017 main orders (1/2)
                                                                                             Orders acquired in Q4

                  Vessel                                            Client                      Delivery

                            4 cruise ships                          Norwegian Cruise Line        2022-2025

                            1 cruise ship                           Holland America Line         2021
                                                                    (Carnival Corporation)

                            1 cruise ship                           Princess Cruises             2022
                            (sixth “Royal Princess” class vessel)   (Carnival Corporation)

                            1 cruise ship                           Silversea Cruises            2020
   Shipbuilding

                            2 cruise ships                          Viking Ocean Cruises         2021-2022

                            2 cruise ships                          MSC Cruises                  2021-2023

                            Littoral Combat Ship “Freedom”          US Navy                      2020
                            (LCS 27)

                                                                                                                10
FY 2017 main orders (2/2)
Orders acquired in Q4
Vessel Client Delivery
1 krill fishing vessel Aker BioMarine 2018
1 live fish transportation vessel Fjordlaks Aqua 2018
1 research expedition vessel Rosellinis Four-10 2020
(wholly-owned by the
industrialist Kjell Inge Røkke)
1 expedition cruise vessel Coral Expeditions 2019
Offshore
2 Offshore Fish Farming Operation Cermaq 2018
Platforms
Bergur-Huginn,
7 Stern Trawlers Utgerdarfelag 2019
Akureyringa, Gjögur,
Skinney-Thinganes
1 Luxury Polar Expedition Cruise Ponant 2021
Vessel
11FY 2017 main deliveries (1/2)
Deliveries in Q4
Vessel Client Delivery
Cruise ship “Viking Sky” Viking Ocean Cruises Ancona
Cruise ship “Majestic Princess” Princess Cruises Monfalcone
(Carnival Corporation)
Cruise ship “Silver Muse” Silversea Cruises Sestri Ponente
FREMM “Rizzo” Italian Navy Muggiano
Shipbuilding
Submarine “Romeo Romei” Italian Navy Muggiano
Cruise ship “Viking Sun” Viking Ocean Cruises Ancona
Littoral Combat Ship “Little Rock” US Navy Marinette
(LCS 9)
Cruise ship “MSC Seaside” MSC Monfalcone
12FY 2017 main deliveries (2/2)
Deliveries in Q4
Vessel Client Delivery
OSCV “Skandi Buzios” Techdof Vard Søviknes
OSCV “Far Superior” Farstad Vard Vung Tau
OSCV “Skandi Vinland” DOF Vard Langsten
2 Module Carrier Vessels Kazmortransflot Vard Braila
Offshore
6 Module Carrier Vessels Topaz Energy and Marine Vard Vung Tau
Vard Tulcea
1 LPG Carrier “Gilberto Freyre” Transpetro Vard Promar
OSCV “Kreuz Challenger” Kreuz Subsea Vard Søviknes
13Overview of financial performance indicators(1)
€ mln FY 2015 FY 2016 FY 2017
Order intake 10,087 6,505 8,554
Total backlog 18,721 24,031 26,153
Of which backlog 15,721 18,231 22,053
Of which soft backlog 3,000 5,800 4,100
Revenues 4,183 4,429 5,020
EBITDA (26) 267 341
As a % of revenues -0.6% 6.0% 6.8%
EBIT (137) 157 221
As a % of revenues -3.3% 3.5% 4.4%
Net result before extr. and non recurring items(2) (252) 60 91
Attributable to owners of the parent (141) 66 95
Net result for the period (289) 14 53
Attributable to owners of the parent (175) 25 57
Net fixed assets 1,453 1,590 1,743
Net working capital(3) 251 265 (120)
Of which construction loans (1,103) (678) (624)
Equity 1,266 1,241 1,309
Net financial position Net cash/ (Net debt) (438) (615) (314)
Employees 20,019 19,181 19,545
(1) With the aim to provide a meaningful index to measure the Group financial results, the Group adopts an EBITDA definition which normalizes the trend of results over time, and increases the level of
comparability of the same results by excluding the impact of non recurring and extraordinary operating items; for the same reason, the Group also monitors Net Income before non recurring and extraordinary
items (both operating and financials)
(2) Excluding extraordinary and Non Recurring Items net of tax effect
(3) Construction loans are accounted for in Net working capital, not Net financial position, as they are not general purpose loans and can be a source of financing only in connection with ship contracts
14Order intake and backlog – by segment
Order intake Total backlog(1)
€ mln € mln
1.5x 1.7x 5.4x 5.2x
26,153
24,031
8,554 4,100
573 5,800 1,186
1,418
888
6,505
1,155
664 1,361
1,138
Backlog
22,053
Backlog 20,238
7,526 18,231
16,372
5,191
(488) (433) (657) (789)
FY 2016 FY 2017 FY 2016 FY 2017
Shipbuilding Offshore Equipment, Systems & Services Eliminations
Book-to-bill (Order intake / revenues) Total backlog / revenues Soft backlog(2)
(1) Sum of backlog and soft backlog
(2) Soft backlog represents the value of existing contract options and letters of intent as well as contracts in advanced negotiation, none of which yet reflected in the order backlog
15Backlog deployment
Shipbuilding Offshore
# ships deliveries(1) # ships deliveries
Cruise Naval(2)
2018 5 2018 7 2018 24 8 32
2019 4 2019 4 2019 4 11 15
2020 4 1 5 2020 4 2020
5 2021
2021 1 4 2021 4 1 5 1
2022 1 2 3 2022 5 2022
New orders in FY 2017
• Additional 4 units scheduled after 2022
• 26 vessels • Additional 7 units scheduled after 2022
• 48 vessels
• Deliveries up to 2025, stretching to 2027 in • 32 vessels
case of confirmation of the option for 2 ships • 8 expedition cruise vessels in backlog
for Norwegian Cruise Line • Deliveries up to 2026
(1) Articulated Tug Barge (ATB) is an articulated unit consisting of a barge and a tug, thus being counted as two vessels in one unit
(2) Ships with length > 40 m
16Revenues and EBITDA(1) – by segment
Breakdown by segment(2) EBITDA and EBITDA margin
€ mln € mln
6.0% 6.8%
5,020
4,429 558
495 341
943
22 11.5% 64
960 267
12 1,212 4.4% 42
12.5% 62
1,156
5.3% 51
3,883
3,246 269
2,649 6.9%
2,078 5.7% 185
(272) (364) (31) (34)
FY 2016 FY 2017 FY 2016 FY 2017
Shipbuilding Offshore Equipment, Systems & Services Shipbuilding Offshore Equipment, Systems & Services
Eliminations % Total Other activities(3) % of Revenues
(1) EBITDA is a Non-GAAP Financial Measure. The Company defines EBITDA as profit/(loss) for the period before (i) income taxes, (ii) share of profit/(loss) from equity investments, (iii) income/expense from investments, (iv)
finance costs, (v) finance income, (vi) depreciation and amortization, (vii) wages guarantee fund – Cassa Integrazione Guadagni , (viii) expenses for corporate restructuring, (ix) accruals to provision and cost of legal
services for asbestos claims, (x) other non recurring items
(2) Breakdown calculated on total revenues before eliminations
17Net working capital and net debt(1)
Breakdown by main components Comments
€ mln
FY 2016 FY 2017 • Net working capital and net debt
dynamics related to the production
Inventories and advances to volumes in cruise and the cash-in of
suppliers
the final installments for delivered
Work in progress net of
advances from customers
590 835 cruise ships and the advance
604 payments received on new cruise and
648
naval contracts
Trade receivables
1,123
Other current assets and 909 • Construction loans at € 624 mln (down
liabilities
59 1 € 54 mln vs FY 2016) of which € 574
Construction loans (678) (624)
mln related to VARD and € 50 mln
Trade payables
related to Fincantieri
(1,307)
(1,748) • Most of the Group's debt is related to
Provisions for risks &
charges (126) the financing of current assets
(141) associated with cruise ships
construction and therefore consistent
Net working capital 265 (120)
with net working capital changes
Net debt 615 314
(1) Construction loans are committed working capital financing facilities, treated as part of Net working capital, not in Net financial position, as they are not general purpose loans and can be a
source of financing only in connection with ship contracts
18Section 3 Appendix Historical financial performance
Financial performance
Revenues(1) EBITDA / margins(2)
€ mln € mln
5,020 -0.6% 6.0% 6.8%
558
4,429
341
4,183
495 943
498 11.5% 64
22 267
960
42
4.4%
1,199 12 1,212 12.5% 62
23 1,156 51
5.3%
1,056
3,883
3,246 6.9% 269
2,652 2,649
2,078 5.7% 185
1,573 (26)
8.4% 42
(166) (272) (364) -1.3% (31)
(34) (34)
(3)
-0.2% (31)
FY 2015 FY 2016 FY 2017 FY 2015 FY 2016 FY 2017
Shipbuilding Offshore Equipment, Systems & Services Eliminations Shipbuilding Offshore Equipment, Systems & Services Other activities
Cruise Naval Other Shipbuilding % of Revenues
(1) Breakdown calculated gross of consolidation effects (3) Including the release of orders risk fund referred to the provisions accrued at VARD business combination for expected losses
(2) EBITDA is a Non-GAAP Financial Measure. The Company defines EBITDA as profit/(loss) for the period before (i) income taxes, (ii) share of on construction contracts in Brazil (€ 35 mln in 2014)
profit/(loss) from equity investments, (iii) income/expense from investments, (iv) finance costs, (v) finance income, (vi) depreciation and
amortization, (vii) extraordinary wages guarantee fund – Cassa Integrazione Guadagni Straordinaria, (viii) expenses for corporate restructuring and
other non-recurring personnel costs, (ix) accruals to provision and cost of legal services for asbestos claims, (x) other non recurring items. EBITDA
breakdown are referred only to operating segments
20Financial performance
EBIT / margins Net result before extraordinary and non recurring items(1)
€ mln € mln
91
60
66 95
-3.3% 3.5% 4.4% (6) (4)
(141)
(111)
(252)
FY 2015 FY 2016 FY 2017
221
157 of which Group of which minority interests
€ mln
Net result
53
14
(137) 25 57
(11) (4)
(175)
FY 2015 FY 2016 FY 2017
(114)
(289)
FY 2015 FY 2016 FY 2017
of which Group of which minority interests
(1) Extraordinary and non recurring costs net of tax effect amounted to € 37 mln in 2015, € 46 mln in FY 2016 and € 38 mln in FY 2017
21Capex
Capex evolution Capex by segment
€ mln € mln
3.8% 5.1% 3.2%
224
20
224
8
161 31 163
161 80 163 13
10 27
9
39 55 31
37
165
144
122 108 107
90
FY 2015 FY 2016 FY 2017 FY 2014 FY 2015 FY 2016
Shipbuilding
Property, plant and equipment Intangible assets % of Revenues Offshore
Equipment, Systems & Services
Other activities
• 2015, 2016 and 2017 Capex mainly related to:
‒ Property, plant and equipment - aimed at supporting the development of production volumes and improving safety conditions and compliance with
environmental regulations within the production sites
‒ Intangible assets – mainly related to the development of new technologies for cruise business and IT systems
22Net working capital(1)
Breakdown by main components
€ mln
FY 2015 FY 2016 FY 2017
405
Inventories and advances to
suppliers
590 835
Work in progress net of 1,876 604
advances from customers
648
Trade receivables 1,123
909
560
Other current assets and liabilities 59 1
(196)
Construction loans (678) (624)
(1,103)
Trade payables
(1,307)
(1,748)
Provisions for risks & charges
(1,179)
(126)
(112) (141)
Net working capital 251 265 (120)
(1) Construction loans are committed working capital financing facilities, treated as part of Net working capital, not in Net financial position, as they are not general purpose loans and can be a source
of financing only in connection with ship contracts
23Net financial position(1)
Breakdown by main components
€ mln – Net cash / (Net debt)
FY 2015 FY 2016 FY 2017
Non-current financial receivables
Current financial receivables 113 123
53 115 35
33
260 220 274
Cash & cash equivalents
Short term financial liabilities (263)
(453) (482)
Long term financial liabilities
(601)
(264)
(530)
Net financial position (438) (615) (314)
(1) Net financial position does not account for construction loans as they are not general purpose loans and can be a source of financing only in connection with ship contracts
24Working capital dynamics
Indicative payment terms Main phases of the shipbuilding process(1) Impact on net working capital
Signing A First Cut B Launch C Delivery D
Design / Project Hull Assembly and Outfitting and
Development Pre-Outfitting Sea Trials
• Increases during construction
Cruise
Duration • Impact on net debt
(months) 10-12 10-17 8-12
• 20% during
construction
POC(2) 3%-5% 50%-55% 40%-45%
• 80% on delivery
• Neutral profile
Naval(3) Duration
6-15 23-30 6-10
(months)
• According to %
of completion POC(2) 3%-5% 65%-75% 20%-30%
• Increases during construction
Offshore(3) Duration
3-6 5-26 6-15 • VARD generally uses
(months)
• 20% during
construction loans (guaranteed
construction POC(2)
by the ship as collateral)
3%-5% 35%-40% 55%-60%
• 80% on delivery
(1) Phases and durations may be subject to changes depending on circumstances, regions and vessels specificity, production geographical area and type of construction
(2) Percentage of Completion
(3) Illustrative for frigates and support vessels
25Profit & Loss and Cash flow statement
Profit & Loss statement (€ mln) FY 2015 FY 2016 FY 2017
Revenues 4,183 4,429 5,020
Materials, services and other costs (3,337) (3,291) (3,742)
Personnel costs (865) (846) (909)
(1)
Provisions (7) (25) (28)
EBITDA (26) 267 341
Depreciation, amortization and impairment (111) (110) (120)
EBIT (137) 157 221
(2)
Finance income / (expense) (135) (66) (83)
Income / (expense) from investments (3) (10) (5)
(3)
Income taxes 23 (21) (42)
Net result before extraordinary and non recurring items (252) 60 91
Attributable to owners of the parent (141) 66 95
(4)
Extraordinary and non recurring items (50) (59) (49)
Tax effect on extraordinary and non recurring items 13 13 11
Net result for the period (289) 14 53
Attributable to owners of the parent (175) 25 57
Cash flow statement (€ mln) FY 2015 FY 2016 FY 2017
Beginning cash balance 552 260 220
Cash flow from operating activities (287) 73 532
Cash flow from investing activities (172) (237) (168)
Cash flow from financing activities 167 115 (299)
Net cash flow for the period (292) (49) 65
Exchange rate differences on beginning cash balance - 9 (11)
Ending cash balance 260 220 274
(1) The line “Provisions and impairment” has been modified in “Provisions” and includes provisions and reversal for risks and writedowns. It excludes impairment of Intangible assets and Property, plant and
equipment, which is included in “Depreciation, amortization and impairment” (previously “Depreciation and amortization”). This change had no effect on the comparative information.
(2) Includes interest expense on construction loans for, € 36 mln in FY 2015, €34 mln in FY 2016 and € 24 mln in FY 2017
(3) Excluding tax effect on extraordinary and non recurring items
(4) Extraordinary and non recurring items gross of tax effect
26Net result before extraordinary and non recurring items(1)
Net result before extraordinary and non recurring items (€ mln) FY 2015 FY 2016 FY 2017
A Net result before extraordinary and non recurring items(1) (252) 60 91
Attributable to owners of the parent (141) 66 95
B Extraordinary and non recurring items gross of tax effect (50) (59) (49)
̶ Of which extraordinary wages (3) (1) -
̶ Of which restructuring costs (17) (12) (4)
̶ Of which asbestos claims (30) (27) (39)
̶ Of which other non recurring items - (19) (6)
Tax effect on extraordinary and non recurring items 13 13 11
C
Net result for the period (289) 14 53
A + B + C Attributable to owners of the parent (175) 25 57
• Extraordinary wages - costs related to CIG (Cassa Integrazione Guadagni) for employees in temporary layoff
• Restructuring costs - extraordinary costs, such as severance, related to workforce reduction under the Reorganization Plan in Italy and Vard
• Asbestos claims - provisions or costs for asbestos related to claims by employees
• Other non recurring items - mainly write-downs; in 2016 related to a provision for an ongoing litigation with a Mega Yacht owner
(1) Extraordinary and non recurring items net of tax effect
27Balance sheet
Balance sheet (€ mln) FY 2015 FY 2016 FY 2017
Intangible assets 518 595 582
Property, plant and equipment 974 1,064 1,045
Investments 62 58 53
Other non-current assets and liabilities (44) (69) 122
Employee benefits (57) (58) (59)
Net fixed assets 1,453 1,590 1,743
Inventories and advances 405 590 835
Construction contracts and advances from customers 1,876 604 648
Construction loans (1,103) (678) (624)
Trade receivables 560 1,123 909
Trade payables (1,179) (1,307) (1,748)
Provisions for risks and charges (112) (126) (141)
Other current assets and liabilities (196) 59 1
Net working capital 251 265 (120)
Assets held for sale including related liabilities - 1 -
Net invested capital 1,704 1,856 1,623
Equity attributable to Group 1,137 1,086 1,237
Non-controlling interests in equity 129 155 72
Equity 1,266 1,241 1,309
Cash and cash equivalents (260) (220) (274)
Current financial receivables (53) (33) (35)
Non-current financial receivables (113) (115) (123)
Short term financial liabilities 263 453 482
Long term financial liabilities 601 530 264
Net debt / (Net cash) 438 615 314
Sources of financing 1,704 1,856 1,623
28You can also read