Annex. Sources, main concepts and data treatments - OECD
←
→
Page content transcription
If your browser does not render page correctly, please read the page content below
Annex. Sources, main concepts and data
                      treatments
Different data sources have been mobilised to conduct the analysis in this Policy Brief. In particular, latest
available data and short-term trends are based on the OECD Wealth Distribution Database (WDD), while
longer-term trends (in household over-indebtedness) are based on the Luxembourg Wealth Study.
Moreover, as countries covered by the Eurosystem Household Finance and Consumption Survey (on
which WDD estimates for many EU countries are based) typically rely on the concept of gross (i.e. pre-
tax) income, machine learning methods have been deployed to impute disposable (i.e. after-tax) income
in the HFCS micro-dataset based on information available in the EU Statistics on Income and Living
Conditions (EU-SILC).
To ensure comparability across different sources, the same treatments and concepts have been applied.
In particular:
    •   The indicators shown in the Policy Brief are based on the concept of “household net wealth”, as
        defined in the OECD Guidelines for Micro Statistics on Household Wealth (OECD, 2013[1]), i.e. the
        value of financial and non-financial assets net of the value of liabilities held by private households
        resident in the country. Assets and liabilities are classified based on the nomenclature proposed
        by the OECD Guidelines, which distinguishes between five categories of non-financial assets, eight
        categories of financial assets, and three categories of financial liabilities (see Table 1). Among
        financial assets, assets held in the form of “pension schemes related to employment” are excluded
        from the key wealth measures described in the Policy Brief to improve comparability across
        countries (data on the value of such pensions is available in only a limited number of countries); 1
    •   Most of the indicators refer to the distribution of financial and non-financial assets and liabilities
        across households (rather than across individuals), with no adjustment made to reflect differences
        in household size (which is the convention used by the OECD when analysing the distribution of
        household income). A notable exception relates to the concept of asset poverty, which instead
        refers to individuals and equivalises wealth based on the same equivalence scale applied by the
        OECD to household income (i.e. the square root of household size). Different indicators of asset
        poverty have been proposed in the literature (see Balestra and Tonkin (2018[2]) for a detailed
        discussion), but they all rest on the principle of combining information on household income and
        wealth to consider how long an individual can maintain a given way of life by drawing on their
        accumulated wealth, should their income suddenly fall because of a sudden adverse shock (e.g.
        loss of employment, disability, family disruption). In previous publications, the OECD relied on an
        asset-based poverty measure to identify those individuals belonging to a household with liquid
        financial wealth insufficient to support them at the level of the income poverty line for at least three
        months (i.e. asset poor). Those asset-poor individuals who are not poor in terms of their income
        were described as being financially insecure. For the purposes of Policy Brief, a different asset-
        based poverty measure has been developed and discussed, which identifies lower-income

1
  Assets held in the form of “pension schemes related to employment” are reported in the OECD Wealth Distribution
Database separately and as a supplementary component of household net wealth. For a more detailed discussion of
these pension schemes, refer to Balestra and Tonkin (2018[2]).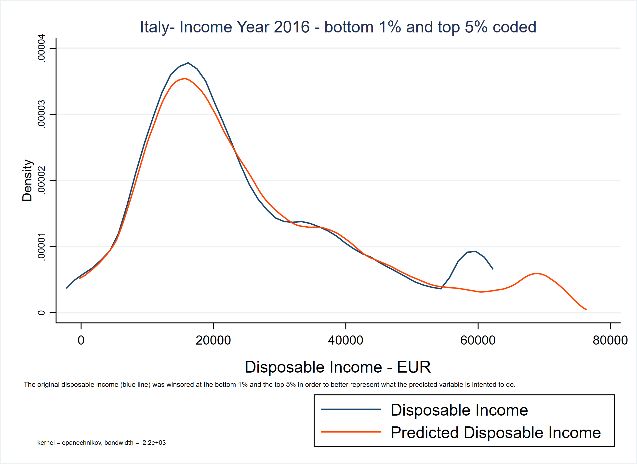
2|

           individuals who lack the financial liquid assets to cover a three-weeks’ loss of income regardless
           of whether they are currently income poor. 2

Table 1. Basic wealth concepts
                                   NF Total non-financial assets = NF1 + NF2 + NF3 + NF4 + NF5
     NF1 Principal residence                Principal residence is the residence where majority of household members live.
      NF2 Other real estate
                                                     Second and holiday homes, investment real estate, farm land
           property
                                     Cars, motorcycles, boats, other vehicles owned by household and used for private purposes.
           NF3 Vehicles
                                                  Vehicles owned by own unincorporated enterprises are excluded.
                                      Works of art, antiques, fine jewelry, stamp and coin collections, precious stones and metals,
          NF4 Valuables
                                                                              other valuables
     NF5 Other non-financial
                                           E.g. other consumer durables, intellectual property, and other non-financial assets.
             assets
         F Total financial assets, excluding pension assets related to employment = F1 + F2 + F3 + F4 + F5 + F6 + F7 + F8

       LF Liquid financial assets (or emergency savings), excluding pension assets related to employment = F1+F2+F3+F5+F7
                                     Currency held (if measured in the survey), transaction accounts, saving accounts, fixed-term
    F1 Currency and deposits
                                                                  deposits, certificates of deposits.
                                    Government savings bonds, corporate bonds, commercial paper, state or municipal non-saving
     F2 Bonds and other debt
                                       bonds, foreign bonds, other non-saving bonds, debenture, mortgage-backed securities,
           securities
                                             negotiable certificates of deposits, treasury bills, other similar instruments
    F3 Mutual funds and other       Mutual funds, hedge funds, unit trusts, income trusts, pooled investment funds, other managed
        investment funds                                                    investment funds
       F4 Net equity in own          Household members’ share of the net equity in unincorporated enterprise in which they work
    unincorporated enterprises                    (sometimes also called “self-employment business wealth”).

            F5 Stocks                                   Listed shares, i.e. shares in publicly listed corporations.

      F6 Unlisted shares and         Unlisted shares (value of ownership in incorporated businesses not publicly traded), net equity
           other equity                     in partnerships in which the household members do not work (“silent partners”).

      F7 Other non-pension            Examples (non-exhaustive): managed accounts, money owed to household, any other non-
         financial assets                                            pension financial asset

    F8 Voluntary individual life       Assets in life insurance and pension plans where participation is voluntary, and individuals
      insurance and private          independently purchase and select material aspects of the arrangements, without intervention
          pension funds                                   of their employers. Does not include term life insurance.
                                                    L Total liabilities = L1 + L2 + L3
      L1 Principal residence              Loans taken for constructing, purchasing and/or improving the principal residence of
              loans                                                           household.
                                     Loans for the purpose of constructing, purchasing or improving other dwellings, buildings and
                                       land (e.g., loans to purchase holiday homes and loans to purchase rental properties for
     L2 Other residence and                                             investment purposes).
        real estate loans
                                      This item excludes liabilities of own unincorporated enterprises, when these are recorded as
                                                                              net value in F4.
                                     Car and other vehicle loans, instalment debt, education loans, other non-mortgage loans from
                                      financial institutions, loans to purchase shares and other financial assets, loans from other
                                     households, credit card debt, lines of credit, bank account overdrafts, other loans not included
          L3 Other loans                                                        in L1 or L2

                                     This item exclude liabilities of own unincorporated enterprise, when these are recorded as net
                                                                                value in F4.
                           = NW Net Wealth (excluding employment related pension funds, i.e. NF + F – L)

2
  Lower-income individuals refer to individuals belonging to households in the bottom 40% of the distribution of
household disposable income.
|3
The OECD Wealth Distribution Database (WDD – via http://oe.cd/wealth)
The OECD relies on a dedicated statistical database, the OECD Wealth Distribution Database (WDD), to
benchmark and monitor wealth inequality across countries. This database is based on national sources
(see Table 2 for an overview of sources and main characteristics) 3 and on set of protocols and statistical
conventions (e.g. on wealth concepts and components) to derive comparable estimates. Estimates
referring to the most recent year (around 2018) are currently available for 29 OECD countries, while
estimates referring to more than two years are available for 19 countries. Countries currently included in
the database are Australia, Austria, Belgium, Canada, Chile, Denmark, Estonia, Finland, France,
Germany, Greece, Hungary, Ireland, Italy, Japan, Korea, Latvia, Lithuania, Luxembourg, the Netherlands,
Norway, New Zealand, Poland, Portugal, the Slovak Republic, Slovenia, Spain, the United Kingdom
(limited to Great Britain) and the United States. For 11 countries, estimates are obtained through a
questionnaire completed by national contact points in National Statistics Offices (and Central Banks) that
regularly collect micro-level information on household wealth; among these, estimates for Australia,
Canada, Chile, Japan, Korea, New Zealand, the United Kingdom and the United States are based on
household surveys, while those for Denmark, the Netherlands and Norway are based on tax and
administrative records. For 18 countries (i.e. those participating in the Eurosystem Household Finance and
Consumption Survey (HFCS) bar the Netherlands), estimates were computed by the OECD based on the
public use file provided by the European Central Bank.
Information on the distribution of household net wealth is broken down by housing status (three groups),
age of the household head (six groups), number of household members (five groups), household type
(six groups), education of the household head (four groups), main source of income (five groups), and
wealth and income quintiles (with additional breakdowns for the top 10%, 5% and 1% of the distribution).
Information is also collected on the share of households holding various types of assets and liabilities; on
the mean value of assets and liabilities for households holding them; on the joint distribution of wealth and
income across household quintiles; and on the extent of over-indebtedness across households (based on
two measures: debt-to-asset ratio above 75%; and debt-to-income ratio exceeding 3). Finally, information
is also available on the share of individuals with liquid financial assets or net wealth below a given
threshold, defined in terms of either the national income poverty line (50% of national income) or the
income of their own household. A top-level overview of the data is available at: http://oe.cd/wealth.
Despite efforts made to ensure common treatments and classifications across countries, the measures
included in the OECD WDD are affected by differences that may limit their comparability. Three of the most
important are:
• Differences between countries in the year when data are collected, ranging between 2016 and
2019, for the most recent year (see Table 2);
• Differences in the degree of oversampling of rich households across countries, which may affect
comparisons of both levels and concentrations of household wealth (see Table 2 and Balestra and
Tonkin (2018[2]) for further details);
• Differences in the income concept recorded: while most wealth surveys provide information on
household disposable income, countries covered by the Eurosystem Household Finance and
Consumption Survey rely on the concept of gross income (with the exception of Italy and Finland,
for which information on disposable income is also available), which limits the cross-country
comparability of estimates of the joint distribution of income and wealth.
3
Additional information is available at http://stats.oecd.org/Index.aspx?DataSetCode=WEALTH.4|
The Eurosystem Household Finance and Consumption Survey (HFCS)
The Eurosystem Household Finance and Consumption Survey (HFCS) is run by the National Central
Banks of the Euro area and coordinated by the European Central Bank. 4 It provides individual household
data collected in a harmonised way in euro-area countries as well as Hungary and Poland. Although the
survey does not refer to the same time period in all countries, the most common reference period for the
latest available data is 2017. The main aim of the HFCS is to gather micro-level structural information on
households’ assets and liabilities, intergenerational transfers and gifts, and consumption and saving,
supplemented by information on socio-demographic characteristics (e.g. labour market status, education,
etc.). As already mentioned, for most countries the HFCS collects information on gross (rather than
disposable) income, which limits the cross-country comparability of WDD estimates that consider income
and wealth jointly. To address this issue, the Policy Brief makes use of novel methods in statistical
matching to impute disposable income from the gross income variable available in the HFCS dataset. To
do so, a predicted distribution of disposable income in each country and year was derived using ensemble
methods of machine learning. The model was trained on the EU Statistics on Income and Living Conditions
(EU-SILC) micro-dataset, which contains reliable information on both disposable and gross income and
for which a large set of socio-demographic variables were harmonised to match those in the HFCS dataset
(Box 1).
Box 1. Predicting disposable income in HFCS
The main challenge of the statistical matching exercise was to find a well-functioning approach that
could allow the predicted disposable income to be a function of the entire gross income distribution and
an array of socio-demographic variables. A machine learning approach was preferred over other viable
options (e.g. hot-deck imputations) not only because it retained better predictive power, but also
because it did not require assumptions about the nature of the relationship between disposable income,
gross income and socio-demographic characteristics.
The machine learning method chosen, called ‘Xgboost’, relies on boosted regression trees. It has
become widely acknowledged for its very good performance, and has recently been used in Blanchet,
Chancel and Gethin (2019[3]) for a very similar matching exercise in which the authors match different
income concepts together in multiple datasets over a relatively long time period.
Similarly to Blanchet, Chancel and Gethin (2019[3]), both the donor (EU-SILC) and recipient (HFCS)
samples were harmonised and the distribution of both gross and disposable income was segmented
into percentiles. As the models are in a Gaussian (or continuous) form, the predicted disposable income
distribution was defined in a continuous space despite the fact that the main predictor, gross income,
was restricted to percentile levels. Other predictors included: household type, marital status, weekly
number of hours worked for the households head and the second household head (when applicable),
labour status, occupation type and variables decomposing individual gross income for both household
heads. Following good practice, first all input variables were standardised, then the model output was
de-standardised by applying the same scaling factor used for standardisation. Cross-validation was
also used to reduce the risk of over-fitting.
The model was built using the SuperLearner package in R. For each country and year, EU-SILC
observations were split into a training (75%) and a testing (25%) sample. The model was then ran
4
The results published in the Policy Brief and the related observations and analysis may not correspond to results or
analysis of the data producers. In particular, in the HFCS self-employment business wealth is classified as a real asset,
while the WDD considers it as a component of financial assets.|5
separately for each country and year, and its performance was assessed on the testing sample. For
those countries where information on disposable income is available in HFCS, i.e. Italy, Finland, the
model’s performance was evaluated by comparing the predicted and the observed distributions.
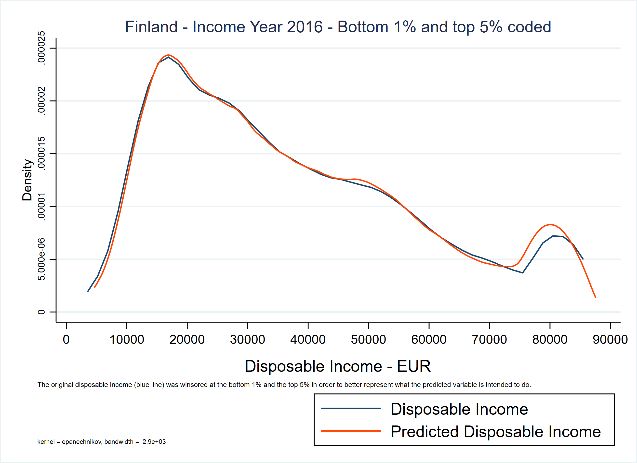
The results from the machine learning model are highly satisfactory. The mean cross-validation
prediction error across years and countries remain between below 8% at the very most, and the mean
squared error on the test sample does not go past 4% of a standard deviation in most countries. As
Figure 1 shows, the model does a good job of predicting the net income of Italian and Finnish
households until about the 95th percentile. This does not represent a major source of concern for the
analysis in the Policy Brief, which focuses on the bottom 40% of the country’s income distribution.
Figure 1. Kernel density plots for observed disposable income and predicted disposable income
(HFCS) for Italy and Finland, 2016
Source: OECD calculations based on EU-SILC (2016) and HFCS (2016).
The Luxembourg Wealth Study (LWS)
The Luxembourg Wealth Study (LWS) is a widely-used semi-harmonised dataset providing individual data
on household wealth, through a remote access procedure. The data were used in Figure 3 to produce
longer-term trends in over-indebtedness for a handful of OECD countries: i.e. Germany, Italy, Spain and
the United Kingdom. LWS estimates for Germany are not directly comparable with those obtained from
the WDD, because they refer to a different data source. For Spain, the ratio of over-indebtedness shown
in Figure 3 refers to gross rather than disposable income, due to the challenge of applying the machine
learning approach described above to the LWS data via a remote access procedure.Table 2. Data sources and characteristics
Sample size Oversampling Effective Imputation
Organisation undertaking Frequency of Years used in the Response
Source (number of of rich oversampling rate for item non-
the survey collection analysis rate
households) households of the top 10%1 response
Survey of Income and Housing Australian Bureau of 2006, 2012, 2014,
Australia Every 2 years ~ 14 000 0.74 No – Yes
(SIH) Statistics 2018
Household Finance and Oesterreichische Every 2 or
Austria 2011, 2014, 2017 ~ 3 000 0.50 Yes – Yes
Consumption Survey (HFCS-AT)3 Nationalbank 3 years
Survey of the Financial Behaviour Every 2 or
Belgium National Bank of Belgium 2010, 2014, 2017 ~ 11 400 0.38 Yes 0.02 Yes
of Households (HFCS-BE)3 3 years
1999, 2005, 2012,
Canada Survey of Financial Security (SFS) Statistics Canada Every 3 years ~ 20 000 0.60 No – Yes
2016,2019
Chile Survey of Household Finances Central Bank of Chile Every 3 years 2011, 2014, 2017 ~4 500 0.55 Yes 0.08 Yes
Denmark Assets and liabilities Statistics Denmark Annual 2015, 2019 – – – – –
Household Finance and Every 2 or
Estonia Eesti Pank 2013, 2017 ~ 2 200 0.73 Yes 0.05 Yes
Consumption Survey (HFCS-EE)2 3 years
Household Finance and Bank of Finland / Statistics Every 2 or
Finland 2009, 2013, 2016 ~ 13 500 0.77 Yes 0.08 Yes
Consumption Survey (HFCS-FN)3 Finland 3 years
Every 2 or
France Enquête Patrimoine (HFCS-FR)3 INSEE 2009, 2014, 2017 ~ 24 000 0.64 Yes 0.20 Yes
3 years
German Panel on Household Every 2 or 3
Germany Deutsche Bundesbank 2011, 2014, 2017 ~ 20 000 0.32 Yes 0.10 Yes
Finances (HFCS-DE)3 years
Household Finance and Every 2 or
Greece Bank of Greece 2009, 2014, 2018 ~ 6 500 0.39 Yes -0.01 Yes
Consumption Survey (HFCS-GR)3 3 years
Hungarian National Bank /
Household Finance and Every 2 or
Hungary Hungarian Central Statistical 2014, 2017 ~ 6 200 0.44 Yes 0.02 Yes
Consumption Survey (HFCS-HU)3 3 years
Office
Household Finance and Central Bank of Ireland / Every 2 or
Ireland 2013, 2018 ~ 5 400 0.39 Yes 0.04 Yes
Consumption Survey (HFCS-IE)3 Central Statistics Office 3 years
Survey of Household Income and Every 2 or 2006, 2008, 2010,
Italy Bank of Italy ~ 15 500 0.50 No – Yes
Wealth (HFCS-IT)3 3 years 2014, 2016
Statistics Bureau, Ministry of
National Survey of Family Income
Japan Internal affairs and Every 5 years 2014 ~50 000 0.96 No – Yes
and Expenditure
communication
Survey of Household Finances
Korea Statistics Korea Annual 2013, 2015, 2019 ~ 20 000 0.90 Yes .. No
(SHF)
Household Finance and Every 2 or
Latvia Latvijas Banka 2014, 2017 ~ 1 200 0.45 Yes 0.09 Yes
Consumption Survey (HFCS-LV)3 3 years|7
Sample size Oversampling Effective Imputation
Organisation undertaking Frequency of Years used in the Response
Source (number of of rich oversampling rate for item non-
the survey collection analysis rate
households) households of the top 10%1 response
Household Finance and Every 2 or
Lithuania Lietuvos Bankas 2018 ~ 1 700 0.45 Yes 0.03 Yes
Consumption Survey (HFCS-LT)3 3 years
Household Finance and Banque Centrale du Every 2 or
Luxembourg 2011, 2014, 2018 ~ 5 000 0.25 Yes 0.10 Yes
Consumption Survey (HFCS-LX)3 Luxembourg 3 years
Netherlands Wealth Statistics Central Bureau of Statistics Annual 2011, 2015, 2019 – – – – –
New Household Economic Survey
Statistics New Zealand Every 3 years 2014, 2018 ~ 5 500 0.76 No – Yes
Zealand (HES)
Norway Income Statistics for Households Statistics Norway Annual 2012, 2014, 2018 – – – – –
National Bank of Poland /
Household Finance and Every 2 or
Poland Central Statistical Office of 2014, 2016 ~ 3 500 0.53 Yes -0.03 Yes
Consumption Survey (HFCS-PL)3 3 years
Poland
Survey on the Financial Situation Banco de Portugal / Every 2 or
Portugal 2010, 2013, 2017 ~ 8 000 0.86 Yes 0.07 Yes
of Households (HFCS-PG)3 Statistics Portugal 3 years
Slovak Household Finance and Every 2 or
Národná banka Slovenska 2010, 2014, 2017 ~ 2 000 0.56 Yes 0.02 Yes
Republic Consumption Survey (HFCS-SK)3 3 years
Household Finance and Every 2 or
Slovenia Banka Slovenije 2014, 2017 ~ 2 500 0.38 Yes -0.04 Yes
Consumption Survey (HFCS-SI)3 3 years
Financial Survey of Households Every 2 or
Spain Banco de España 2012, 2014, 2018 ~ 6 500 0.57 Yes 0.13 Yes
(HFCS-ES)3 3 years
United 2007, 2009, 2011,
Wealth and Assets Survey (WAS) Office for National Statistics Every 2 years ~ 18 000 0.63 Yes 0.06 Yes
Kingdom2 2013, 2015, 2017
United Survey of Consumer Finances Board of Governors of 2007, 2010, 2013,
Every 3 years ~ 6 000 0.60 Yes 0.16 Yes
States (SCF) the Federal Reserve System 2016, 2019
Note: “..” means “not available”; “-” means “does not apply”. Data for ‘around 2018’ refer to: 2014 for Japan; 2016 for Finland, Italy and Poland; 2017 for Austria, Belgium, Chile, Estonia, France, Germany,
Hungary, Latvia, Portugal, the Slovak Republic, Slovenia and the United Kingdom; 2018 for Australia, Greece, Ireland, Luxembourg, New Zealand and Norway; 2019 for Canada, Denmark, Korea, the
Netherlands and the United States. Data for ‘around 2010’ refer to: 2009 Finland, Greece and the United Kingdom; 2010 for Belgium, France, Italy, Portugal, the Slovak Republic and the United States;
2011 for Austria, Chile, Germany, Luxembourg and the Netherlands.
1. The effective oversampling rate is calculated as (S90 – 10)/100, where S90 is the share of sample households in the wealthiest 10%. If the share of rich households in the sample is exactly 10%, then
the effective oversampling rate of the top 10% is 0. If the share of households in the wealthiest decile is 20%, then the effective oversampling rate is 0.10. An effective negative oversampling rate indicates
that the share of sample households in the top wealth quintile is smaller than 10%.
2. Data on the United Kingdom are limited to Great Britain.
3. These national sources are part of the Eurosystem Household Finance and Consumption Survey conducted by the Household Finance and Consumption Network.
Source: OECD Wealth Distribution Database, oe.cd/wealth.References Balestra, C. and R. Tonkin (2018), “Inequalities in household wealth across OECD [2] countries: Evidence from the OECD Wealth Distribution Database”, OECD Statistics Working Papers, No. 2018/01, OECD Publishing, Paris, https://dx.doi.org/10.1787/7e1bf673-en. Blanchet, T., L. Chancel and A. Gethin (2019), “How Unequal Is Europe? Evidence from [3] Distributional National Accounts, 1980–2017”, WID.world Working Paper Series April. OECD (2013), OECD Guidelines for Micro Statistics on Household Wealth, OECD Publishing, [1] Paris, https://dx.doi.org/10.1787/9789264194878-en.
You can also read