ERASMUS+ IMPLEMENTATION SURVEY RESULTS 2018 - Lifelong Learning ...
←
→
Page content transcription
If your browser does not render page correctly, please read the page content below

ERASMUS+ IMPLEMENTATION SURVEY RESULTS 2018
2   LIFELONG LEARNING PLATFORM - ERASMUS+ IMPLEMENTATION SURVEY RESULTS 2018

                                                                                                A considerable 32% of respondents consider they spent too much time in preparing
          GENERAL RESULTS                                                                       their application, while another 63% consider it rather time-consuming. This is broadly
                                                                                                consistent with findings from previous years. This shows that for many organisations
                                                                                                responding to the survey - who in large part already have many years of experience
Following the success of the Erasmus+         as a success story for EU citizens.               with the programme - there remains much room for simplification.
implementation surveys from previous years,
the Lifelong Learning Platform ran its 2018   The survey targeted only European level           Just slightly more than half of the respondents (52%) report encountering some kind of
Erasmus+ Implementation Survey from 27        organisations and collected a total of 41         bureaucratic or administrative difficulty with the implementation of a project, again
August to 15 October last year.               responses from European networks. The             very similar to observations from previous years.
                                              number of responses appears reduced
The purpose of this year’s survey was to      compared to previous years because the
                                                                                                While respondents are largely satisfied with the relevance and extensiveness of
evaluate the experience of beneficiaries      2018 survey adopted an even more targeted
                                                                                                the Programme Guide, a significant proportion (66%) remain doubtful or are only
in the fifth round of applications for the    approach - focusing on European level
                                                                                                moderately satisfied about its user-friendliness.
Erasmus+ programme and in particular the      organisations exclusively in order to gain
perspective of EU-wide networks with long-    views from stakeholders with a high-level of
standing experience of EU funding. This       expertise and representing a large number of      Funding remains a problematic issue, with a considerable 73% of respondents finding
survey seeks to provide decision-makers with  beneficiaries across the EU and at different      it is insufficient to cover their real needs. This is up from 49% last year which - given the
an evaluation from direct beneficiaries on    levels (local, regional, national), as the vast   profile of respondents this year as exclusively European-level organisations - appears
what is working well, what could be improved  majority of them have 5 or more years of          to show that the latter’s needs are insufficiently addressed by the funding available.
and what is lacking in the programme, and     experience working with Erasmus+ and its
thus provide useful reflections for the futurepredecessor programme.                            A majority of respondents (73%) think that Erasmus+ objectives and actions are well
of the programme. The Lifelong Learning                                                         aligned with policy priorities in their field of work, which can be considered a positive
Platform hopes that the survey results will Concerning the main results of the 2018             sign about the programme’s relevance.
guide decision-makers in finding solutions to survey, these include:
improve the programme considered by many                                                        Slightly more than half (55%) think that the programme allows them to implement
                                                                                                cross-sector cooperation projects - this indicates some room for improvement given
                                                                                                the widely acknowledged value of cross-sector cooperation.
      78% of respondents have 5 or more years of experience working with Erasmus+ and/
      or the previous Lifelong Learning Programme, which shows their views are based in a       Respondents express a generally good level of satisfaction with the evaluation
      deep understanding of the overall programme.                                              process, particularly feedback on completed projects, although as in previous years
                                                                                                dissatisfaction is expressed concerning generic feedback on rejected applications, as
                                                                                                well as contradictory comments in the same evaluation report and respective scores.
      For respondents, their organisation’s own membership is identified as the most
      common way to find project partners or build a consortium (87%), followed by EU
      networks/organisations (51%). This shows that EU networks tend to partner with their      Future priorities for the programme identified by respondents are, as in previous
      own members in projects, thus demonstrating commitment to support their work and          years, social inclusion and citizenship education - followed by promotion of lifelong
      draw from their expertise on the ground. This can also translate into an additional       learning, synergies between formal and non-formal education, amongst others.
      difficulty for newcomers in accessing the programme if they are not part of these
      established networks.                                                                     A considerable number of respondents (58%) do not think the overall
                                                                                                financial support for the programme is sufficient to meet its objectives.
4   LIFELONG LEARNING PLATFORM - ERASMUS+ IMPLEMENTATION SURVEY RESULTS 2018                              LIFELONG LEARNING PLATFORM - ERASMUS+ IMPLEMENTATION SURVEY RESULTS 2018             5

           PROFILE OF RESPONDENTS                                                                   Respondents’ experience with Erasmus+ and/or previous Lifelong Learning Programme

                                                                                                    As the chart below depicts, vast majority of respondents (78.05%) have 5 and more years
                                                                                                    of experience with Erasmus+ and/or previous Lifelong Learning Programme. This suggests
Type of organisation                                                                                that many responses are based on a strong familiarity with how the programme operates.
                                                                                                    The percentage of newcomers (not applied yet but planning to) is at 2.44%, which makes it
Of the 41 answers received, the respondents are evenly divided between European non-profit          lower than last year (9.23%). Number of respondents with 1-4 years of experience remains
organisations (46.34%) and European-wide network civil society organisations (46.34%) and           the same as last year.
a few European wide networks. This year, local and national organisation did not take part in
the Erasmus+ survey.

                                                                                                    Respondents’ role in Erasmus+ and/or previous Lifelong Learning Programme

                                                                                                    The majority of respondents have experience both as coordinator and partner (70.73%),
Field of specialisation                                                                             showing a diversity of experience. 19.51% declared they have experience only as coordinator,
                                                                                                    while 7.32% have experience only as partner. Last year, 15.38% respondents declare they
Majority of respondents specialise in the non-formal education sector (53.66%), followed by         have experience only as coordinator, while 20.00% have experience only as partner.
equally divided between youth sector and vocational education and training (both 39.02),
higher education (26.83%), citizenship education (21.95%), school education (17.07%),
professional higher education (12.20%), and teacher education (7.32%). In comparison to
last year’s findings the results differ, particularly in terms of non-formal education (last year
30.77%) and youth (last year 26.15%). Specialisation in sports and early childhood education
remain lowest (both 4.88%).

                                                                                                    Respondents receiving operating grant from Erasmus+

                                                                                                    As is shown in the picture below, a majority of respondents (63.41%) receive an operating
                                                                                                    grant from Erasmus+ programme. 31.71% state that they do not receive an operating grant
                                                                                                    from the programme, while 4.88% state that they are planning to apply for an operating grant.
6   LIFELONG LEARNING PLATFORM - ERASMUS+ IMPLEMENTATION SURVEY RESULTS 2018                              LIFELONG LEARNING PLATFORM - ERASMUS+ IMPLEMENTATION SURVEY RESULTS 2018              7

           GENERAL INFORMATION                                                                      Success rate for respondents applying in 2017

                                                                                                    With approximately same results as in last year’s survey, findings show that high proportion
                                                                                                    of respondents applied successfully in last year’s Erasmus+ Calls for Proposals (74.36%). This
Application for 2017-18 Erasmus+ Calls for proposals                                                very high success rate shows that the respondents of our survey are on the whole experienced
                                                                                                    users of the Erasmus+ programme.
The majority of respondents (87,18%) applied for 2017-18 Erasmus+Calls for Proposals, while
12.82% indicated they did not apply.                                                                Building consortia

                                                                                                    As the chart below shows, the most common way to build consortium or find project partners
Key Action(s) to which respondents applied                                                          for 87.18% of respondents is through their own membership. Broadly similar to last year,
                                                                                                    the proportion of respondents building consortium or finding project partners through
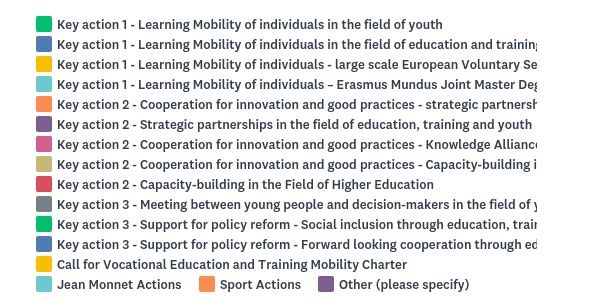
Key Action 2 - Strategic partnerships in the field of education, training and youth (48.72%) and    EU networks/organisations stands at 51.28% and for regular partners at 48.72%. The high
Key Action 1 - Learning mobility of individuals in the field of youth (35.90%). Last year, survey   percentage for own membership this year shows that EU networks clearly tend to partner
respondents’ highest number of applications went to Key Action 1 (24%) and Key Action 3             with their own members in projects, thus demonstrating commitment to support their
– Support for policy reform – Forward looking cooperation through education, training and           work and draw from their expertise on the ground.
youth (12%).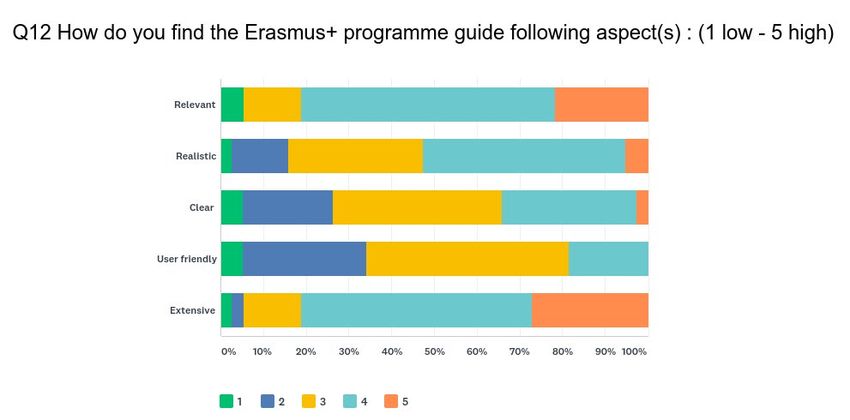
8   LIFELONG LEARNING PLATFORM - ERASMUS+ IMPLEMENTATION SURVEY RESULTS 2018                            LIFELONG LEARNING PLATFORM - ERASMUS+ IMPLEMENTATION SURVEY RESULTS 2018               9

          APPLICATION PROCESS                                                                    National Agencies and EACEA support to applicants

                                                                                                 There is a reasonably good level of satisfaction with the support provided by National
                                                                                                 Agencies and EACEA in the application process, with 78.95% of respondents stating that this
                                                                                                 was sufficient. Those replying that it was not sufficient nevertheless reach a substantial figure
Geographical coverage                                                                            (21.05%), so there clearly remains room for improvement. The comments from respondents
                                                                                                 also emphasised that the sufficiency of supports varies from one NA to another.
Regarding the countries where the survey respondents applied for Erasmus+, Belgium is the
country with the most applications (44.74%), because of mostly Brussels-based European           Application forms
networks. Member state receiving second highest number of applications is France (23.68%).
42.11% of respondents submitted their application to the Executive Agency (EACEA) for            Respondents were asked to rate a number of descriptions of the Erasmus+ application
civil society cooperation, and 34.21% for other centralised calls. As the results indicate, a    forms, with 1 being the lowest score and 5 being the highest. The responses suggest that
centralised solution at EU level for European networks would help to resolve the given           the application forms are rather reliable and comprehensive with the scores of 4 in these
situation as currently they have to compete with local Belgian organisations.                    categories exceeding 40%. However, they are considered coherent and, particularly, user-
                                                                                                 friendly to a lesser extent. Indeed, a score of 3 or less is awarded by 72.97% of respondents
Erasmus+ programme user guide                                                                    for user-friendliness, which, while not a bad performance per se, suggests potential for
                                                                                                 improvement. An additional factor to bear in mind is that, although the overall scores appear
Respondents were asked to rate a number of descriptions of the Erasmus+ programme guide,         somewhat satisfactory, this can also be understood as the perception of highly experienced
with 1 being the lowest score and 5 being the highest. As shown by the graph below, the          applicants who, year by year, get more familiar with the application process.
relevance of the guide is particularly appreciated, as the percentage of respondents providing
a score of 4 reaches 59.46% and 5 reaches 21.62%. However, respondents doubt that the            Individual parts of application form
guide is user-friendly, as this receives a score of 4 from only 18.42% of them, while none of
the respondents mark it 5. Moreover, there is still room for improvement of the clarity of the   Respondents were asked about the level of difficulty of the different parts of the application
guide as this receives a score of 4-5 from only 34.21% of respondents. Moreover, 81.08% give     process, with 1 being the least difficult and 5 being the most difficult. The graph below
a score of 4 or 5 indicating that the extensiveness of the programme guide is appreciated.       suggests that the partners’ description is the most straightforward phase of the application
                                                                                                 with 59.46% awarding a score less than 3, with project management also reaching 40.54% in
                                                                                                 that score range (so a low level of difficulty). However, the responses giving a score of more
                                                                                                 than 3 (so a high level of difficulty) were at 40-50% for the other parts of the application of
                                                                                                 the application procedure – which indicates that there is still much room for improvement
                                                                                                 when it comes to simplifying them.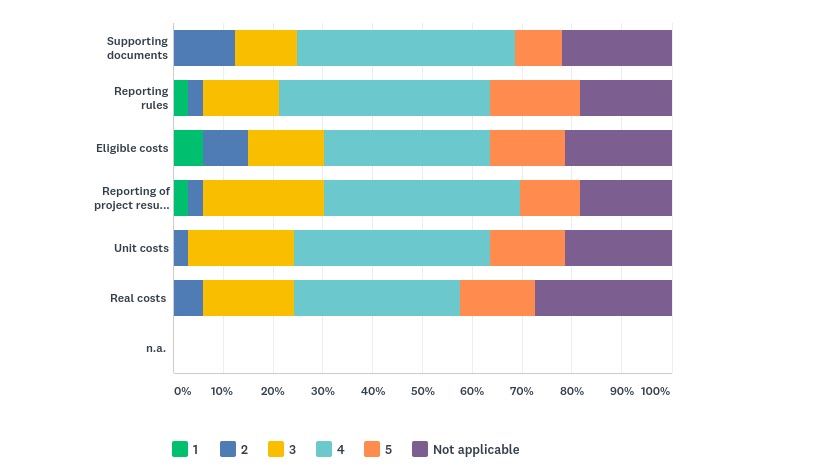
10   LIFELONG LEARNING PLATFORM - ERASMUS+ IMPLEMENTATION SURVEY RESULTS 2018                              LIFELONG LEARNING PLATFORM - ERASMUS+ IMPLEMENTATION SURVEY RESULTS 2018               11

                                                                                                     Time commitment to preparing applications

                                                                                                     A substantial proportion (31.58%) of respondents feel that it took them too much to
                                                                                                     prepare the application, while another 63.16% still consider it rather time-consuming.
                                                                                                     Although it is understandable that the process of making an application involves a certain
                                                                                                     time commitment, this data shows that for many organisations responding to the survey,
                                                                                                     who in large part already have many years of experience with the programme, the project
                                                                                                     application could be considerably simplified. Moreover, the results are largely consistent with
                                                                                                     last year’s findings, where 36% of respondents found that it took them too much time to
                                                                                                     prepare the application and another 50% considered it rather time-consuming.

Application stages

Here respondents were asked to rate the different aspects of the application stage according
to their level of difficulty, with 1 being the least difficult and 5 being the most difficult. The
responses indicate that the level of difficulty is approximately similar in all aspects of the
application stage - across all 30-40% of respondents provide a score higher than 3, suggesting
that they are rather complex overall.
                                                                                                                IMPLEMENTATION
                                                                                                     Administrative burden

                                                                                                     Respondents were asked about administrative hurdles in the process of project
                                                                                                     implementation. Just slightly over half of the respondents (51.52%) encountered some kind
                                                                                                     of bureaucratic difficulty in implementing a project. While implementation is unlikely to ever
                                                                                                     be a completely smooth process, the high percentage reporting difficulties is nevertheless
                                                                                                     striking. In their comments respondents mention the administrative problems encountered
                                                                                                     in the case of National Agencies, reporting that in some cases different agencies have different
                                                                                                     interpretation of the same rules.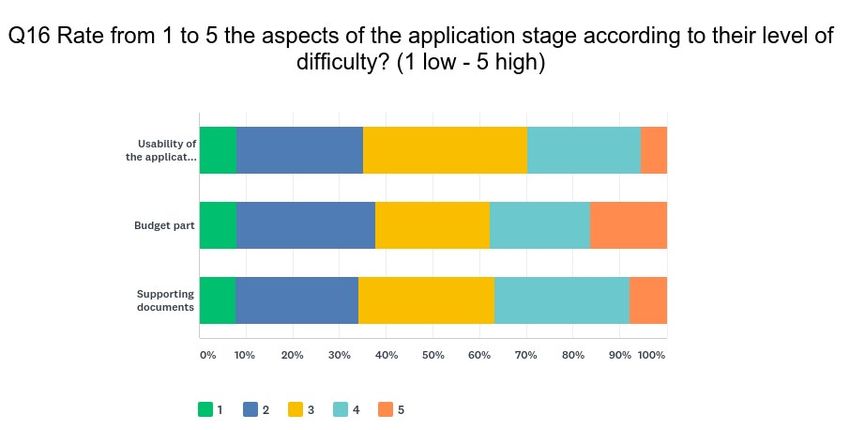
12   LIFELONG LEARNING PLATFORM - ERASMUS+ IMPLEMENTATION SURVEY RESULTS 2018                                LIFELONG LEARNING PLATFORM - ERASMUS+ IMPLEMENTATION SURVEY RESULTS 2018                  13

Budget                                                                                                Administrative and financial handbook

Unlike last year’s survey results for this question which were equally distributed between yes        Respondents were asked about their ease of understanding of the administrative and financial
(51%) and no (49%), the results below are striking in the fact that a majority (72.73%) are           handbook, with a score of 1 being the lowest and a score of 5 being the highest. A score of 4
mostly dissatisfied with the funding provided to cover the real needs, while only 27.27% find         was given by no less than 30% of respondents in all aspects (supporting documents, reporting
the funding sufficient. Given the profile of respondents this year as exclusively European-           rules, eligible costs, reporting of project results, unit costs, real costs), while a score of 5 was
level organisations - this result appears to show that the latter’s needs are insufficiently          given by 10-20% for all. Overall, the ratings suggest that there is still room for improvement,
addressed by the funding available.                                                                   particularly when it comes to the parts on eligible costs and reporting of project results - both
                                                                                                      received a score of 3 or less from 30.3% of respondents, indicating only moderate to low level
Centralised management                                                                                of understanding.

A majority (60%) of respondents give a positive assessment of EACEA’s implementation and
management of centralised actions. However, the figure of 40% giving a negative response
remains rather significant, so there is clear room for improvement.

Lump sum system

The graph below shows that survey respondents mostly consider the lump sum system
suitable and simplified. However, only 24.24% consider it being accurate and 21.21% find
it sufficient, while 36.36% stated they find it insufficient. This year’s results are a little more
striking that last year when 25.64% found it sufficient, while 21.09% found it insufficient.

                                                                                                      Procedures for project implementation

                                                                                                      The chart below indicates that a considerable proportion of respondents finds the procedures
                                                                                                      for project implementation (kick-off, reporting, closing) at NA level moderately clear (score of
                                                                                                      3 from 33.33%), while the top rating of 5 was nevertheless provided by 18.18%. The diversity
                                                                                                      of responses across the score range could be attributed to the differences in National Agencies
                                                                                                      depending on the country. A majority of respondents rate positively the clarity of procedures
                                                                                                      at EACEA level (48.48% provide a score higher than 3).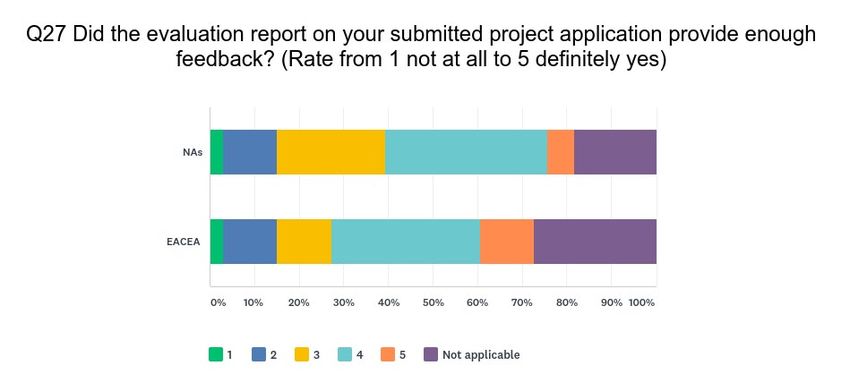
14   LIFELONG LEARNING PLATFORM - ERASMUS+ IMPLEMENTATION SURVEY RESULTS 2018                             LIFELONG LEARNING PLATFORM - ERASMUS+ IMPLEMENTATION SURVEY RESULTS 2018              15

                                                                                                    Implementation of cross-sector cooperation

                                                                                                    Just over half of the respondents (54.55%) find that Erasmus+ allows them to implement cross-
                                                                                                    sector cooperation projects, while the remainder expressed the opposite. It is necessary to
                                                                                                    note even though some respondents provided a positive answer, they added that the pressure
                                                                                                    of having tangible results is often too high and that there is not enough time to prepare
                                                                                                    outputs. Some respondents stated that evaluators often lack the cross-sector experience to
                                                                                                    truly enable cross-sector cooperation, while a few others stated that cross-sector cooperation
                                                                                                    is difficult to do. A particular observation was that non profit organisations cannot apply for
                                                                                                    KA1 teacher mobility. The results are not very satisfying overall considering the benefits of
                                                                                                    cross-sector cooperation and the fact that the programme is supposed to facilitate this.

                                                                                                               EVALUATION PROCESS
           PROGRAMME RELEVANCE                                                                      Feedback on project applications

                                                                                                    Respondents were asked for their opinion about the sufficiency of the feedback that they
Programme objectives and policy priorities                                                          were given on their project application, if applicable. For the National Agencies, the results
                                                                                                    indicate that the feedback received was considered above average for a large number of of
Responses here reveal that the majority of respondents (72.73%) believe that the objectives         respondents (42.42% providing a score of 4 or higher), although the figure of 39.39% for
and actions of the Erasmus+ programme are well aligned with policy priorities in their field of     scores in the range 1-3 nevertheless indicates space for improvement. For EACEA, the findings
work. While a little lower in comparison to last year (89.74%), this remains a generally positive   also indicate that the feedback on project applications can be considered rather satisfactory
sign about the relevance of the programme to the main concerns of its stakeholders. Some            overall, with around 45.5% of responses awarding a score higher than 3.
respondents nevertheless commented that there is a high rigidity on rules. Some specific
observations were not enough focus on learners of all ages and not enough space for social
inclusion beyond the topic of migrants/refugees.

Social dimension of the programme

The programme’s positive consideration of individuals’ socio-economic needs and the needs
of different learners was assessed as lower this year (48.48%) in comparison to last year
(74.36%). The results clearly indicate room for improvement on social inclusion. Some stated
that students/participants with disabilities encounter disproportionate difficulties, lack of
consideration of adult learners, and it has been added that access needs should be fully
covered. One respondent pointed out that the programme does not take into account socio-
economic needs of education providers who lack resources to become active in European
projects.
16   LIFELONG LEARNING PLATFORM - ERASMUS+ IMPLEMENTATION SURVEY RESULTS 2018                              LIFELONG LEARNING PLATFORM - ERASMUS+ IMPLEMENTATION SURVEY RESULTS 2018                17

Feedback on completed projects                                                                      Financial support

Feedback concerning the evaluation report on completed projects is given a rating higher            Concerning the views of respondents on the sufficiency of funding, a striking 58.06% do not
than 3 by 63.63% of respondents, which indicates a high level of satisfaction.                      think the overall financial support is sufficient to meet the programme objectives, while only
                                                                                                    12.90% think it is. These figures are more striking than the results of last year’s survey (40%
Main reason for dissatisfaction                                                                     found the funding not sufficient). Indeed, the fact that only around one tenth of respondents
                                                                                                    consider the overall funding sufficient is a cause for concern, especially for a programme
Among the points raised, respondents suggest administrative burden, the length of the report,       which is so in demand and promoted by both the EU and Member States as a success story
very generic comments, and that evaluators sometimes are not really flexible in understanding       for European citizens.
some changes put in place in the implementation of projects. The point was also raised that
some evaluation reports are clearly a summary that is copy-pasting the evaluation of two
different evaluators and that this leads to contradictory statements within the reports (e.g. one
evaluator stating dissemination is very strong and in the following paragraph dissemination
is highly criticised). The effort to streamline reports by National Agencies could be improved.
They added that often feedback is thus not very useful for the purpose of re-application.

           FUTURE PROGRAMME
Priorities for future programme                                                                     Synergies with other programmes

Concerning what the priorities of the Erasmus+ successor programme should be, respondents           An impressive number of respondents (80.65%) are in favour of developing closer synergies
mention a variety of issues but there are some common points. The strongest priority is by          between Erasmus+ programme and other EU programmes. This resonates with the ongoing
far social inclusion, particularly the need to give students from disadvantaged backgrounds         discourse at EU level about the need to foster closer synergies between programmes under
the possibility to undertake a period of mobility. Citizenship education is another area which      the next EU Multiannual Financial Framework. The programmes suggested for synergies with
many respondents feel the next programme could focus on, in other words, helping people to          Erasmus+ were: ESF, Rights and Values Programme/Europe for Citizens, Horizon2020, AMIF. It
participate in democratic life and learn how to live together. Both resemble last year’s survey     was observed that some simplification and access to a broader range of organisations would
findings. This year respondents also placed emphasis on the promotion of lifelong learning,         be required to make such synergies a success. In terms of how they could work in practice
synergies between formal and non-formal education, and people’s mobility.                           some suggestions were: identification of common goals and target groups, cooperation
                                                                                                    meetings between project coordinators (and ideally partners), active exchange during all
Structure of the programme                                                                          project phases in order to arrive at a common dissemination strategy (linked websites or
                                                                                                    even a joint one); all this could lead to the organisation of joint trainings or creation of joint
As per improvement of programme’s structure, although largely satisfied some of the responses       platforms holding all developed materials/tools organised by topic and/or target group.
indicated the need for simplifying the application, flexibility, ensuring budget allocation based
on demands of beneficiaries, and more equality between the sectors. Another suggestion
was that there should be more scope for non-formal learning and mobility opportunities for
people of all ages, particularly volunteers.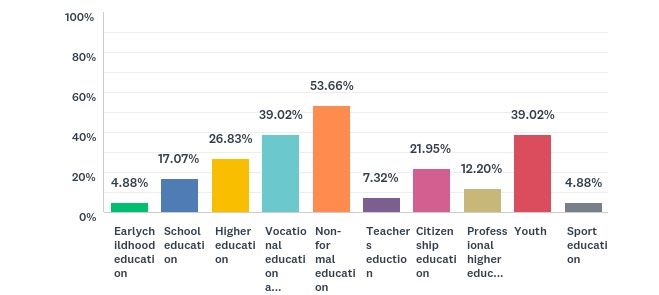
18   LIFELONG LEARNING PLATFORM - ERASMUS+ IMPLEMENTATION SURVEY RESULTS 2018

          CONCLUSIONS
From the above findings the Lifelong Learning Platform gathers the following conclusions on   Support for EU networks
how to enhance the implementation of the Erasmus+ programme for the remaining period
2019-2020:                                                                                    Provide a centralised solution for EU networks for project applications - the vast
                                                                                              majority are based in Brussels and must compete with local Belgian organisations
                                                                                              when applying to the Belgian National Agencies.

                                                                                              Further support the role of EU networks in strengthening their members’
      User-friendliness                                                                       engagement in the programme.

      Continue and intensify efforts to simplify all aspects of the application procedure
      and reduce bureaucracy, including more user-friendly application forms.
                                                                                                   Budget
      Provide a clear Programme Guide written in a more user-friendly language - this
      could be achieved, for example, by avoiding or at least clearly explaining jargon            Increase lump sum funding to better meet the real needs of beneficiaries.
      such as “intellectual output” or “exploitation”.
                                                                                                   Allocate a higher overall budget to the future programme so that it has sufficient
                                                                                                   resources to meet its objectives.
                                                                         Evaluation

Enhance the reliability of feedback by making the evaluation process more
transparent; checking consistency throughout evaluation reports and scoring                                                                 Priorities for future programme
system; and improving overall training process for evaluators - with more
harmonised standards across National Agencies - to ensure quality, actionable                 Enhance the social dimension of the programme by better addressing the needs
feedback.                                                                                     of learners from disadvantaged backgrounds.

                                                                                              Strengthen the programme’s support for citizenship education.

      Cross-sector cooperation                                                                Pursue synergies between Erasmus+ programme and other sectoral programmes
                                                                                              - yet in the spirit of enhancing access to a broader audience and keeping the
      Further incentivise and facilitate the implementation of projects engaging several      administrative burden low.
      sectors, including non-formal education. This also requires evaluators to have a
      broader understanding of cross-sector cooperation in order to better evaluate
      such projects.
The Lifelong Learning Platform is an umbrella association that gathers 42 European organisations
active in the field of education and training, coming from all EU Member States and beyond.
Currently these networks represent more than 50 000 educational institutions (schools, universities,
adult education and youth centres, etc.) or associations (involving students, teachers and trainers,
parents, HRD professionals, etc.) covering all sectors of formal, non-formal and informal learning.
Their members reach out to several millions of beneficiaries.
Lifelong Learning Platform
Rue de l’Industrie, 10 – 1000 Brussels – Belgium
Tel. : 02 893 25 15
info@lllplatform.euYou can also read


