9M 2020 RESULTS AND OUTLOOK - MID & SMALL IN MILAN 2020 3 DECEMBER 2020 - eMarket Storage

Page created by Janice Molina
 
CONTINUE READING
9M 2020 RESULTS AND OUTLOOK - MID & SMALL IN MILAN 2020 3 DECEMBER 2020 - eMarket Storage
MID & SMALL IN MILAN 2020
          3 DECEMBER 2020

9M 2020 RESULTS AND OUTLOOK
9M 2020 RESULTS AND OUTLOOK - MID & SMALL IN MILAN 2020 3 DECEMBER 2020 - eMarket Storage
SECTOR UPDATE AND
                  MARKET DYNAMICS

Genoa Boat Show
9M 2020 RESULTS AND OUTLOOK - MID & SMALL IN MILAN 2020 3 DECEMBER 2020 - eMarket Storage
INDUSTRY PLAYERS REPORT STRONG PERFORMANCES

                                                                                                                          1/12/2020                                     US posts second highest monthly boat sales in 10 years | News | International Boat Industry

                                                                                                                              Can Covid growth be sustained and retained?
                                                                                                                                         IBI Premium Content, by Tony Esposito | November 16, 2020

                                                                                                                              More than 44,000 new boaters entered the US market in 2020 as part of a general turn to the outdoors
                                                                                                                              brought about by the Covid-19 pandemic. But who are these new enthusiasts and – more importantly,
                                                                                                                              some would ask – is there a way to avoid the inevitable churn of rst-time participants away from
                                                                                                                              boating?

                                                                                                                              Data from the Outdoor Foundation indicate that fewer than half of Americans have even a single outdoor
                                                                                                                              recreation experience in a given year, but in May of 2020, 81% had gotten outside at least once and had

                                                                                                                            US  posts second highest monthly boat sales in 10 years
                                                                                                                            planned a second outing. The majority were rst-time recreationists.
                                                                                                                          1/12/2020                                  US posts second highest monthly boat sales in 10 years | News | International Boat Industry

                                                                                                                             The
                                                                                                                            IBI
                                                                                                                            We     increases,
                                                                                                                                Premium
                                                                                                                                 use cookies tonot
                                                                                                                                        Content, bysurprisingly,
                                                                                                                                                    Arlene
                                                                                                                                                allow      Sloan
                                                                                                                                                       us and    |span the
                                                                                                                                                                   November
                                                                                                                                                               selected    range  of improve
                                                                                                                                                                            17, 2020
                                                                                                                                                                        partners  to outdoor your
                                                                                                                                                                                             segments.
                                                                                                                                                                                                  experience and our advertising. By
                                                                                                                            continuing to browse our site you consent to our use of cookies as per our Privacy and Cookie Policy
                                                                                                                              The National Marine Manufacturers Association (NMMA) has reported a 10% jump in rst-time new boat
                                                                                                                            which
                                                                                                                            After aalso
                                                                                                                                    briefexplains
                                                                                                                                           respitehow  to change
                                                                                                                                                   in July       your preferences.
                                                                                                                                                           and August, US new boat sales took off again in September, nearly beating the
                                                                                                                              buyers in 2020, the rst time in a decade that number has increased year-over-year.
                                                                                                                            highest monthly sales in more than a decade.
                                                                                                                              Similarly, the number of people camping for the rst time increased 26%, according to the Recreational
1/12/2020                              US dealer group OneWater posts record sales | News | International Boat Industry       Vehicle Industry Association (RVIA) and fully 20% were returning to camping after anThe
                                                                                                                                                                                                                   extended
                                                                                                                                                                                                                       latest absence.
                                                                                                                                                                                                                              data
                                                                                                                                                                                                                                                                   shows new
                                                                                                                              Across any number of outdoor recreation segments there have been noticeable increases in rst-time and
                                                                                                                                                                                                                                                                   powerboat retail
                                                                                                                              returning participants, as well as women, ethnic minorities and people of a younger average age.
                                                                                                                                                                                                                                                                   sales in the US
                                                                                                                                                                                                                   roared
                                                                                                                              “It’s something the industry has been focusing on for so many years and it’s been really    back to
                                                                                                                                                                                                                       amazing  in see
                                                                                                                                                                                                                                   to
                                                                                                                                                                                                              high-gear
                                                                                                                              those numbers change and to see more people get outdoors,” said Outdoor Roundtable        in director
                                                                                                                                                                                                                 executive

                                                                                                                            US posts second highest monthly boat sales in 10 yearsSeptember after a
                                                                                                                           https://www.ibinews.com/market-intelligence/can-covid-growth-be-sustained-and-retained/37649.article?utm_medium=email&utm_campaign=Weekly IBI Daily Ne…      1/5
                                                                                                                                                                                                                                                                   brief slow-down in
                                                                                                                            IBI Premium Content, by Arlene Sloan | November 17, 2020
                                                                                                                                                                                                                                                                   July and August,
                                                                                                                                                                                                                                                                   following record
                                                                                                                            After a brief respite in July and August, US new boat sales took off again in September, nearly beating the
                                                                                                                            growth in June.
                                                                                                                            highest monthly sales in more than a decade.
  US dealer group OneWater posts record sales
  IBI Premium Content, by Arlene Sloan | November 19, 2020                                                                  According to America’s National Marine Manufacturers Association (NMMA), new boat sales were up 22%
                                                                                                                                                                                                          The latest data
                                                                                                                            in September compared to August and up 9% year-to-date compared to 2019. Relative to the same
                                                                                                                                                                                                          shows new
  OneWater Marine – one of America’s largest boat retailers – topped $1 billion in sales for the rst time;                  month last year, September posted a 22% leap in new boat sales on a seasonally-adjusted basis –
                                                                                                                                                                                                          powerboat retail
  the company also expanded its reach in Florida with another acquisition                                                   making it the second highest single-month total of new powerboats sold in more than a decade.      3
                                                                                                                                                                                                          sales in the US
9M 2020 RESULTS AND OUTLOOK - MID & SMALL IN MILAN 2020 3 DECEMBER 2020 - eMarket Storage
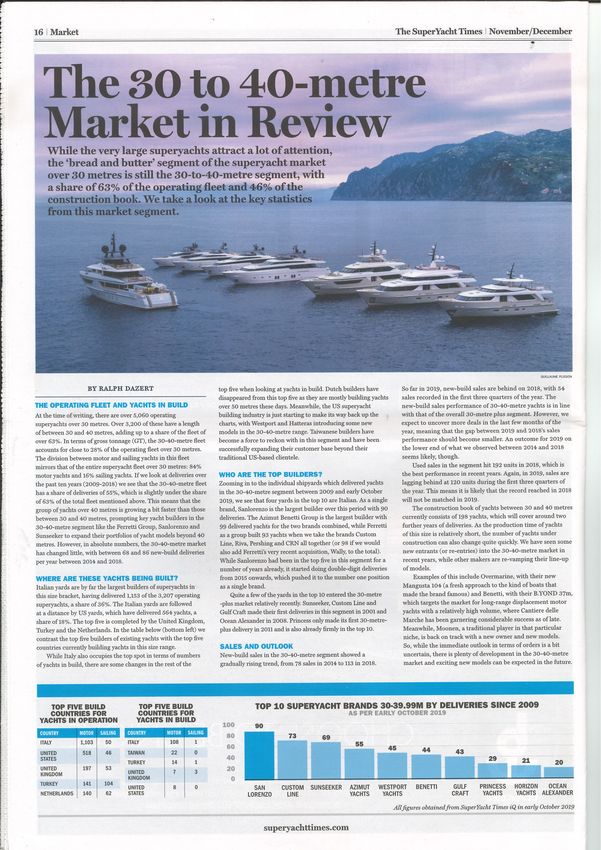
POSITIVE OUTLOOK FOR THE ITALIAN YACHTING SECTOR

                                                   4
9M 2020 RESULTS AND OUTLOOK - MID & SMALL IN MILAN 2020 3 DECEMBER 2020 - eMarket Storage
ITALIAN YACHTING SECTOR PERFORMANCE REMAINS POSITIVE

                  ITALIAN YACHTING SECTOR: 2010-2019 TURNOVER

                                                                5
9M 2020 RESULTS AND OUTLOOK - MID & SMALL IN MILAN 2020 3 DECEMBER 2020 - eMarket Storage
ITALIAN YACHTING SECTOR PERFORMANCE REMAINS POSITIVE

                                                                                        NUMBER OF PROJECTS 2010-2020, YACHTS >24M

                                 900                                                                                                                                                          60%
                                                                                                                                                                   830
                                                                                                                                                                                807
                                 800           763                                                                                       760         773
                                                               749                                                          754
                                                                           728                     735         734                                                                            50%
                                                  50%                                  692
                                 700                                                                                                                                              49%
                                                                                                                                                      46%            46%
                                 600                                        44%                                                                                                               40%
                                                                                                                                             43%
                                                                41%
                                                                                        39%
                                                                                                    37%                       38%
                                 500                                                                             37%
                                                                                                                                                                                              30%
                                                                                                                                                                                      398
                                                       383                                                                                                               379
                                 400                                                                                                                       353
                                                                                 317                                                           323
                                                                     309
                                                                                             272         274                      284
                                 300                                                                                 269                                                                      20%

                                 200
                                                                                                                                                                                              10%
                                 100

                                     0                                                                                                                                                        0%
                                                 2010           2011        2012        2013        2014        2015          2016           2017     2018          2019          2020

                                                      Number of projects worldwide                  Number of projects of Italian builders                   % projects of Italian builders

Source: Global Order Book 2020, Boat International.
                                                                                                                                                                                                    6
9M 2020 RESULTS AND OUTLOOK - MID & SMALL IN MILAN 2020 3 DECEMBER 2020 - eMarket Storage
CREATING A PERFECT YACHT    INTRODUCTION TO
        IS A JOURNEY           SANLORENZO
WE WILL BE MAKING TOGETHER
9M 2020 RESULTS AND OUTLOOK - MID & SMALL IN MILAN 2020 3 DECEMBER 2020 - eMarket Storage
SOLID LEADERSHIP IN LUXURY YACHTING
                               ONE BRAND, MULTIPLE SEGMENTS                                                                                                FIRST BRAND DELIVERING 30-40MT YACHTS OVER 2009 -2019

                THE ONLY COMPANY COMPETING ACROSS A WIDE ARRAYS OF                                                               PREMIUM PRICE       CUMULATIVE 2009-2019
                                                                                                                                                     (THE SUPERYACHT TIMES – NOVEMBER 2019)
                                                                                                                                  POSITIONING1
                          SEGMENT, WITH ONE SINGLE BRAND

                                                     EXPLORER
                                                  SANLORENZO
                                                      EXP LINE
                                                                                                                               HIGHER SECOND HAND
                                                                                                                   CROSSOVER
           NAVETTA                                                                                                              VALUE RESILIENCY2
     BENETTI CLASSIC                                         FLYBRIDGE                                     (NO COMPETITION)
       CUSTOM LINE                                               AZIMUT                            SANLORENZO SX LINE
 SANLORENZO SD LINE                                        CUSTOM LINE
                                                        FERRETTI YACHTS
                                                           MOCHI CRAFT
                                                               PRINCESS
                                                                    RIVA
                                                             SUNSEEKER
                                                     SANLORENZO SL LINE
    STEEL NAVETTA                                                                                                               UNIQUE “MADE TO
          MOONEN                                                                                                               MEASURE” PHILOSOPHY
     CANTIERI DELLE
           MARCHE                                                                                SUPERYACHT                     ALSO IN COMPOSITE
SANLORENZO ESPACE                                                                                    FEADSHIP
               LINE                                                                                     AMELS                        YACHTS
                                                                                                      LURSSEN
                                                                                                       HEESEN
                                                                                                       BENETTI
                                              SPORT COUPE’                                              PERINI
                                                MANGUSTA                                            BAGLIETTO
                                                  PERSHING                                                 CRN
                                                   PRINCESS                                 SANLORENZO ALLOY
                                                       RIVA                                    AND STEEL LINES                   THE ONLY BRAND
                                                 SUNSEEKER
                                         SANLORENZO SP LINE                                                                       LEADING BOTH
                                                                                                                                    SEGMENTS

       Source: Company information and Management assessment.
       1 Official retail price Sanlorenzo vs. competitors based on official 2019 retail price as of August 2019.                                                                                           8
       2 Source: Superyacht Times – August 2019.
9M 2020 RESULTS AND OUTLOOK - MID & SMALL IN MILAN 2020 3 DECEMBER 2020 - eMarket Storage
PROVEN RESILIENCE OVER THE CYCLE

                                VoP (rebased to 100)                                            2008 - 2014

                                                                           Global Boating Market1 Decrease: (41%)

                                                                                                                                                                                                                             ’06–’19 Growth: +404%2

                                                                                                                                                                                                                   ABOVE MARKET GROWTH PAIRED
                                                                                                                                                                                                                   WITH DISTINCTIVE RESILIENCE
                                                                                                                                                                                                                   ACROSS INDUSTRY CYCLES
                                                                                                                                                                                                                   TESTIMONY OF SANLORENZO
                                                                                                                                                                                                                   SUPERIOR BUSINESS MODEL

                                                                                                                         Growth: +5%

                                                                                                                                                                                                                             ’06–’19 Growth: +24%3
                                                                                                                  Decrease: (
                                                                                                                                    -36%)
                                                                                                                                       Dec re                                                                               ’06–’19 Decrease: (-9%)4,5
                                                                                                                                              ase
                                                                                                                                        (-69% :
                                                                                                                                               )

                                       ’06A
                                      2006         ’07A
                                                  2007          ’08A
                                                               2008          ’09A
                                                                            2009         ’10A
                                                                                        2010          ’11A
                                                                                                     2011         ’12A
                                                                                                                 2012          ’13A
                                                                                                                              2013         ’14A
                                                                                                                                          2014          ’15A
                                                                                                                                                       2015          ’16A
                                                                                                                                                                    2016         ’18A
                                                                                                                                                                                2017          ’17A
                                                                                                                                                                                             2018        ’19A
                                                                                                                                                                                                         2019

Source: Company information, management assessment, consolidated annual reports and Deloitte.
1 Source: Deloitte Boating Market Monitor. The new boating market does not include the personal watercrafts and other small boats less than 2.5 meters. The figures consider the revised estimates of National Marine Manufacturers Association (NMMA) and adjustment in the historical exchange rate.
2 Based on consolidated accounts as per Italian GAAP until 2015, then according to IFRS . Fiscal year ending December 31.
3 Based on consolidated accounts as per Italian GAAP. Fiscal year ending August 31.
4 Based on consolidated accounts as per IFRS. Fiscal year ending August 31 until 2012, then ending December 31.
5 2006-2008 figures including Pinmar and Apremare (~€65m revenues), then disposed in 2010.
                                                                                                                                                                                                                                                                                                         9
9M 2020 RESULTS AND OUTLOOK - MID & SMALL IN MILAN 2020 3 DECEMBER 2020 - eMarket Storage
SUPERIOR BUSINESS MODEL
                                                                                    ~50 YACHTS PER YEAR

                                                                                    SOPHISTICATED CUSTOMERS, «CONNOISSEURS», «SANLORENZO CLUB», ~900 OWNERS
                                                                                    BELONGING TO THE WORLD’S WEALTHIEST FAMILIES

                                                                                    RIGOROUSLY «MADE TO MEASURE»

                                                                                    TIMELESS DESIGN WITH THE UTMOST CARE FOR DETAILS

                                                                                    FLEXIBLE COST STRUCTURE, ~2,0501-UNIT WORK FORCE, ~500 DIRECT VS. ~1,550
                                                                                    INDEPENDENT SPECIALIZED ARTISANS

                                                                                    UNIQUE DIRECT DISTRIBUTION, BRAND REPRESENTATIVE NETWORK, MOSTLY MONOBRAND2

                                                                                    INDUSTRY LEADER FOR INNOVATION WITH TRADITION (40ALLOY, 52STEEL, EXPLORER, SX LINE,
                                                                                    SL102 ASYMMETRIC)

                                                                                    STRONG BOND WITH ART AND DESIGN (MILAN DESIGN WEEK, ART BASEL, ARCHISTARS:
                                                                                    DORDONI, URQUIOLA, LISSONI, PAWSON, LIAGRE)

                                                                                    EXPERIENCED AND PASSIONATE MANAGEMENT TEAM (MORE THAN 20 MANAGERS WITH TOTAL
                                                                                    COMBINED ~600 YEARS OF EXPERIENCE)

Source: Company filings.
1 As of H1 2020.
2 Companies distributing Sanlorenzo’s products with mono-brand approach even in co-presence of other third –party yachts.                                                 10
SOLID GROWTH         FINANCIAL RESULTS
                          AND OUTLOOK
AND STEADY RESILIENCY
FINANCIAL HIGHLIGHTS 2016-2019
                 NET REVENUES NEW YACHTS                                   ADJUSTED EBITDA                            GROUP NET INCOME
(€M)                                                        (€M)                                       (€M)

                                                                                                 66
                                                      456                                                                                      27

                                              327
                                                                                       38
        222                     231                                 30       29                                                     12
                                                                                                               12         10

       2016                 2017              2018   2019          2016     2017      2018      2019          2016      2017       2018       2019

                                      CAPEX                               NET WORKING CAPITAL                        NET FINANCIAL POSITION
(€M)                                                        (€M)                                       (€M)

                                                                                                              41
                                                                   55                                                    36
                                                      51                     52
                                              46
                                                                                                                                    23

                                18                                                     17
                                                                                                12                                             9
          9

       2016                 2017              2018   2019          2016     2017      2018      2019          2016      2017       2018       2019

 Source: Company information.

                                                                                                                                                     12
SOLID 9M RESULTS, CONFIRMED RESILIENCE
                                                n   ALL FACILITIES IN FULL OPERATION ALSO DURING THE MONTH OF
                                                    AUGUST IN ORDER TO ACHIEVE FULL RECOVERY BY END OF THE YEAR
                                                    AND ALL YACHT DELIVERIES CARRIED OUT AS PLANNED

                                                n   MARKETING AND COMMERCIAL INITIATIVES SUPPORTING 2021 ORDER
                                                    INTAKE PROMOTED DURING SEPTEMBER AND OCTOBER:
                                                    n   GENOA BOAT SHOW REGULARLY HELD FROM 1 TO 6 OCTOBER WITH THE
                                                        PRESENTATION OF THE NEW SX112 AND BGX60 MODELS

                                                    n   “SANLORENZO ELITE WEEKENDS” WITH STRONG ATTENDANCE

                                                n   SANLORENZO BUSINESS MODEL ONCE AGAIN PROVING RESILIENT
                                                    THROUGHOUT THE CYCLE
PROTOTYPE 44ALLOY
                                                    n   ORDER BACKLOG EQUAL TO €670M, UP BY €105M IN Q3 2020 (+18%) IN THE
                                                        ABSENCE OF BOAT SHOWS IN SEPTEMBER

                                                    n   LOYAL CUSTOMER BASE BELONGING TO THE WEALTHIEST FAMILIES LESS IMPACTED BY
                                                        ECONOMIC DOWNTURN (“SL CUSTOMER CLUB”)

                                                    n   APPROX. 90% OF ORDER BACKLOG COVERED BY FINAL CLIENTS

                                                n   SOLID 9M 2020 RESULTS, DESPITE SIGNIFICANT IMPACT OF COVID-19
                                                    ON MARKET ACROSS GEOGRAPHIES AND INDUSTRIES

                                                    n   TOP LINE AND OPERATING MARGINS RESILIENCE
                                                    n   SIGNIFICANT NET DEBT REDUCTION COMPARED TO 30 JUNE 2020

                                                n   2020 EXPECTED RESULTS CONFIRMED IN LINE WITH 2019
PROTOTYPE 62STEEL
 Source: Company information
                                                                                                                                    13
9M 2020 FINANCIAL HIGHLIGHTS

                           COMMENTARY                                                                                 NET REVENUES NEW YACHTS1                                                                     ADJUSTED EBITDA2
                                                                                          (€M)                                                                                                       (€M)
n      RESILIENCE OF NET REVENUES                                                                                                               0%                                                                       0%
       NEW YACHTS NOTWITHSTANDING
       THE IMPACT OF COVID-19:                                                                                                                                                                                49                           49
                                                                                                                                                                                                     50
       STABLE AT CONSTANT PERIMETER1                                                                                   323                                               323
                                                                                                                                                                                                     40
                                                                                                                                                                                                             15%                         15%
                                                                                                                                                                                                     30
n      ADJUSTED EBITDA2 AT                                   €49M,
                                                                                                                                                                                                     20
       IN LINE WITH 9M 2019
                                                                                                                                                                                                     10

n      GROUP NET INCOME AT €22M                                                                                                                                                                       0                                                             0
                                                                                                                                                                                                            9M 2019                   9M 2020
       IMPACTED BY HIGHER D&A AND
       COVID-19 RELATED COSTS
                                                                                                                                                                                                                   GROUP NET INCOME
n      SUBSTANTIALLY STABLE                                                                                                                                                                          (€M)
       PROFITABILITY MARGINS ON NET                                                                                                                                                                                      -8%
       REVENUES NEW YACHTS
                                                                                                                                                                                                     30
        n   ADJUSTED EBITDA MARGIN AT                                                                                                                                                                         24
                                                                                                                                                                                                                                           22
                                                                                                                                                                                                     25
            15% (+0.4% VS 9M 2019)                                                                                                                                                                   20
                                                                                                                                                                                                             7%
                                                                                                                                                                                                     15                                  7%
        n   GROUP NET INCOME MARGIN AT                                                                                                                                                               10
            7% (-0.4% VS 9M 2019)                                                                                                                                                                     5
                                                                                                                                                                                                      0                                                             0
                                                                                                                  9M 2019                                           9M 2020                                 9M 2019                   9M 2020
Source: Company’s information.
1      For 9M 20219, excluding GP Yachts contribution (€7.7m), sold in July 2019, and the provision of maintenance and other services (€2.5) which in 2020 has been recognised in a separate item.
2      Defined as EBIT + D&A. In 9M 2020 excludes €1.1m million costs related to 2020 Stock Option Plan, and COVID-19 related costs.                                                                                    MARGIN (AS % OF NET REVENUES NEW YACHTS )
                                                                                                                                                                                                                                                                14
FOCUS ON NET REVENUES NEW YACHTS
                              COMMENTARY                                                                                NET REVENUES NEW YACHTS1                                                                   BREAKDOWN BY DIVISION

n        9M 2020 NET REVENUES NEW                                                                                                               0%
         YACHTS AT €323M: STABLE VS                                                                                                                                                                                       BLUEGAME
         9M 2019 AT CONSTANT                                                                                                                                                                                               6%
         PERIMETER1                                                                                                    323                                               323
                                                                                                                                                                                                     SUPERYACHT
                                                                                                                                                                                                                   31%
n        BREAKDOWN BY DIVISION
                                                                                                                                                                                                                                     63%   YACHT
          n        YACHT -3% VS 9M 2019

          n        SUPERYACHT -6% VS 9M 2019

          n        BLUEGAME +76% VS 9M 2019                                                                                                                                                                       BREAKDOWN BY GEOGRAPHY
n        BREAKDOWN BY GEOGRAPHY
                                                                                                                                                                                                                          MEA
          n        EUROPE -9% VS 9M 2019
                                                                                                                                                                                                                           9%
          n        APAC +22 VS 9M 2019                                                                                                                                                                 AMERICAS
                                                                                                                                                                                                                    14%
          n        AMERICAS STABLE VS 9M 2019
                                                                                                                                                                                                                                     58%
                                                                                                                                                                                                         APAC       19%                    EUROPE
          n        MEA -10% VS 9M 2019

                                                                                                                  9M 2019                                           9M 2020

Source: Company’s information.
1      For 9M 20219, excluding GP Yachts contribution (€7.7m), sold in July 2019, and the provision of maintenance and other services (€2.5) which in 2020 has been recognised in a separate item.

                                                                                                                                                                                                                                                    15
FOCUS ON PROFITABILITY

                                 COMMENTARY                                                                                       ADJUSTED EBITDA1                              EBIT
n        STABLE ADJUSTED EBITDA AT €49M                                                     (€M)
                                                                                                                                        0%                                     -12%
         AND INCREASE IN MARGIN ON NET
         REVENUES NEW YACHTS (15%, +0.4%
                                                                                              50                           49                        49
         VS 9M 2019) NOTWITHSTANDING THE                                                                                                                             38
                                                                                                                                                              40                                  33
         IMPACT OF COVID-19, MAINLY DRIVEN
                                                                                              45                                                              30
         BY:                                                                                                                                                        11%
                                                                                                                                                 15%          20
         n        HIGHER SELLING PRICES                                                       40                                                                                                10%
                                                                                                                       15%
                                                                                                                                                              10
         n        INCREASED EFFICIENCY THANKS TO
                                                                                              35                                                               0                                                           0
                  FULLY OPERATIONAL NEW                                                                                                                            9M 2019                   9M 2020
                  PRODUCTION CAPACITY                                                         30
n        EBIT MARGIN IN REDUCTION VS 9M
         2019 REFLECTING D&A INCREASE                                                         25                                                                          GROUP NET INCOME
         CONNECTED TO INDUSTRIAL CAPEX
                                                                                              20                                                                                -8%
n        GROUP NET INCOME MARGIN AT 7%
         (-0.4% VS 9M 2019)                                                                   15                                                              30
                                                                                                                                                                     24
n        FINANCIAL EXPENSES DECREASED                                                                                                                         25                                  22
                                                                                              10                                                              20
         (-46.2%), REFLECTING LOWER                                                                                                                                 7%
                                                                                                                                                              15                                7%
         INDEBTEDNESS AND IMPROVED BANK                                                         5                                                             10
         CONDITIONS                                                                                                                                            5
                                                                                                0                                                         0    0                                                           0
                                                                                                                     9M 2019                   9M 2020             9M 2019                   9M 2020
                                                                                                                                                                               MARGIN (AS % OF NET REVENUES NEW YACHTS )
Source: Company’s information.
1      Defined as EBIT + D&A. In 9M 2020 excludes €1.1m million costs related to 2020 Stock Option Plan, and COVID-19 related costs..
                                                                                                                                                                                                                       16
ORDER BACKLOG AS OF 30 SEPTEMBER 2020
                            COMMENTARY                                       ORDER BACKLOG COMPOSITION AS OF 30 SEPTEMBER 2020
                                             (€M)
n       ORDER BACKLOG EQUAL TO                                                 +51%
        €670M AS OF 30 SEPTEMBER
        2020, +18% VERSUS 30 JUNE                                                          +18%
        2020, THANKS TO €104M
        NEW CONTRACTS IN Q3 2020                                    +27%                                                         CORRESPONDING TO APPROX.
                                                                                                      670          440           98% OF 2020E NET REVENUES
        (OF WHICH €53M RELATING TO                                                                                               NEW YACHTS OUTLOOK
        2021) IN THE ABSENCE OF
        BOAT SHOWS IN SEPTEMBER                                                566

         n        OF WHICH ABOUT 90%
                                                        444
                  COVERED BY FINAL CLIENTS

         n        OF WHICH €440M
                  RELATING TO 2020 (+13%
                  VERSUS H1 2020)                                                                                                        230

n       ORDER INTAKE SUPPORTED BY A
        PLAN OF TARGETED MARKETING
        AND COMMERCIAL ACTIONS IN
        PLACE FROM SEPTEMBER 2020

                                                    TOTAL BACKLOG          TOTAL BACKLOG          TOTAL BACKLOG    2020             2021 & BEYOND
                                                     31 DEC 2019            30 JUN 2020            30 SEP 2020

Source: Company’s information.
                                                                                                                                                             17
NET FINANCIAL POSITION AND LIQUIDITY

                                     COMMENTARY                                         NET FINANCIAL POSITION
                                                         (€M)
n        NET FINANCIAL POSITION DOWN TO €5M
        n        FROM €24M AS OF 30 JUNE 2020, THANKS
                 TO YACHT DELIVERIES IN Q3                         87

        n        FROM €87M AS OF 30 SEPTEMBER 2019
                 MAINLY THANKS TO IPO PRIMARY PROCEEDS

n        NET DEBT EVOLUTION FROM 31 DECEMBER 2019
         FIGURES CONSISTENT WITH BUSINESS SEASONALITY                                           61

n        9M 2020 CASH & CASH EQUIVALENTS EQUAL
         TO €101M VS €81M AS OF 30 JUNE 2020

n        UNDRAWN CREDIT LINES EQUAL TO €118M AS OF
         30 SEPTEMBER 2020, SIGNIFICANTLY INCREASED
         VS 30 JUNE 2020 THANKS TO NEW AGREEMENTS
         WITH PRIMARY FINANCIAL INSTITUTIONS AND
                                                                                                                    24
         LOWER UTILISATION

                                                                               9
                                                                                                                                5

                                                                30-Sep-19   31-Dec-19        31-Mar-20           30-Jun-20   30-Sep-20

    Source: Company’s information.                                                                                                       18
MULTIPLE LEVERS FOR PROFITABLE GROWTH
                FOCUS ON PRODUCT RANGE EXPANSION
     NEW SX112 PRESENTED AT GENOA BOAT SHOW                              NEW BGX60 PRESENTED AT GENOA BOAT SHOW

                                                 NEW RANGES PIPELINE

                                                                                            A STUNNING MOTORYACHT
                                                                                       WHICH INCIDENTALLY HAS TWO HULLS.
                                                                                               PLEASE BE PATIENT…

SP OPEN COUPE’ LINE (YACHT)                   ESPACE LINE (SUPERYACHT)                          BGM (BLUEGAME)

                                                                                                                           19
SANLORENZO 2020 OUTLOOK CONFIRMED

n   SANLORENZO’S MANAGEMENT CONFIRMS 2020E NET REVENUES FROM NEW YACHTS AND EBITDA IN LINE WITH 2019

    n   SUCH OUTLOOK REFLECTS CURRENT BACKDROP AND DOES NOT ENVISAGE NEW MATERIAL LOCKDOWNS OR DISRUPTIONS
        COMPARABLE TO THOSE EXPERIENCED IN MARCH/APRIL 2020

n   ORDER INTAKE IS SUPPORTED BY A PLAN OF TARGETED MARKETING AND COMMERCIAL ACTIONS IN PLACE FROM
    SEPTEMBER 2020 (“SANLORENZO ELITE WEEKENDS”, PRIVATE BOAT SHOWS IN SANLORENZO SHIPYARDS IN LA SPEZIA AND
    FOLLOW-UP TO THE CONTACTS ESTABLISHED DURING GENOA BOAT SHOW)

                                                                                                               20
YOUR VISION, OUR CRAFT           APPENDIX
             STRONG HERITAGE
                IN LINE WITH
           ITS LOYAL CUSTOMERS
INCOME STATEMENT
           (€’000)                                                            Nine months ending as at 30 September                                          Change
                                                                               % Net Revenues                           % Net Revenues
                                                             2020                                      2019                                  2020 vs. 2019        2020 vs. 2019%
                                                                                 New Yachts                               New Yachts
           Net Revenues New Yachts                              322,623                  100.0%             333,537              100.0%              (10,914)                -3.3%
           Net revenues from pre-owned boats,
                                                                    42,728                13.2%               19,619               5.9%               23,109              +117.8%
           maintenance and other services
           Other income                                              2,632                 0.8%                  731               0.2%                1,901              +260.1%

           Operating costs                                     (319,462)                 (99.0%)          (305,247)              (91.5%)             (14,215)               +4.7%

           Adjusted EBITDA                                          48,521                15.0%               48,640              14.6%                 (119)                -0.2%

           Non-recurring costs                                      (1,098)               (0.3%)                    -                    -            (1,098)                      -

           EBITDA                                                   47,423                14.7%               48,640              14.6%               (1,217)                -2.5%

           Depreciation and amortisation                        (14,314)                  (4.4%)           (10,985)               (3.3%)              (3,329)              +30.3%

           EBIT                                                     33,109                10.3%               37,655              11.3%               (4,546)              -12.1%

           Net financial expense                                    (1,578)               (0.5%)              (2,932)             (0.9%)               1,354                -46.2%

           Adjustments to financial assets                              33                 0.0%                (291)              (0.1%)                 324              -111.3%

           Pre-tax profit                                           31,564                 9.8%               34,432              10.3%               (2,868)                -8.3%

           Income taxes                                             (9,435)               (2.9%)           (10,100)               (3.0%)                 665                 -6.6%

           Net profit                                               22,129                 6.9%               24,332               7.3%               (2,203)                -9.1%
           Net profit/loss attributable to non-controlling
                                                                       197                 0.1%                  (17)             (0.0%)                 214             -1,258.8%
           interests
           Group net profit                                         22,326                 6.9%               24,315               7.3%               (1,989)                -8.2%

Source: Company information
Consolidated Figures

                                                                                                                                                                                       22
BALANCE SHEET
          (€’000)                                                  30 September           31 December                               Change
                                                                      2020                   2019                 2020 vs. 2019              2020 vs. 2019%
          USES
          Goodwill                                                                8,667                  8,667                         -                      -
          Intangible assets with a finite useful life                          34,898                   35,404                    (506)                   -1.4%
          Property, plant and equipment                                       106,100                102,598                      3,502                   +3.4%
          Other equity investments and other non-current assets                     409                    379                       30                   +7.9%
          Net deferred tax assets                                                 2,723                  3,008                    (285)                   -9.5%
          Non-current employee benefits                                           (908)                  (796)                    (112)                  +14.1%
          Non-current provisions for risks and charges                            (982)                  (913)                      (69)                  +7.6%
          Net fixed capital                                                   150,907                148,347                      2,560                   +1.7%
          Inventories                                                          93,151                   62,311                30,840                     +49.5%
          Trade receivables                                                    16,193                   20,269                (4,076)                    -20.1%
          Contract assets                                                     104,018                   87,889                16,129                     +18.4%
          Trade payables                                                     (124,449)              (152,189)                 27,740                     -18.2%
          Contract liabilities                                                (59,570)               (19,442)                (40,128)                   +206.4%
          Other current assets                                                 32,268                   46,007               (13,739)                    -29.9%
          Current provisions for risks and charges                             (8,438)                  (9,299)                     861                   -9.3%
          Other current liabilities                                           (25,584)               (23,999)                 (1,585)                     +6.6%
          Net working capital                                                  27,589                   11,547                16,042                    +138.9%
          NET INVESTED CAPITAL                                                178,496                159,894                      18,608                 +11.6%

          SOURCES
          Net financial position                                                  5,088                  9,063               (3,975)                     -43.9%
          Equity                                                             173,408                 150,831                  22,577                    +15.0%
          TOTAL SOURCES                                                      178,496                 159,894                  18,602                    +11.6%

Source: Company information
Consolidated Figures

                                                                                                                                                                  23
CASH FLOW STATEMENT AND NET FINANCIAL POSITION
                                        CASH FLOW STATEMENT                                                                 NET FINANCIAL POSITION

        (€’000)                                       30 September 2020 30 September 2019   (€’000)                                 30 September 2020       31 December 2019

        EBITDA                                                   47,423            48,640   Cash and cash equivalents                        (100,876)                (60,186)
        Taxes paid                                              (3,859)           (4,891)   Other liquid assets                                         -                      -

        Changes in inventories                                 (30,840)          (44,737)   Securities held for trading                                 -                      -
        Changes in net contract assets and                                                  Cash                                             (100,876)                (60,186)
                                                                 23,999           (6,651)
        liabilities
        Changes in trade receivables and advances                                           Current financial receivables                        (674)                 (6,654)
                                                                  3,932            13,400
        to suppliers
        Changes in trade payables                              (27,740)            32,633   Current bank payables                                1,290                    370
        Changes in provisions for risk and charges,
                                                                  9,473           (3,650)   Current portion of debt                             33,374                 17,394
        allowances and other assets and liabilities
        Operating cash flow                                      22,388            34,744   Other current financial payables                     5,658                  1,530

        Capital expenditures                                   (17,333)          (27,352)   Current financial debt                              40,322                 19,294

        Business combinations (Enterprise Value)                      -          (17,116)   Net current financial debt                        (61,228)                (47,546)

        Free cash flow                                            5,055           (9,724)
                                                                                            Non-current bank payables                           64,100                 54,706
        Net financial charges                                   (1,545)           (2,932)
                                                                                            Bonds issued                                                -                      -
        Change in NFP due to operations under
                                                                                 (52,500)
        joint control                                                                       Other non-current payables                           2,216                  1.903
        Other changes                                              464              1,209
                                                                                            Non-current financial debt                          66,316                 56,609
        Change in net financial position                          3,975          (63,947)
                                                                                            Net financial position                               5,088                  9,063
        Beginning net financial position                          9,063            22,963

        Ending net financial position                             5,088            86,910

Source: Company information
Consolidated Figures

                                                                                                                                                                                   24
NOTICE TO RECIPIENT
This presentation is being provided to you solely for your information and it may not be reproduced or redistributed to any other person.
The information contained in this presentation, which has been prepared by Sanlorenzo S.p.A. (the “Company”) and its consolidated subsidiaries (together, the “Group”) and it is under the responsibility of the
Company, does not constitute or form part of any offer to sell or issue or invitation to purchase or subscribe for, or any solicitation of any offer to purchase or subscribe for, any securities of the Company, nor shall
it or any part of it nor the fact of its distribution form the basis of, or be relied on in connection with, any contract or investment decision. The information and opinions contained in this document are provided as
at the date of the presentation and are subject to change. Neither the Company nor the Group are under any obligation to update or keep current the information contained in this presentation.
The director in charge of preparing the corporate accounting documents, Attilio Bruzzese, declares that pursuant to and for the purposes of article 154-bis, paragraph 2 of Italian Legislative Decree no. 58 of 1998,
the accounting information contained in this document corresponds to company documents, ledgers and accounting records. The financial results as at 31 March 2020 contained in this document have not been
audited.
Forward-Looking Statements: this document may include projections and other “forward-looking” statements within the meaning of applicable securities laws. In particular, all statements that address
expectations or projections about the future, including statements about operating performance, market position, industry trends, general economic conditions, expected expenditures, cost-savings, synergies and
financial results, are forward-looking statements. Consequently, any statements contained herein that are not statements of historical fact are forward-looking statements.
Forward-looking statements are based on assumptions and current expectations and involve a number of known and unknown risks, uncertainties and other factors that could cause actual results, levels of
activity, performance or achievements to be materially different from any future results, levels of activity, performance or achievements expressed or implied by such forward-looking statements. Accordingly,
actual events or results or actual performance of the Company or the Group may differ significantly, positively or negatively, from those reflected or contemplated in such forward-looking statements made
herein. The Group expressly disclaims any duty, undertaking or obligation to update publicly or release any revisions to any of the information, opinions or forward looking statements contained in this document
to reflect any events or circumstances occurring after the date of the presentation of this document. No representation or warranty is made as to the achievement or reasonableness of, and no reliance should be
placed on, such forward-looking statements.
Any reference to past performance or trends or activities of the Company shall not be taken as a representation or indication that such performance, trend or activity will continue in the future.
This presentation contains alternative performance indicators that are not recognized by IFRS. Different companies and analysts may calculate these non-IFRS measures differently, so making comparisons among
companies on this basis should be done very carefully. These non-IFRS measures have limitations as analytical tools, are not measures of performance or financial condition under IFRS and should not be
considered in isolation or construed as substitutes for operating profit or net profit as an indicator of our operations in accordance with IFRS.

                                                                                                                                                                                                                         25
You can also read