EARNINGS UPDATE August 5, 2021 - SBM Offshore
←
→
Page content transcription
If your browser does not render page correctly, please read the page content below
EARNINGS UPDATE

                     August 5, 2021

ENERGY. COMMITTED.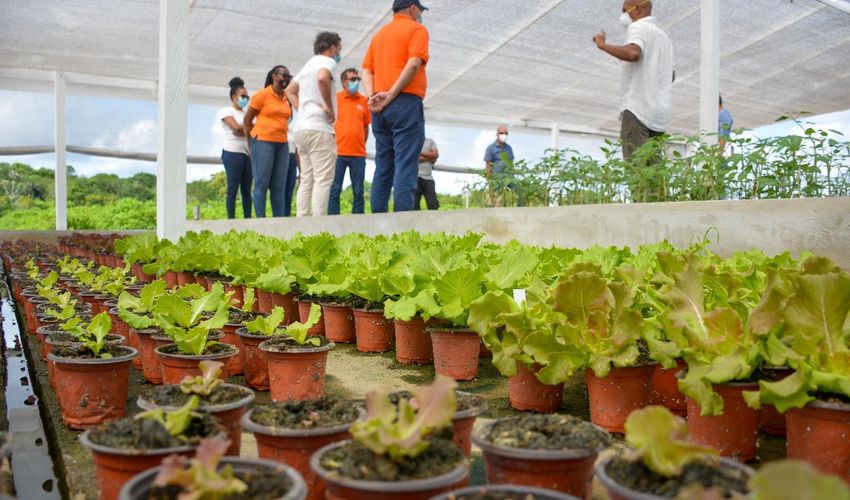
Disclaimer

      The companies in which SBM Offshore N.V. directly and indirectly owns investments are separate legal entities. In this presentation “SBM
      Offshore” and “SBM” are sometimes used for convenience where references are made to SBM Offshore N.V. and its subsidiaries in
      general. These expressions are also used where no useful purpose is served by identifying the particular company or companies.

      This presentation contains forward-looking statements concerning the financial condition, results of operations and businesses of SBM. All
      statements other than statements of historical fact are, or may be deemed to be, forward-looking statements. Forward-looking statements
      are statements of future expectations that are based on management’s current expectations and assumptions and involve known and
      unknown risks and uncertainties that could cause actual results, performance or events to differ materially from those expressed or implied
      in these statements. Forward-looking statements include, among other things, statements concerning the potential exposure of SBM to
      market risks and statements expressing management’s expectations, beliefs, estimates, forecasts, projections and assumptions. All
      forward-looking statements contained in this presentation are expressly qualified in their entirety by the cautionary statements contained or
      referred to in this section. Readers should not place undue reliance on forward-looking statements. Each forward-looking statement speaks
      only as of the date of this presentation. Neither SBM Offshore N.V. nor any of its subsidiaries undertakes any obligation to publicly update
      or revise any forward-looking statement as a result of new information, future events or other information. In light of these risks, results
      could differ materially from those stated, implied or inferred from the forward-looking statements contained in this presentation.

      © 2021. This presentation is the property of SBM Offshore N.V. or any of its subsidiaries (together referred as “SBM”) and contains material
      protected by intellectual property rights, including copyrights, owned by SBM. The trademark "SBM Offshore", the SBM logomark and the
      SBM trademark “Fast4ward” which covers a proprietary and patented SBM technology, are registered marks owned by SBM.
      All copyright and other intellectual property rights in this material are either owned by SBM or have been licensed to SBM by the rightful
      owner(s) allowing SBM to use this material as part of this presentation. Publication or other use, explicitly including but without limitation to
      the copying, disclosing, trading, reproducing, or otherwise appropriating of information, illustrations etc., for any other purposes, as well as
      creating derivative products of this presentation, is prohibited without the prior express written consent of SBM.

     ENERGY. COMMITTED.                                       © SBM Offshore 2021. All right reserved. www.sbmoffshore.com                                2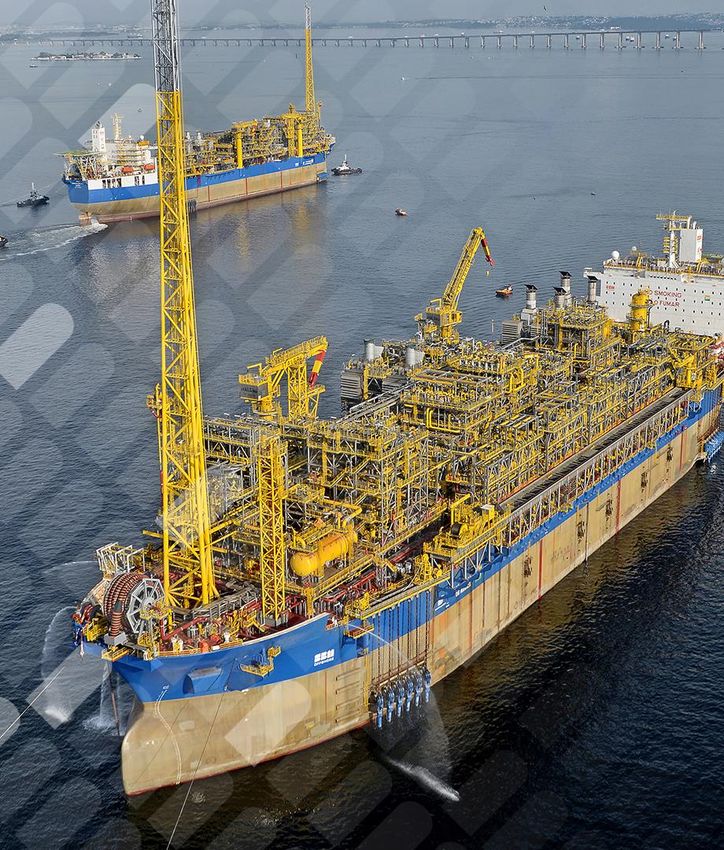
Highlights
ESG
Ocean Infrastructure
Growing the Core
New Energies
HY 2021 Financials
Outlook

    ENERGY. COMMITTED.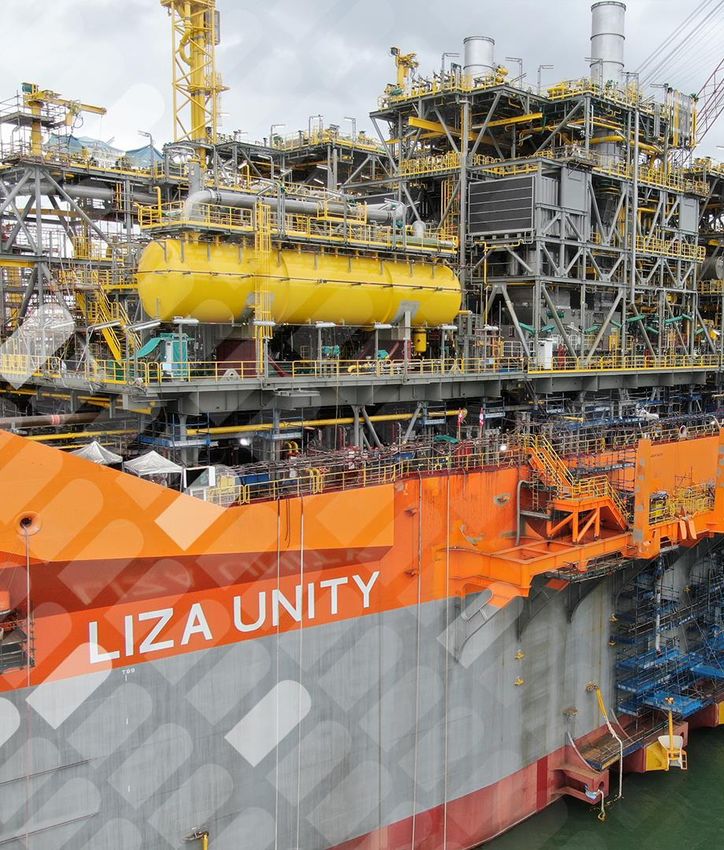
Highlights

                                                                                                                                                                                          2                5
     Major growth phase                                                                                                                                                   Major FPSO              Fast4Ward® projects
                                                                                                                                                                           Awards                    under delivery

     Net cash flow expansion
                                                                                                                                                                      US$ 29.5 b                     US$ 8.7 b
                                                                                                                                                                    Record Backlog1               Net cash from L&O1
     Enhanced shareholders with return

                                                                                                                                                                     EUR 150 m                    Offshore Wind
     Scaling up renewable business                                                                                                                               Share Repurchase
                                                                                                                                                                                                       Initiatives
                                                                                                                                                                     Program

     (1)   Reflects a pro-forma view of the Company’s Directional backlog and expected net cash from Lease and Operate after tax and debt service. Please refer to slide 27 and 36 for details.

     ENERGY. COMMITTED.                                                                                          © SBM Offshore 2021. All right reserved. www.sbmoffshore.com                                           4
Vision. Value Creation

    “SBM Offshore believes the oceans will provide the world with safe, sustainable and affordable energy for generations to come.
                                            We share our experience to make it happen.”

           OCEAN
                                                   GROWING THE CORE                                                       NEW ENERGIES
      INFRASTRUCTURE

     CONTRACTUAL           HISTORICAL                                                                              RENEWABLES    CARBON    DIGITAL
       BACKLOG               UPTIME                                                                                             CAPTURE   SERVICES
                          PERFORMANCE

     ENERGY. COMMITTED.                             © SBM Offshore 2021. All right reserved. www.sbmoffshore.com                                     5
Highlights
ESG
Ocean Infrastructure
Growing the Core
New Energies
HY 2021 Financials
Outlook

    ENERGY. COMMITTED.
ESG at the heart of our business

    ENVIRONMENTAL                                                                                                         SOCIAL                                              GOVERNANCE
    Energy transition towards Net Zero                                                              A safe and inclusive environment where people                       Values-based actions to achieve high ethical
                                                                                                           inspire and empower each other                                               standards

                                                                                   ON TRACK TO ACHIEVE 2021 TARGETS1

     (1)   For further details on 2021 Sustainable Development Goals targets please refer to appendix

     ENERGY. COMMITTED.                                                                                  © SBM Offshore 2021. All right reserved. www.sbmoffshore.com                                                  7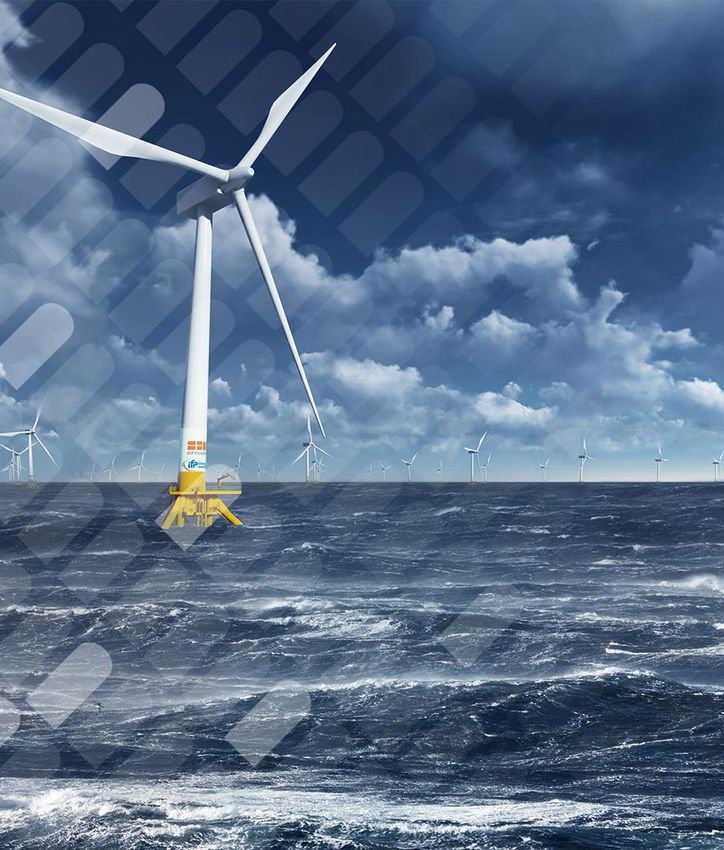
Embedding sustainability across the life cycle
                                                                                                                                       OPERATIONS                   TECHNOLOGY
                                                                                                                                       OPERATIONS
                                                                                                                                   Plympton Farms Guyana:        emissionZERO™ activities
                                                                                                                                    Plympton farm Guyana:
                                                                                                                                      local development,             to qualify topsides
                                                                                                                                      local development,
                                                                                                                                    healthier nutrition, lower    technology to drive down
                                                                                                                                    healthier nutrition, lower
                                                                                                                                           emissions                  emissions during
                                                                                                                                           emissions
                                                                                                                                                                      operations phase

                                                                                                                                        EXECUTION                DECOMMISSIONING

                                                                                                                                    Active engagement with        Deep Panuke platform
                                                                                                                                   yards on workers’ welfare      responsible recycling
                                                                                                                                                                    program on track

 EXTERNAL
RECOGNITION                                                                                                                             Rating: A                 Rating: B
                                           Rating: #1 amongst peers1   Rating: top 93rd Percentile                                      [AAA= max, CCC=min]       [A= max, D- = min]

              (1)   Based on market capitalization / industry

              ENERGY. COMMITTED.                                        © SBM Offshore 2021. All right reserved. www.sbmoffshore.com                                                         8
Highlights               Jean - New
                           picture
ESG
Ocean Infrastructure
Growing the Core
New Energies
HY 2021 Financials
Outlook

    ENERGY. COMMITTED.
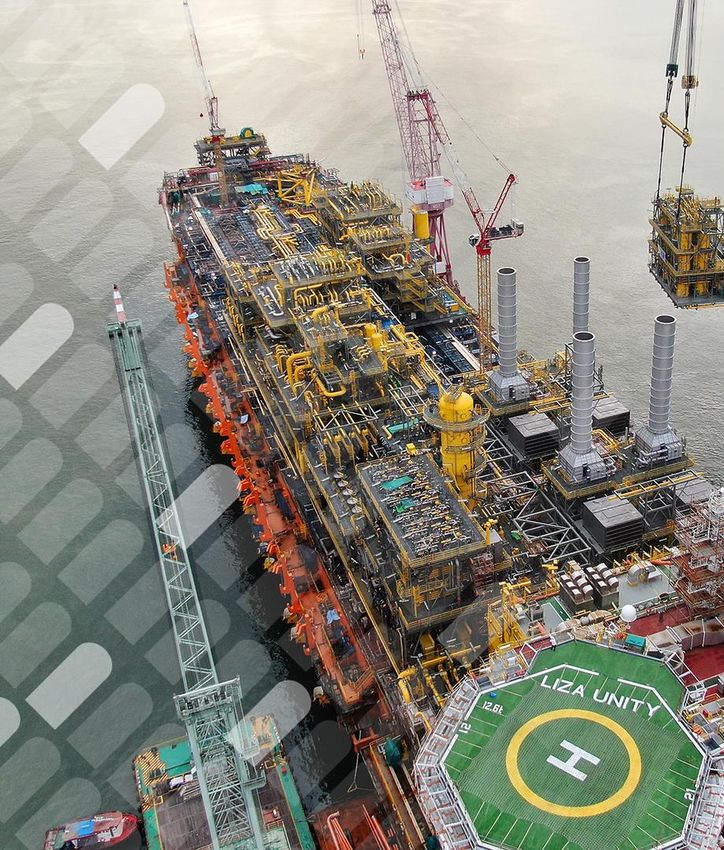
Ocean Infrastructure

                                     15 vessels in operation
                                                                                                                                                                                                   ~US$ 300 m
                                                                                                                                                                               Average annual net cash from L&O1
                                                              Fleet uptime
                                                                                                                                                                                          until 2050
                           99%        99%         99%                   98%        98%         99%        99%       99%
                                                             97%

                           2013       2014       2015        2016       2017       2018       2019        2020     1H 2021

                                                                                                                                                                                                  Cash Acceleration
                  99% historical uptime performance                                                                                                                                                   Potential

     (1)   Reflects a pro-forma view of the Company’s Directional backlog and expected net cash from Lease and Operate after tax and debt service. Please refer to slide 27 and 36 for details.

     ENERGY. COMMITTED.                                                                                          © SBM Offshore 2021. All right reserved. www.sbmoffshore.com                                         10
Delivering value to shareholders US$ millions
Dividend Share repurchase
More than US$ 1.2 billion
returned over the period
1
180
165
196 Stable and growing dividends
166
150 165
47 51 75
45
More than US$ 700 million of
2016 2017 2018 2019 2020 2021 share repurchased over the
period
(1) EUR 150 m share repurchase program launched on August 5, 2021 and expected to be finalized by the end of the year
ENERGY. COMMITTED. © SBM Offshore 2021. All right reserved. www.sbmoffshore.com 11Highlights
ESG
Ocean Infrastructure
Growing the Core
New Energies
HY 2021 Financials
Outlook
ENERGY. COMMITTED.Execution on track
Expected
Percentage of completion
First Oil
Liza Unity (FPSO) > 75% 2022
FPSO Sepetiba > 50% < 75% 2023
Prosperity (FPSO) > 25% < 50% 2024
FPSO Almirante Tamandaré < 25% 2024
FPSO Alexandre de Gusmão < 25% 2025
ENERGY. COMMITTED. © SBM Offshore 2021. All right reserved. www.sbmoffshore.com 13Double resilience with competitive and low carbon technologies
US$ break-even price per barrel
~US$25-35
Break-even price of
world-class deep
water reservoirs 0 10 20 30 40 50 60
Upstream Carbon intensity kgCO2e/boe
~8-11.5
KgCO2e/boe1 Industry average based on various sources
For new FPSO
To net zero 0 10 20 30 40 50 60
(1) Applicable for new units, calculated based on nameplate capacity
ENERGY. COMMITTED. © SBM Offshore 2021. All right reserved. www.sbmoffshore.com 14Potential FPSO Awards 2021-2024
2+ FPSO Positive Selective & 3
projects per outlook for
year capacity target market
Disciplined
1
3 1
3
11
12 1 2
9 9 1
10 c. 8 Avg. / year 2
7 15
5
5
3
FPSO awards
2 SBM Offshore FPSO awards
2021 FPSO awards to date
1 2 1 2 Potential FPSO awards Break Even US$40 per barrel Potential FPSO award(s)
Source: SBM Offshore market intelligence
ENERGY. COMMITTED. © SBM Offshore 2021. All right reserved. www.sbmoffshore.com 15Highlights Jean - New
picture
ESG
Ocean Infrastructure
Growing the Core
New Energies
HY 2021 Financials
Outlook
ENERGY. COMMITTED.Mission and Portfolio
Develop products and services for the sustainable energy of the future leveraging what SBM Offshore is best at:
Ocean Energies, Project Management, Innovation/Technology, Operations and Financial Engineering
RENEWABLES CARBON CAPTURE SMART SERVICES
ENERGY. COMMITTED. © SBM Offshore 2021. All right reserved. www.sbmoffshore.com 17Floating Offshore Wind – Positioning and Progress
POSITIONING IN THE FULL VALUE CHAIN Contributing to LCOE1 reduction
and competitive solutions to our
of floating offshore wind business clients.
Technology program
next generation floater
25 MW
PGL project on track
Operation &
Development Execution
Maintenance
200 MW Ongoing services offers
Llŷr project under development
Cost out program
Return on experience
(1) Levelized cost of energy
ENERGY. COMMITTED. © SBM Offshore 2021. All right reserved. www.sbmoffshore.com 18Floating Offshore Wind – Strong commercial pipeline
Looking for the
RIGHT OPPORTUNITIES
Engaging in
ALL KEY MARKETS
2 GW BY 2030 AMBITION
project portfolio developed
AMBITION TO BE TOP 3
KEY FLOATING OFFSHORE WIND AWARD AREAS (2021-2030) floating technology provider
Source: SBM Offshore market intelligence
ENERGY. COMMITTED. © SBM Offshore 2021. All right reserved. www.sbmoffshore.com 19Floating Offshore Wind - Tension Leg Platform Key Benefits
• HIGHER [AEP]
LOWER Reduced Low motion and Turbine friendly
LCOE seabed footprint counter pitch concept
Concept O&M
scalability optimization
Higher output1 Lower cost2
(1) AEP (Annual energy production)
(2) LCOE (Levelized cost of energy)
ENERGY. COMMITTED. © SBM Offshore 2021. All right reserved. www.sbmoffshore.com 20Transferring our expertise into carbon capture & storage value chain
2 million
tonnes per year of CO2 captured and reinjected
on existing fleet Applying our
Tower Loading Unit technology
for carbon transfer to a project with Carbon Collectors
Technology and experience
for Transportation, Capture & Reinjection
ENERGY. COMMITTED. © SBM Offshore 2021. All right reserved. www.sbmoffshore.com 21Highlights
ESG
Ocean Infrastructure
Growing the Core
New Energies
HY 2021 Financials
Outlook
ENERGY. COMMITTED.Financial Highlights
US$ 29.5 b US$ 8.7 b
Record Backlog1 Net cash from L&O1
US$ 1.9 b EUR 150 m
Financings Closed2 Share Repurchase Program
(1) Reflects a pro-forma view of the Company’s Directional backlog and expected net cash from Lease and Operate after tax and debt service. Please refer to slide 27 and 36 for details.
(2) Financing closed at SPV levels, full amount disclosed
ENERGY. COMMITTED. © SBM Offshore 2021. All right reserved. www.sbmoffshore.com 23Directional Overview1
Pro-forma backlog and L&O net cash2 (US$ billions) Net debt (US$ billions)
29.5
21.6
US$ 300 m avg/year
US$ 260 m avg/year L&O net cash to 2050 4.1 4.6
L&O net cash to 2045
FY 2020 1H 2021 FY 2020 1H 2021
Revenue (US$ millions) EBITDA (US$ millions)
1,147 Underlying Revenue
1,179 501 Underlying EBITDA
1,072
523
426
1H 2020 1H 2021 1H 2020 1H 2021
(1) Directional view, presented in the Financial Statements under Operating segments and Directional reporting, represents a pro-forma accounting policy, which assumes all lease contracts are classified as operating leases and all vessel investees are proportionally consolidated. This
explanatory note relates to all Directional reporting in this document.
(2) Reflects a pro-forma view of the Company’s Directional backlog and expected net cash from Lease and Operate after tax and debt service. Please refer to slide 27 and 36 for details.
ENERGY. COMMITTED. © SBM Offshore 2021. All right reserved. www.sbmoffshore.com 241H 2021 Sources and Uses of Cash Directional, US$ millions
Cash from Operations1 Debt drawdowns2 Other
Sources of cash 460 695 25
Uses of cash 270 95 27 165 155 543
Debt repayment Interest Dividend Growth
(including lease liabilities) (Capex + Fast4Ward®)
Tax Working capital
Cash December 2020 383
Cash variation3 (73)
Cash June 2021 310
(1) Please refer to slide 39 for more details on cash from operations
(2) Includes the net proceeds from the FPSO Cidade de Ilhabela bond issuance
(3) Includes foreign currency impact of US$ 2 million
ENERGY. COMMITTED. © SBM Offshore 2021. All right reserved. www.sbmoffshore.com 25Debt enables growth Directional, US$ billions
Net debt/ Backlog1 ratio
45 20%
40 Historical Range
35 14% – 20% 15%
30
25 29.5
10%
20
20.7 21.6
15
17.1 16.8
10 14.8 2 5%
3.1 3.3 4.0 4.5
5 2.7 2.2
- 0%
2016 2017 2018 2019 2020 1H21
Pro-forma Backlog Net Debt (excluding IFRS 16) Debt to Backlog
(1)
Assets3 Liabilities and net assets3 Directional EBITDA
Assets under construction 2.4 Construction project debt 1.7 EBITDA generated in the future
Non-recourse project debt 3.1 L&O EBITDA 1.04
Property, Plant & Equipment 4.0
Operational gross Debt / EBITDA 3.1x
(1) Reflects a pro-forma view of the Company’s Directional backlog. Please refer to slide 27 and 36 for details.
(2) US$ 4.8 million gross debt, excluding lease liabilities and including net cash
(3) 1H21 figures
(4) FY20 figure as proxy
ENERGY. COMMITTED. © SBM Offshore 2021. All right reserved. www.sbmoffshore.com 26c. 30 years of net cash flow visibility from L&O and BOT1 Directional, US$ millions
US$ 29.5 b L&O and BOT net cash translated in EUR/share3
Pro-forma 21 19 18
backlog1
TK 2.6
BOT 2.4 700
6% 7% 8%
600 Average L&O net cash p.a. after tax Discount rate
c. US$ 360 million until 2031
500 c. US$ 300 million until 2050
400
L&O 24.5
300
200
100
-
2H 2021 2022 2023 2024 2025 2026 2027 2028 2029 2030 2031 2032 2033 2034 2035 2036 2037 2038 2039 2040 2041 2042 2043 2044 2045 2046 2047 2048 2049 2050
US$ billions Net cash from L&O Net cash from BOT Sale
(1) Company estimated pro-forma net cash flow based on a variety of long term assumptions which are subject to change, including pro-forma Directional backlog, operational expenses, debt redemptions, interests and tax but does not include construction costs. The pro-forma net cash
flow includes the following key assumptions: Liza Unity (FPSO) debt amortization assumes no repayment during L&O and Loan redemption upon the sale impacting BOT.
(2) Rounding applied to nearest hundred million in the L&O and BOT sale net cash flow and then minor adjustments applied to reconcile with the total net cash.
(3) EUR/share calculation based on Net Present Value of L&O and BOT sale pro-forma net cash flow discounted at rates commonly used by the financial community. Considering 0.84 US$/EUR exchange rate as of 04-Aug-21 and 188,671,305 outstanding shares. Value excludes future
awards and potential contract extensions.
ENERGY. COMMITTED. © SBM Offshore 2021. All right reserved. www.sbmoffshore.com 27Long Term Value Growth Upside
GROWING THE CORE - FPSO NEW ENERGIES
~1-2 EUR per share per awarded contract 2 GW ambition by 2030
Focus development
EPCI Operation
projects
NPV1 Sell
down
EUR 1 EUR 2 Development
Securing access to opportunity pipeline
Financing Facility
Financing Facility
(1) Uses range of assumptions commonly used by financial community, depending on size of FPSO.
ENERGY. COMMITTED. © SBM Offshore 2021. All right reserved. www.sbmoffshore.com 28Capital Allocation & Shareholder Returns Model
US$ 29.5 b
+
Pro-forma
backlog1
… Net Cash Backlog Acceleration
… Dividend
700 Accelerated equity cash flow
600
Lower debt Higher debt
…
500
400
300 Y0 Y1
Y1 Y2
Y2 Yn
Yn
New Equity
Original Debt
New Debt
= Growth
US$ billions
200
100
-
+ Growth Share
Repurchase
EUR 150 m SHARE REPURCHASE2
SUPPORTED BY CASH ACCELERATION
(1) Reflects a pro-forma view of the Company’s Directional backlog and net cash. Please refer to slide 27 and 36 for details.
(2) EUR 150 m share repurchase program launched on August 5, 2021 and expected to be finalized by the end of the year
ENERGY. COMMITTED. © SBM Offshore 2021. All right reserved. www.sbmoffshore.com 29Highlights
ESG
Ocean Infrastructure
Growing the Core
New Energies
HY 2021 Financials
Outlook
ENERGY. COMMITTED.2021 Guidance confirmed
DIRECTIONAL EBITDA Around 900 million US$
DIRECTIONAL REVENUES Around 2.6 billion US$
LEASE & OPERATE Around 1.6 billion US$
TURNKEY Around 1.0 billion US$
This guidance includes Directional revenues and EBITDA of US$ 75 million related to the cash receipts in 2021 from the Deep Panuke contract. It also considers the currently foreseen COVID-19 impacts on projects and fleet operations. The Company highlights that the direct and indirect
impact of the pandemic could continue to have a material impact on the Company’s business and results and the realization of the guidance for 2021.
ENERGY. COMMITTED. © SBM Offshore 2021. All right reserved. www.sbmoffshore.com 31Appendix ENERGY. COMMITTED.
Sustainable Development Goals – Company targets for 2021

     ENERGY. COMMITTED.       © SBM Offshore 2021. All right reserved. www.sbmoffshore.com   33
Financial performance per segment Directional, US$ millions
Lease and Operate Turnkey
Underlying Revenue Underlying EBITDA Revenue EBITDA
829 827
538 531
351
321
25
9
1H 2020 1H 2021 1H 2020 1H 2021 1H 2020 1H 2021 1H 2020 1H 2021
“Other” Underlying EBITDA 1H 2020 US$ (40) million vs 1H 2021 US$ (40) million
ENERGY. COMMITTED. © SBM Offshore 2021. All right reserved. www.sbmoffshore.com 34Debt supporting L&O projects Directional, US$ billions
Assets Liabilities and net assets Group liquidity
Property, Plant & Equipment 0.21
Other
Financial assets 0.1 Net working capital,
Cash and cash equivalents 0.3 provisions and other 0.7
0.3
Other net liabilities 0.2 Lease Liabilities (IFRS 16) 0.1
1.2 0.7
Construction project debt 1.7
Lease and Operate
Assets under construction 2.4
Non-recourse project debt 3.1
Net cash
Property, Plant & Equipment 4.0
Deferred income 0.4 Undrawn RCF
Hedging 0.1
Undrawn project debt
L&O net assets 1.1
Simplified balance sheet to highlight L&O orientation, not to scale
(1) Property, Plant & Equipment (including Right Of Use assets)
ENERGY. COMMITTED. © SBM Offshore 2021. All right reserved. www.sbmoffshore.com 35Pro-forma Backlog1 and borrowings repayment Directional, US$ billions 2
TK 2.6 Pro-forma Directional L&O and BOT backlog (1) Backlog is the undiscounted revenue over the firm portion of the contracts. The pro-forma Directional backlog at 1H 2021 reflects
the following key assumptions: the Liza Destiny (FPSO) contract covers 10 years of lease and operate, both the Liza Unity (FPSO)
Turnkey and the Prosperity (FPSO) contracts cover a maximum period of two years of lease and operate after which the FPSO ownership
Backlog
BOT 2.4 3.0 and operation will transfer to the client. The impact of the subsequent sale of Liza Unity (FPSO) and Prosperity (FPSO) is reflected
in the Turnkey backlog. FPSO Almirante Tamandaré and FPSO Alexandre de Gusmão are added to the backlog based on the
initially targeted SBM Offshore ownership share (55%) in the lease and operate contracts. The partial divestment to partners (45%)
which remains subject to finalization of the shareholder agreement and various other approvals, was included in the Turnkey
2.5 backlog. For more details, refer to 2021 Half Year Earnings report.
(2) Rounding applied to the nearest hundred million in backlog figures and then minor adjustments to reconcile with reported pro-forma
backlog; rounding applied to nearest ten million in the debt redemption profile.
(3) The difference between current borrowings and the borrowings repayment profile are attributable to drawn portion of the RCF,
capitalized transaction costs, undrawn portion of Liza Unity (FPSO) and Prosperity (FPSO) and project loan assumptions of FPSOs
2.0 Sepetiba, Almirante Tamandaré and Alexandre de Gusmão. Liza Unity (FPSO) debt amortization assumes no repayment during
L&O and Loan redemption upon the sale impacting BOT. 2021 includes borrowings repayment related to the Deep Panuke
Platform financing.
1.5
L&O 24.5
L&O
1.0
BOT Sale
0.5
-
2H 2021 2022 2023 2024 2025 2026 2027 2028 2029 2030 2031 2032 2033 2034 2035 2036 2037 2038 2039 2040 2041 2042 2043 2044 2045 2046 2047 2048 2049 2050
US$ 29.5 b Pro-forma Directional L&O and BOT borrowings repayment profile3
Pro-forma
backlog 2.0
1.65
1.42
1.5
1.0
0.61 0.52
0.38 0.41 0.44 0.47 L&O + BOT Sale
0.5 0.30 0.27 0.26 0.27 0.24 0.21 0.21
0.19 0.17 0.13 0.11
- - - - - - - - - - -
-
2H 2021 2022 2023 2024 2025 2026 2027 2028 2029 2030 2031 2032 2033 2034 2035 2036 2037 2038 2039 2040 2041 2042 2043 2044 2045 2046 2047 2048 2049 2050
ENERGY. COMMITTED. © SBM Offshore 2021. All right reserved. www.sbmoffshore.com 36Group P&L and underlying items Directional, US$ millions
Group P&L Directional underlying items
US$ millions 1H 2020 1H 2021 Variance US$ millions 1H 2020 1H 2021 Impact P&L
Revenue 1,179 1,072 (107) Deep Panuke termination fee - (75) Revenue
Underlying Revenue 1,179 1,147 (32) Subtotal Revenue impact - (75)
Deep Panuke termination fee - (75) Revenue
Gross Margin 270 293 23
Subtotal EBITDA impact - (75)
Overheads (110) (112) (2)
SBM Installer impairment (57) - Depreciation & Impairment
Other operating income / (expense) (3) 2 5
Deep Panuke depreciation - 78 Depreciation & Impairment
Net impairment losses on financial and
(14) 5 19
contract assets
Subtotal other impact (57) 78
EBIT 142 187 45 Total Net Profit attr. to
(57) 3
shareholders impact
Depreciation, amortization and impairment (380) (238) 142
EBITDA 523 426 (97)
Underlying EBITDA 523 501 (22)
Net financing costs (89) (89) 1
Share of profit of equity-accounted investees 2 (1) (3)
Income tax expense (17) (34) (17)
Net Income attributable to shareholders 38 64 26
Underlying net income attributable to
94 61 (34)
shareholders
ENERGY. COMMITTED. © SBM Offshore 2021. All right reserved. www.sbmoffshore.com 37Turnkey and Lease and Operate P&L Directional, US$ millions
Turnkey Comments
US$ millions 1H 2020 1H 2021 Variance
Liza Unity, Prosperity, Sepetiba, Almirante Tamandaré, multiple
Ongoing Projects
Revenue 351 321 (30) FEEDs and other various business
Gross Margin 10 50 40
D, A & I SBM Installer impairment in 2020 of US$(57) million
EBIT (49) - 49
Depreciation, amortization and impairment (74) (9) 65
EBITDA Comparative contribution of Johan Castberg turret project
EBITDA 25 9 (16)
Lease and Operate Comments
US$ millions 1H 2020 1H 2021 Variance Vessels In/Out -
Revenue 829 752 (77)
D, A & I Deep Panuke redelivery and associated depreciation
Underlying Revenue 829 827 (2)
Gross Margin 260 243 (17) Deep Panuke redelivery in 2020 (2021 cash receipts
EBITDA already accounted for as accrued income at December 30,
EBIT 233 228 (6) 2020)
Depreciation, amortization and impairment (304) (228) 76
Underlying EBITDA Stable including Deep Panuke 2021 cash receipts
EBITDA 538 456 (82)
Underlying EBITDA 1H 2021: 64.2%
Underlying EBITDA 538 531 (7) Margin 1H 2020: 64.9%
ENERGY. COMMITTED. © SBM Offshore 2021. All right reserved. www.sbmoffshore.com 381H 2021 sources and uses of cash Directional, US$ millions
L&O 531
Turnkey 10
Other (40)
Underlying EBITDA 501
Deferred income (41)
Cash from Operations Debt drawdowns1 Other
Sources of cash 460 695 25
Uses of cash 270 95 27 165 155 543
Debt repayment Interest Dividend Growth
(including lease liabilities) (Capex + Fast4Ward®)
Tax Working capital
Cash December 2020 383
Cash variation2 (73)
Cash June 2021 310
(1) Includes the net proceeds from the FPSO Cidade de Ilhabela bond issuance
(2) Includes foreign currency impact of US$ 2 million
ENERGY. COMMITTED. © SBM Offshore 2021. All right reserved. www.sbmoffshore.com 39Cash Flow Statement Directional, US$ millions
US$ millions 1H 2021
EBITDA 426
Changes in operating assets and liabilities (210)
Income taxes paid (27)
Net cash flows from (used in) operating activities 188
Capital expenditures (452)
Other investing activities 23
Net cash flows from (used in) investing activities (429)
Addition and repayments of borrowings and lease liabilities 425
Dividend (165)
Interests paid (95)
Net cash flows from (used in) financing activities 166
Foreign currency variations 2
Net increase/(decrease) in net cash and cash equivalents (73)
Net cash and cash equivalents as at 31 December 2020 383
Net cash and cash equivalents as at 30 June 2021 310
ENERGY. COMMITTED. © SBM Offshore 2021. All right reserved. www.sbmoffshore.com 40Balance Sheet Directional, US$ millions
Comments on variation
US$ millions FY 2020 1H 2021 Variance
Progress of main FPSO projects partially compensated by
Property, plant & equipment and Intangibles 6,133 6,393 259
depreciation
Investment in associates and other financial assets 311 322 11 Investments in Renewable
Construction contracts 69 88 19 Progress in Sepetiba
Investment in non-allocated MPFs compensated by decrease in
Trade and other assets 997 989 (8)
receivables mainly related to Deep Panuke
Cash and cash equivalents 383 310 (73) See cash flow statement
Total assets 7,894 8,102 208
Dividends paid partially compensated by the result of the period
Total equity 858 807 (51)
and increase of the hedging reserves
Mainly Cidade de Ilhabela project bond issuance, Unity project
Borrowings and lease liabilities 4,476 4,913 437 loan and RCF drawdowns, partly offset by other project
financing repayment
Provisions 549 546 (3)
Trade payables and other liabilities 1,616 1,482 (135) Hedging instruments IRS Marked-to-Market value increase
Release of deferred income on lease contracts with declining
Deferred income 395 354 (41)
bareboat profile
Total equity and liabilities 7,894 8,102 208
ENERGY. COMMITTED. © SBM Offshore 2021. All right reserved. www.sbmoffshore.com 41Lease qualification and consolidation methods IFRS 10 & 11
Assets Lease Contract Type SBM Share % Directional IFRS
FPSO N’Goma FL 50% Proportional Equity
FPSO Saxi Batuque FL 50% Proportional Equity
FPSO Mondo FL 50% Proportional Equity
FPSO Cidade de Ilhabela FL 75% Proportional Full consolidation
FPSO Cidade de Maricá FL 61% Proportional Full consolidation
FPSO Aseng FL 60% Proportional Full consolidation
FPSO Cidade de Paraty FL 63.13% Proportional Full consolidation
FPSO Cidade de Saquarema FL 61% Proportional Full consolidation
FPSO Kikeh FL 49% Proportional Equity
FPSO Sepetiba FL 64.5% Proportional Full consolidation
FPSO Almirante Tamandaré FL 100% 100% Full Consolidation
FPSO Espirito Santo FL 51% Proportional Full consolidation
FPSO Capixaba OL 100% 100% Full consolidation
Deep Panuke -1 100% 100% Full consolidation
Thunder Hawk OL 100% 100% Full consolidation
FPSO Cidade de Anchieta OL 100% 100% Full consolidation
Liza Destiny (FPSO) FL 100% 100% Full consolidation
Liza Unity (FPSO) FL 100% 100% Full consolidation
Prosperity (FPSO) FL 100% 100% Full consolidation
FPSO Serpentina - 60% Proportional Full consolidation
Brasa Yard - 50% Equity Equity
PAENAL Yard - 30% Equity Equity
Normand Installer - 49.9% Equity Equity
SBM Installer - 100% 100% Full Consolidation
(1) Unit redelivered to SBM Offshore in July 2020, upon redelivery contract does not qualify as lease contract anymore
ENERGY. COMMITTED. © SBM Offshore 2021. All right reserved. www.sbmoffshore.com 42External loans and borrowings Directional, US$ millions
Net book value as of June 30, 2021 Full Amount IFRS Directional
PROJECT FINANCE FACILITIES DRAWN
FPSO Cidade de Paraty 254 254 160
MOPU Deep Panuke 10 10 10
FPSO Cidade de Anchieta 257 257 257
FPSO Cidade de Ilhabela 823 823 618
FPSO N’Goma 356 - 178
Normand Installer 30 - -
SBM Installer 62 62 62
FPSO Cidade de Maricá 963 963 587
FPSO Cidade de Saquarema 1,064 1,064 649
Liza Destiny (FPSO) 637 637 637
Liza Unity (FPSO) 961 961 961
FPSO Sepetiba 599 599 386
Revolving Credit Facility and other 343 343 343
NET BOOK VALUE OF LOANS AND BORROWINGS 6,359 5,975 4,850
ENERGY. COMMITTED. © SBM Offshore 2021. All right reserved. www.sbmoffshore.com 43Group net debt and borrowings Directional, US$ millions
Net debt Undrawn facilities + cash
5,000
3,500
4,603
4,093 1,226
2,000
310
500
710
-1,000
FY 2020 1H 2021 1H 2021
Net cash Project debt RCF and other Lease liabilities Undrawn RCF Net cash Undrawn project debt
Average cost of debt 1H 2021 borrowings and lease liabilities
Non-recourse project debt
1,381
4.3% 4.1%
RCF and other
61 Lease liabilities
343 3,126
FY 2020 1H 2021 Recourse project debt
ENERGY. COMMITTED. © SBM Offshore 2021. All right reserved. www.sbmoffshore.com 44Revolving Credit Facility Covenants
Key financial covenant 1H 2021 Definition1
Solvency ratio > 25% ✓ 33% IFRS Tangible net worth divided by total tangible IFRS assets
Interest cover ratio > 4.0 ✓ 5.3 Directional Underlying EBITDA divided by net interest payable
Represents maximum theoretical lending capacity, calculated as net
Lease backlog cover ratio N/A ✓ US$ 2.1bn present value of lease backlog divided by 1.5
✔ All covenants are satisfied
(1) Further explanation on definitions and covenant calculations can be found in the Company’s Annual Report 2020 section 4.3.24 borrowings and lease liabilities
ENERGY. COMMITTED. © SBM Offshore 2021. All right reserved. www.sbmoffshore.com 45Lease and Operate portfolio
Initial Lease Period Contractual Extension Option Confirmed Extension Conversion
(1) FPSO Serpentina is owned by the client and is operated by Gepsing – a subsidiary between SBM Offshore (60%) and GEPetrol (40%)
(2) Client change yet to be confirmed as Chevron/Noble Energy transitioning as part of takeover
* Under construction
ENERGY. COMMITTED. © SBM Offshore 2021. All right reserved. www.sbmoffshore.com 46ENERGY. COMMITTED. © SBM Offshore 2021. All right reserved. www.sbmoffshore.com 47
You can also read