(NASDAQ: BYND) INVESTOR PRESENTATION - May 5, 2020 - Investor Relations | Beyond Meat, Inc.
←
→
Page content transcription
If your browser does not render page correctly, please read the page content below

(NASDAQ: BYND)
I NVESTOR P RESENTATION
May 5, 2020

Disclaimer
This presentation contains, in addition to historical information, certain forward-looking statements that are based on our current assumptions, expectations and projections about future performance and
events and relate to, among other matters, our future financial performance, our business strategy, industry and market trends, future expectations concerning our market position, future operations and
capital expenditures.

Forward-looking statements generally contain words such as "believes," "expects," "may," "will," "should," "seeks," "approximately," "intends," "plans," "estimates," "anticipates," and similar expressions..
These forward-looking statements are only predictions, not historical fact. You should, therefore, not rely on these forward-looking statements as representing our views as of any date subsequent to the date
of this presentation. Forward-looking statements are based on information available at the time those statements are made and/or management’s good faith belief as of that time with respect to future events
and are subject to risks and uncertainties that could cause actual performance or results to differ materially from those expressed in or suggested by the forward-looking statements. Important factors that
could cause actual results to differ materially from expectations include, among others: the magnitude and duration of the COVID-19 pandemic; our ability to effectively manage our growth; our ability to
effectively expand our manufacturing and production capacity, forecast demand and manage our inventory; our ability to successfully enter new markets, manage our international expansion and comply with
any applicable laws and regulations; the effects of increased competition from our market competitors; the success of our marketing efforts and the ability to grow brand awareness, maintain, protect and
enhance our brand, attract and retain new customers and grow our market share; changes in consumer tastes and trends in our industry; changes in government regulations and policies; availability and
prices of raw materials for our products; outcomes of legal or administrative proceedings; the financial condition of, and our relationship with our suppliers, co-manufacturers, distributors, retailers and
foodservice customers; the ability of our suppliers and co-manufacturers to comply with food safety, environmental or other laws or regulations; and general economic conditions. We are under no duty to
update any of these forward-looking statements after the date of this presentation except as otherwise required by law.

Our historical results are not necessarily indicative of the results to be expected for any future periods and our operating results for the three-month period ended March 28, 2020 are not necessarily indicative
of the results that may be expected for the fiscal year ending December 31, 2020 or any other interim periods or any future year or period.

This presentation also contains estimates and other statistical data obtained from independent parties and by us relating to market size and growth and other data about our industry and ultimate consumers.
The number of retail and foodservice outlets are derived from data through March 28, 2020. This data involves a number of assumptions and limitations, and you are cautioned not to give undue weight to
such estimates and data. In addition, projections, assumptions and estimates of our future performance and the future performance of the geographic and other markets in which we operate are necessarily
subject to a high degree of uncertainty and risk.

"Beyond Burger," "Beyond Beef," "Beyond Chicken," "Beyond Meat," “Beyond Sausage,” “Beyond Breakfast Sausage,” "The Cookout Classic,“ “Go Beyond,” “the Caped Steer Logo,” "The Future of Protein"
and "The Future of Protein Beyond Meat" and design are registered trademarks of Beyond Meat, Inc. in the United States and, in some cases, in certain other countries. All other brand names or trademarks
appearing in this presentation are the property of their respective holders. Solely for convenience, the trademarks and trade names in this presentation are referred to without the ® and ™ symbols, but such
references should not be construed as any indicator that their respective owners will not assert, to the fullest extent under applicable law, their rights thereto.

Non-GAAP Financial Measures

We present Adjusted EBITDA and Adjusted EBITDA as a % of net revenues to help us describe our operating performance. Our presentation of Adjusted EBITDA and Adjusted EBITDA as a % of net
revenues is intended as a supplemental measure of our performance that is not required by, or presented in accordance with, U.S. generally accepted accounting principles (“GAAP”). Adjusted EBITDA and
Adjusted EBITDA as a % of net revenues should not be considered as an alternative to net income (loss), earnings per share or any other performance measures derived in accordance with GAAP as
measures of operating performance or operating cash flows or as measures of liquidity. Our presentation of Adjusted EBITDA should not be construed to imply that our future results will be unaffected by
these items. See the appendix to this presentation for a reconciliation of Adjusted EBITDA and Adjusted EBITDA as a % of net revenues to net income (loss) and net income (loss) as a % of net revenues.

“Adjusted EBITDA” is defined as net income (loss) adjusted to exclude, when applicable, income tax expense (benefit), interest expense, depreciation and amortization expense, restructuring expenses,
share-based compensation expense, inventory losses from termination of an exclusive supply agreement with a co-manufacturer, costs of termination of an exclusive supply agreement with the same co-
manufacturer, expenses primarily associated with the conversion of our convertible notes and remeasurement of our preferred stock warrant liability and common stock warrant liability, and Other, net,
including investment income.

“Adjusted EBITDA as a % of net revenues” is defined as Adjusted EBITDA divided by net revenues.

We use Adjusted EBITDA and Adjusted EBITDA as a % of net revenues because they are important measures upon which our management assesses our operating performance. We use Adjusted EBITDA
and Adjusted EBITDA as a % of net revenues as key performance measures because we believe these measures facilitate operating performance comparison from period-to-period by excluding potential
differences primarily caused by the impact of restructuring, asset depreciation and amortization, non-cash share-based compensation and non-operational charges including the impact to cost of goods sold
and selling, general and administrative expenses related to the termination of an exclusive co-manufacturing agreement, early extinguishment of convertible notes and remeasurement of warrant liability, and
investment income. Because Adjusted EBITDA and Adjusted EBITDA as a % of net revenues facilitate internal comparisons of our historical operating performance on a more consistent basis, we also use
these measures for our business planning purposes. In addition, we believe Adjusted EBITDA and Adjusted EBITDA as a % of net revenues are widely used by investors, securities analysts, ratings agencies
and other parties in evaluating companies in our industry as a measure of our operational performance.
                                                                                                                                                                                                          1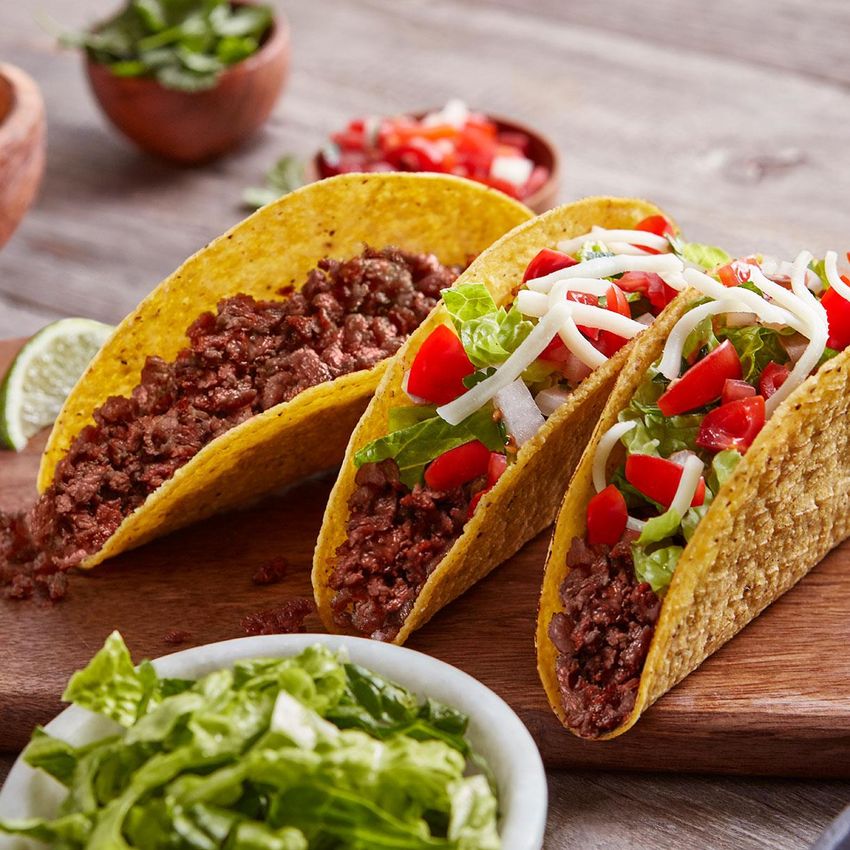
B USINESS O VERVIEW

We Use Proprietary Science to Redefine Meat
                               Beyond Meat’s Proprietary Technology & Processes are Used to Replicate
                                      Animal Meat’s Principal Components from Plant Proteins
   We begin with meat’s COMPOSITION versus its animal ORIGIN                Then replicate its core structure & sensory experience

    Microscopy Comparing Beyond Sausage to Pork Sausage                Actual Images of the Beyond Burger and Ground Beef
          Scanning Electronic Microscopy   Confocal Laser Microscopy
                                                                                     Raw                              Cooked

                                                                       Beyond                         Beyond
Beyond                                                                 Burger                         Burger
Sausage

                                                                       Ground                          Ground
  Pork                                                                  Beef                            Beef
Sausage

                                                                                                                                     3
We are Committed to Providing Products that Enable
     Consumers to Eat What You Love™

                          42%                                                            18-51%                                                                   78%                                                    60-70 Billion
 Reduced risk of developing heart                                             Of global greenhouse gas                                     Of all agricultural land is used for                                         Farm animals reared for
failure associated with people who                                               emissions driven by                                       livestock, including grazing land                                               food each year5
   eat a mostly plant-based diet1                                               livestock rearing and                                        and cropland dedicated to the
                                                                                     processing3                                                   production of feed4
                          30%
      Of most cancers in developed                                                                                                                                29%
      countries attributed to dietary                                                                                                        Of the water in agriculture is
    factors, including consumption of                                                                                                    directly or indirectly used for animal
               certain meats2                                                                                                                          production³

       With current food production systems threatening both human health and environmental sustainability, plant-
         based diets offer a growing global population a solution of healthy diets and sustainable food systems.6
1   Plant Based Diet Associated with Less Heart Failure Risk Report, presented at the American Heart Association scientific meeting, November 13, 2017.
2   Key, Timothy J. et al., Diet, nutrition and the prevention of cancer, Scientific background papers of the joint WHO/FAO expert consultation, Geneva, 28 January - 1 February 2002, Public Health Nutrition, Vol 7, No. 1(A), Supplement 1001, February 2004.
3   Reprinted from Water Resources and Industry, Volumes 1–2, March–June 2013, P.W. Gerbens-Leenes, M.M. Mekonnen, A.Y. Hoekstra, The water footprint of poultry, pork and beef: A comparative study in different countries and production systems,
     Page No. 26, Copyright (2013), with permission from Elsevier.
4   Livestock’s Long Shadow-Environmental Issues and Options, Food and Agriculture Organization of the United Nations, 2006.
5
6
    Compassion in World Farming, Strategic Plan 2013-2017.                                                                                                                                                                                                         4
    Food in the Anthropocene: the EAT–Lancet Commission on healthy diets from sustainable food systems, 2019.
Innovation is at the Core of our Company and is a Key
Differentiator
Innovation Strategy Led by Highly
State-of-the-Art Innovation Center
Respected Team of Scientists
Large, experienced team composed of scientists, R&D Application Lab
engineers, researchers, technicians, and chefs
Color / Encapsulation Lab
Work seamlessly with internal chefs and food technologists
to ensure the best quality in terms of taste, texture and Analytical Lab
other sensory attributes
Chemical Lab
Microbiology / Fermentation Lab
R&D as a % of Net Revenue (Most Recent FY)
Pilot Plant
6.9% Test Kitchen
Beyond Meat
Nestle Nestle 1.8%
Kellogg 1 Kellogg 1.1%
2
WH GroupConagra 0.6%
3
ConagraWH Group 0.6%
4
Kraft Heinz
Kraft Heinz 0.4%
Hormel Hormel 0.3% 30,000 Sq. Ft Manhattan Beach
Project Innovation Center
Tyson Tyson 0.2% (El Segundo, CA)
Beyond Meat’s products are driven by proprietary technology and a relentlessly focused innovation team
1 Parent company of Morningstar Farms.
2 Parent company of Smithfield.
3 Parent company of Gardein.
4 Parent company of Boca Burger. 5
R ECENT N OTABLE U PDATES

Our Approach to Product and Strategy has Made Us a
    Leading Disruptor in the Meat Category
                     We are Disrupting the
                                                                                                                  Net Revenues ($ millions)
                    Largest Category in Food
                                                                                                                    $297.9
            $1.4tn                                   $270bn
     Size of the Global Meat                    Size of the U.S. Meat
            Category¹                                Category¹

          Beyond Meat is the Future of Protein
                                                                                                     YoY Growth
                                                                                                        239%
               239%                                     ~3x
       2018 FY – 2019 FY                    Increase in Manufacturing
      Revenue YoY Growth                            Capacity2

                                                                                                                                                 $97.1
        ~25,000                                    ~34,000                                          $87.9
        Stores                                     Outlets                                                                         YoY Growth
                                                                                                                                     141%
              U.S.                                    U.S.
          Retail Rollout                       Foodservice Rollout
                                                                                                                                   $40.2
        ~35,000                                     ~94,000
        Outlets                                      Total
     International Retail and
                                                    Outlets
                                                      Worldwide
                                                                                                     2018            2019        2019 YTD       2020 YTD
      Foodservice Rollout3

1   According to Fitch Solutions Macro Research, a division of Fitch Solutions, research data, August 6, 2018.
2   As of end of Q1 2020, compared to end of Q1 2019.
3   Includes Canada.
                                                                                                                                                           7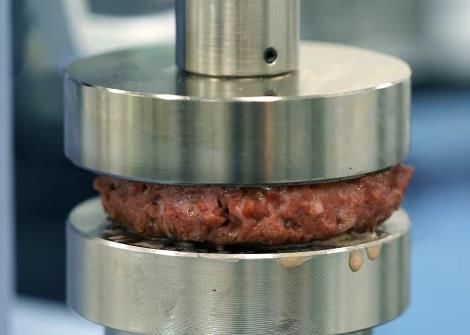
Continued Momentum In Distribution Growth and Awareness

1 Totals may not add up due to rounding.
2 Presentation of International distribution outlets now includes Canada, which was historically combined with US distribution.
3 Unaided brand awareness represents results of the answer to, “what brands, if any, come to mind when you think of a meat alternative product?” At IPO based on Oct 2018 survey of 1,004

   people, January 2020 based on January 2020 survey of 1,001 people.
4 Total brand awareness represents the answer to “which of the following meat alternative brands have you heard of before today?” and “which of the following other brands have you heard
                                                                                                                                                                                            8
of before today?” At IPO based on Oct 2018 survey of 1,004 people, January 2020 based on January 2020 survey of 1,001 people.
The Beyond Meat Brand Has Maintained Its Solid Momentum
In U.S. Retail
                Velocity Growth and Market Share Gains Continue to Drive Strong Performance in U.S. Retail Channels

                          Beyond Meat Velocity Growth (YoY) 1                                                 Beyond Meat Market Share Growth (YoY) 1
                                            ($/TDP)

                                                                        195%

                    168%
                                              158%                                                         +901 bps

                                                                                                                            +774 bps
                                                                                                                                             +711 bps

                Last 52 Wks               Last 12 Wks                Last 4 Wks                           Last 52 Wks      Last 12 Wks       Last 4 Wks

Source: SPINS data (U.S. MULO, US Natural) through 22-Mar-2020
1 Includes aggregate data for Beyond Meat products across all Frozen and Refrigerated Plant-Based Meats

                                                                                                                                                          9
Beyond Meat is Building a Track Record of Success
We are Poised to Achieve Growth Across all of our Distribution Channels
US Retail US Foodservice International1
Net Revenues ($ millions) Net Revenues ($ millions) Net Revenues ($ millions)
$129
$98
$70
$25
$17
$50 $50
$12
$21 $23
$19
$9
2018 2019 2019 YTD 2020 YTD 2018 2019 2019 YTD 2020 YTD 2018 2019 2019 YTD 2020 YTD
Select Customers Select Customers and Distributors Select Customers and Distributors
Select Highlight Select Highlight Select Highlight
Retail points of Foodservice International
distribution outlets across Retail and
~17,000 ~25,000 across the United ~12,500 ~34,000 the United ~1,650 ~35,000 Foodservice
States carrying States carrying outlets carrying
March Beyond Meat March Beyond Meat March Beyond Meat
At IPO At IPO At IPO
products products 2020 products
2020 2020
10Recent Notable Updates
Beyond Meat Rapid & Relentless Innovation Program Is Designed to Make Our Existing
Products Obsolete, Generate New Products & Platforms, and Serve A Widening Circle of
Customers
Customers Products International
We continue to expand our We continue to focus on innovation, Now available
foodservice partnerships, with the including rollout of both new and
announcement of several new or enhanced product offerings
in 74 countries worldwide (ex. U.S.),
expanded customer relationships v
including 9 new countries since Feb. 20201
5 new product launches /
Other Notable Highlights:
enhancements over the past 12 months
] • BYND made its first entry into mainland
April 2020 February 2020 China through Starbucks China partnership
China Canada
National Launch National Launch
Beyond Breakfast Improved
Sausage Beyond Sausage International Supply Chain
(2020) (2020)
Jan-Apr 2020
Canada
Limited Test
February 2020
Expanded Test
1st co-manufacturing facility
outside of the United States
Beyond Fried (Netherlands)
Improved
January 2020 Chicken
January 2020 Beyond Burger
Canada (2020)
US & Canada (2019)
Expansion
Expansion
November 2019 December 2019 Beyond Beef Completed on schedule
National Launch Expanded Offering (2019) - Q1 2020
1 Refers to incremental international distribution gained during the period from February 04, 2020 to March 28, 2020.
11F INANCIAL U PDATE
Q1 2020 Performance Update
Highlights
Net revenues increased 141% to $97.1
million, driven by growth in volume due to
expansion in the number of distribution
points both domestically and abroad,
higher sales velocities and contribution
from new products introduced subsequent
to the first quarter of 2019
Gross margin expanded 1,200 bps
primarily due to an increase in the volume
of products sold, production efficiency
improvements, direct materials and
packaging input cost savings, and direct
labor efficiencies
Net income improved to $1.8 million
driven by the improvement in gross profit,
partially offset by increased costs
associated with higher personnel levels,
public company administrative costs,
higher share-based compensation,
increases in marketing expense, higher
restructuring expenses and continued
investment in innovation
Adjusted EBITDA as a % of net revenue
increased by 1,840 bps year-over-year
1 See appendix for reconciliation of Adjusted EBITDA to net income (loss) and Adjusted EBITDA as a % of net revenues to net income (loss) as a % of net revenues.
13Net Revenue Growth by Channel
Net Revenues by Channel Highlights
YoY Growth (%) Strong revenue performance,
with multiple levers for
2018 2019 2019 YTD 2020 YTD
growth:
US
97 % 160 % 110 % 157 %
Retail ― Brand awareness
US continuing to build
231 % 240 % 167 % 156 % momentum
Foodservice
International
445 % 1,431 % 200 % 4,934 % ― Continue growing total
Retail
outlets and growing sales
International
1,859 % 403 % 6,617 % 57 % at existing ~94,000 outlets
Foodservice as of March 2020
Consolidated 170 % 239 % 215 % 141 %
― Continue to build on strong
($ millions) partnerships with ~51,000
foodservice outlets as of
March 2020 1
$ 83
― International market
expansion
$ 15
$ 70
― New product launches
³
$ 19 Continued investment in
$ 16 infrastructure and capabilities
$6 ³ to support future growth
$ 21 $1 $ 129 $ 12 $ 23
$ 50 $9 $0 $ 50 Continue to support future
$ 19 revenue growth through
2018 2019 2019 YTD 2020 YTD
incremental investments in
marketing and innovation
US Retail US Foodservice International Retail International Foodservice
1
14
Includes all foodservice outlets across US & InternationalImproving Margin Profile
Gross Profit and Margin OpEx and OpEx % of Net Revenues Highlights
Gross Margins Operating Expenses² as % of Net Revenues
Gross margin benefits from
volume leverage, production
efficiency improvements, direct
20.0% 33.5% 26.8% 38.8% 40.0% 37.0%
material and packaging cost
savings, and direct labor
R&D as % of Net Revenues efficiencies
($ millions)
Continued optimization of supply
11.2% 6.4% chain capabilities and
manufacturing efficiency
($ millions)
$36 ― As we scale, our increased
purchasing power is driving
improved direct material and
packaging costs
― Increased manufacturing
capacity and throughput
$30 gains continue to drive direct
$16 labor efficiencies
R&D efforts focused on
enhancements to our product
$12
formulations, production
processes and the development
$6 of new products
$4
2019 YTD 2020 YTD
2
R&D SG&A
1 See appendix for reconciliation of Adjusted EBITDA to net income (loss).
2 Includes restructuring expenses.
15A PPENDIX
Reconciliation of Non-GAAP Financial Measures

                                                               Reconciliation to Adjusted EBITDA (unaudited)

1   In connection with the termination of an exclusive supply agreement with a co-manufacturer in May 2017, we recorded restructuring expenses related to the impairment write-off of long-lived assets,
    primarily comprised of certain unrecoverable equipment located at the co-manufacturer’s site and company-paid leasehold improvements to the co-manufacturer’s facility, and legal and other
    expenses associated with the dispute with the co-manufacturer.
2   Consists of additional charges related to inventory losses incurred as a result of termination of an exclusive supply agreement with a co-manufacturer recorded in cost of goods sold.
3   Consists of additional charges incurred as a result of termination of an exclusive supply agreement with a co-manufacturer recorded in selling, general and administrative expenses.
                                                                                                                                                                                                   17
®
You can also read