THE POTENTIAL ROLE OF MYOM1 AND ATGL GENES IN PIG PRODUCTION IMPROVEMENT* * - SCIENDO
←
→
Page content transcription
If your browser does not render page correctly, please read the page content below
Ann. Anim. Sci., Vol. 21, No. 3 (2021) 833–842                  DOI: 10.2478/aoas-2020-0102

        The potential role of MYOM1 and ATGL genes in pig
                  production improvement* *

 Katarzyna Ropka-Molik1♦, Katarzyna Piórkowska1, Agata Piestrzyńska-Kajtoch1, Agnieszka Fornal1,
                       Zofia Zyskowska2, Angelika Pruś2, Mirosław Tyra3

    1
     Department of Animal Molecular Biology, National Research Institute of Animal Production,
                                   32-083 Balice n. Kraków, Poland
     2
       Faculty of Biotechnology and Horticulture, University of Agriculture, Al. 29 Listopada 54,
                                       31-425 Kraków, Poland
           3
             Department of Pig Breeding, National Research Institute of Animal Production,
                                   32-083 Balice n. Kraków, Poland
                          ♦
                            Corresponding author: katarzyna.ropka@iz.edu.pl

                                              Abstract
In the present study, two missense variants within ATGL (rs331307082) and MYOM1 (rs326001585)
genes were tested for their potential usage as genetic markers related to pig production traits. The
genotyping was performed on 519 pigs representing 990 synthetic sire line. The association analy-
sis indicated that ATGL gene affected the panel of fattening parameters (test daily gain, age at
slaughter), meatiness traits (meat percentage in the carcasses; the weight of loin, ham and primary
cuts, and loin eye area), and meat quality characteristics (water exudation). In turn, MYOM1
polymorphism was related to loin weight, the weight of primary cuts and weight of loin backfat.
Pigs with AA genotype were characterized by significantly higher loin and primary cut weights
compared to opposite homozygotes GG (P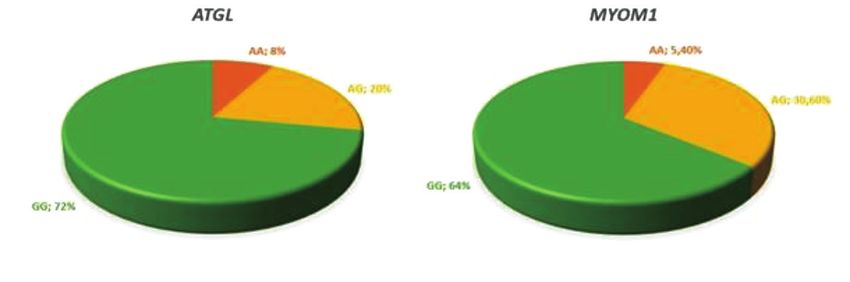
834                               K. Ropka-Molik et al.

other hand, attempts to enhance pork quality have resulted in losing a satisfactory
level of meatiness obtained during long-term selection (Orzechowska et al., 2010).
Thus, scientific efforts are made to identify and apply genetic markers which will
allow performing selection toward modification of one trait without changing levels
of the others.
     Despite trying to apply genomic selection in the commercial pig breeding (Knol
et al., 2016), the single genes are still being tested for their usefulness in breed-
ing work and importance for accelerating the livestock progress. The limitation of
genomic selection in pigs is still a relatively high cost of single analysis (Samorè and
Fontanesi, 2016). The high-throughput SNP data obtained by RNA sequencing was
applied to identify the set of genes with a potential high effect on essential produc-
tion traits in the pig industry (Piórkowska et al., 2018). Among others, two missense
variants within MYOM1 and ATGL genes were detected and proposed as a candidate
for carcass parameters, backfat thickness and selected fattening traits (Piórkowska et
al., 2018). The MYOM1 gene encoding for myomesin-1, is responsible for sarcomere
assembly via stabilization of the three-dimensional conformation of the thick fila-
ments (Lange et al., 2005). Myomesin, together with obscurin and obscurin-like-1
proteins form the M-line and are responsible for the regulation of force distribution
exerted by the thick filaments during contraction (Fukuzawa et al., 2008). Moreover,
myomesin in a complex with myosin and titin anchors thick filaments in the A-band
(Agarkova and Perriard, 2005). In turn, the ATGL gene (also known as PNPLA2)
encodes adipose triglyceride lipase, which catalyzes the degradation of triacylglyc-
erols of lipid droplets in the adipocytes and non-adipocyte cells (Zimmermann et al.,
2004). This lipase is involved in energy homeostasis by playing a role in the body’s
response to starvation. Under conditions of reduced caloric intake, ATGL activates
triglyceride hydrolysis ensuring delivery of free fatty acids to other tissues, which
can be used as an energy source (Smirnova et al., 2006).
     Taking into account the important function of both genes and previous findings,
we hypothesized that MYOM1 and ATGL genes could be considered as potential
genetic markers related to pig production traits. In the present study, the novel,
mid-density SNP genotyping method using the Quant Studio 12K Flex Real-Time
PCR System with the Open Array Block was applied to determine genotypes within
MYOM1 and ATGL genes. The suitability of MYOM1 and ATGL as markers was
tested in pigs of 990 line that were selected for meat content and improved fattening
traits.

                               Material and methods

    Animals
    The analysis was carried out on 519 female pigs representing 990 synthetic line.
The pigs were characterized by low relationship (4.20 individuals per sire and 1.54
per dam). The analyzed pig line was established in Poland in the 1970s based on
six breeds (Polish Large White, Belgian Landrace, Duroc, Hampshire, Landrace of
German and British origin) to obtain the top sire line for crossing in pig breeding.
MYOM1 and ATGL as gene markers in pig breeding 835
The 990 individuals are used in the pig meat industry to produce fatteners character-
ized by high meatiness parameters together with good meat quality characteristics
and fattening performance (Różycki and Dziadek, 2012). In the Polish populations
of sire breeds, the 990 line ranks second in terms of usage behind the Pietrain pigs.
All investigated pigs were maintained at two breeding stations under the same
environmental and feeding conditions. Pigs were kept in individual pens, fed ad
libitum from 30 kg to 100 kg (±2.5 kg) and weighed daily throughout the fattening
period. When pigs reached 100 kg (±2.5 kg), they were slaughtered, and after 24 h
of chilling, right half-carcass was dissected. For each animal the panel of traits has
been evaluated: test daily gain (g/day); feed: gain ratio (kg/kg) and age at slaughter
(day); carcass yield (%); ham/loin weight (kg); the weight of primary cuts (kg); loin
eye area (cm2); meat percentage in carcass (%); ham weight without fat and skin
(kg); average backfat thickness (cm); the weight of loin backfat (kg). Moreover, the
meat quality characteristics were measured: meat color (L* – lightness, a* – redness,
and b* – yellowness; Minolta CR-310 spectrophotometer), pH estimated in loin and
ham muscles (longissimus dorsi and semimembranosus; respectively) measured at
45 min (pH45) and 24 h (pH24) after slaughter (pH-meter pH-STAR CPU; Mat-
thäus, Pöttmes, Germany), IMF – intramuscular fat content (the Soxhlet method),
and WE – water exudation (the Grau–Hamm method). The exact procedure of fatten-
ing parameters, slaughter procedure and production traits evaluation was described
previously (Tyra and Żak, 2013). All pigs were free of RYR11843T allele.
Genotyping
The allelic discrimination method was used to determine ATGL c.392G>A and
MYOM1 c.2539G>A polymorphism. The TaqMan MGB Assays were designed for
rs331307082 (ATGL) and rs326001585 (MYOM1) (Table 1) on the Custom TaqMan®
OpenArray® Real-Time PCR Plate with Genotyping Assays (ThermoFisher Scien-
tific, product id 4471115). Each DNA sample (2.8 µl) was mixed with the TaqMan™
OpenArray™ Genotyping Master Mix (2.8 µl). The 47 DNA samples and one nega-
tive control (both with Master Mix) were placed on each OpenArray (OA) plate with
the assistance of the OpenArray™ AccuFill™ System (Applied Biosystems). Next,
the OA plates were run in the Quant Studio 12K Flex Real-Time PCR System (Ap-
plied Biosystems) with the OpenArray Block according to standard manufacturer
protocol. The results were checked and analyzed in the TaqMan Genotyper Software
v1.4 (Applied Biosystems) after the OA plate’s quality analysis (QC image).
Statistical analysis
The associations between evaluated traits and both SNPs in ATGL and MYOM1
genes were estimated using General Linear Model (GLM) procedure with Tukey’s
test (SASv.8.02), and the model was: Yij= µ+ di+ bj+ a(xij) + eij, where Yij is the obser-
vation, µ is the overall average, di is the fixed effect of the i genotype, bj is the fixed
effect of the j test station, a(xij) is the covariate with the weight of the half-carcass
for the performance of carcass traits only and eij is the random error. To estimate sig-
nificant differences between means, the least square means (LSM) test was used. All
results are shown as LSM±SE.836 K. Ropka-Molik et al.
Table 1. The detailed SNPs information, genotyping primers and probes
Gene ATGL (PNPLA2) MYOM1
SNP ID rs331307082 rs326001585
Location chr. 2:515397 chr. 6:103536375
Strand forward forward
Variants G/A G/A
Arg/His Val/Ile
Reference ENSSSCT00000014036.4:c.392G>A ENSSSCT00000004091.4:c.2539G>A
ENSSSCP00000013651.3:p.Arg131His ENSSSCP00000003999.4:p.Val847Ile
NC_010444.4:g.515397G>A NC_010448.4:g.103536375G>A
Primers F: TCCGACGGCGAAAATGTCAT F: GGGCTGAAATTACAGGCTATTACGT
R: GGCACCCACCTGGATGAG R: GCTTTGATGTTGGCTTCTCTCCAT
TaqMan MGB CATAACCCGCTTCGCC (VIC) ACTATCGTGAAGTAATTG (VIC)
probes CATAACCCACTTCGCC (FAM) CTATCGTGAAATAATTG (FAM)
Results
Genotype and allele distribution
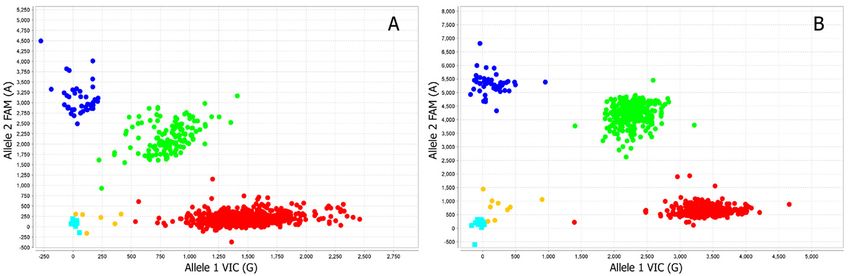
The allelic discrimination method allowed identifying all three genotypes for
both ATGL c.392G>A and MYOM1 c.2539G>A polymorphisms (Figure 1). The call
rate for ATGL was 99.4% and for MYOM1 99.0%, respectively.
Figure 1. Allelic Discrimination Plot (TaqMan Genotyper Software v1.4); A – ATGL c.392G>A;
B – MYOM1 c.2539G>A; red dots – homozygotes GG; blue dots – homozygotes AA; green dots –
heterozygotes G/A; yellow dots – lack of amplification; light blue squares – negative controls
For ATGL polymorphism, the most abundant were GG pigs (72%), while the op-
posite homozygotes were only 8%. Similar genotype distribution was obtained for
MYOM1 c.2539G>A where GG pigs represent 64% of the whole population and AA
genotype was carried by 5.4% of the pigs. Minor allele frequency (MAF) was 0.18
for ATGL and 0.21 for MYOM1 polymorphisms. According to both polymorphisms
the analyzed population was in Hardy-Weinberg equilibrium.Table 2. The significant association of MYOM1 and ATGL polymorphisms and carcass characteristics
MYOM1 c.2539G>A genotypes ATGL c.392G>A genotypes GLM significance
Traits
AA AG GG AA AG GG MYOM1 ATLG
Loin weight (kg) 10.56±0.95 a 7.96±0.38 b 8.27±0.27 b 8.01±0.74 AB 9.52±0.46 A 7.92±0.26 B * **
Loin eye area (cm2) 52.7±0.1 52.0±0.4 52.1±0.3 55.3±0.9 A 52.6±0.6 AB 51.6±0.3 B ***
Weight of primary cuts (kg) 23.9±0.4 a 23.1±0.2 ab 22.7±0.1 b 23.4±0.3 ab 23.4±0.2 a 22.7±0.1 b ** ***
Meat percentage in carcass (%) 58.6±0.5 58.1±0.2 57.7±0.1 58.7±0.4 a. 58.0±0.2 ab. 57.6±0.1 b. . *
Ham weight without fat and skin (kg) 8.77±0.10 8.69±0.04 8.64±0.03 8.88±0.08 a 8.70±0.03 ab 8.63±0.02 b **
Average backfat thickness (cm) 1.86±0.06 ab. 1.85±0.02 b. 1.92±0.01 a. 1.78±0.05 b. 1.90±0.03 a. 1.91±0.02 a. . .
Weight of loin backfat (kg) 1.73±0.09 b 1.83±0.03 b 1.94±0.02 a 1.84±0.07 1.88±0.04 1.91±0.02 ***
The values are presented as LSM ± S.E; the means with letters differ significantly between genotypes (a, b – P≤0.05; A, B – P≤0.01); *P≤0.05; **P≤0.01; ***P≤0.001; P≤0.1.
Table 3. The significant association of MYOM1 and ATGL polymorphisms and fatness traits
MYOM1c.2539G>A genotypes ATGLc.392G>A genotypes GLM significance
Traits
AA AG GG AA AG GG MYOM1 ATLG
MYOM1 and ATGL as gene markers in pig breeding
Test daily gain (g/day) 863.9±21.4 876.6±8.6 897.5±6.2 844.9±16.6 b 877.8±10.4 ab 898.0±5.9 a **
Feed: gain ratio (kg/kg) 3.02±0.07 2.98±0.03 2.92±0.02 3.04±0.05 2.96±0.03 2.92±0.02
Age at slaughter (day) 179.3±2.9 180.0±1.6 179.1±0.8 185.0±2.2 a 177.9±1.4 b 179.2±0.8 b *
WHC 33.9±1.98 33.2±0.84 34.5±0.66 35.6±1.67 a 36.5±1.06 ab 33.1±0.61 b **
The values are presented as LSM ± S.E; the means with letters differ significantly between genotypes (a, b – P≤0.05; A, B – P≤0.01); *P≤0.05; **P≤0.01; ***P≤0.001; P≤0.1.
837838
Table 4. The significant association of MYOM1 and ATGL polymorphisms and meat quality traits
MYOM1c.2539G>A genotypes ATGLc.392G>A genotypes GLM significance
Traits
AA AG GG AA AG GG MYOM1 ATLG
WE 33.9±1.98 33.2±0.84 34.5±0.66 35.6±1.67 a 36.5±1.06 ab 33.1±0.61 b **
*L 54.8±1.3 54.6±1.0 54.1±0.9 54.5±1.2 54.2±1.1 54.3±0.9
*a 16.6±0.8 16.3±0.6 16.3±0.6 16.6±0.7 16.3±0.7 16.2±0.6
*b 3.9±0.7 4.0±0.5 3.8±0.5 4.0±0.6 3.4±0.5 3.9±0.5
pH45loin 6.28±0.19 6.50±0.09 6.37±0.06 6.37±0.17 6.39±0.10 6.42±0.06
pH24loin 5.57±0.04 5.64±0.02 5.66±0.01 5.65±0.04 5.65±0.02 5.66±0.01
pH45ham 6.43±0.14 6.54±0.14 6.50±0.14 6.43±0.15 6.55±0.14 6.51±0.14
K. Ropka-Molik et al.
pH2ham 6.43±0.15 6.54±0.14 6.50±0.14 5.59±0.09 5.57±0.09 5.58±0.08
IMF 1.83±0.18 1.73±0.14 1.66±0.14 1.75±0.17 1.67±0.15 1.70±0.14
The values are presented as LSM ± S.E; the means with letters differ significantly between genotypes.
(a, b – P≤0.05); WE – water exudation; L* – luminosity, a* – redness, b* – yellowness; pH45 and pH24 – pH measured 45 min and 24 h after slaughter in longissimus dorsi
(loin) or semimembranosus (ham) muscles. IMF – intramuscular fat content.MYOM1 and ATGL as gene markers in pig breeding 839
Association with production traits
ATGL c.392G>A polymorphism
The c.392G>A missense variant within ATGL gene showed significant associa-
tion with all analyzed slaughter traits corresponding to meatiness: meat percentage
in the carcass (%); the weight of loin, ham and primary cuts, and loin eye area (Ta-
ble 2). Compared to opposite homozygotes, the AA pigs had 3.7 cm2 greater loin eye
area (P840 K. Ropka-Molik et al.
Discussion
The development of research methods in molecular biology has been closely
related to the advances in agriculture, both in livestock breeding and in plant cultiva-
tion. The efforts are made to apply the new developing research methods to allow
identifying candidate genes and mutations related to quantitative traits of breeding
importance. The standard selection assigned with the use of DNA marker linkage
with production traits has a great potential in increasing the sustainability and ef-
ficiency of animal production (Beuzen et al., 2000).
Both investigated genes, ATGL and MYOM1, were previously proposed as can-
didate genes in pig genome associated with meat quality and carcass characteristics
(Piórkowska et al., 2018). Variant calling based on RNA-seq data allowed us to show
the significant polymorphisms within transcripts potentially related to pig production
traits. Among them, two missense variants were identified – ATGL: p.Arg131His and
MYOM1: p.Val847Ile. Even though presented genes are playing an important role in
the processes related to lipid metabolism and energy homeostasis (ATGL) as well as
skeletal muscle development (MYOM1), they have not been widely investigated in
terms of pig production traits. The recent report by Piórkowska et al. (2018) indi-
cated that these genes could determine selected phenotypic data in pigs.
The present study showed that polymorphism within ATGL gene was significantly
associated with key carcass characteristics: loin eye area, ham and loin weights, meat
percentage in carcasses, backfat thickness, and selected fattening traits. The pigs
with AA genotype were characterized by the highest values in most of the presented
parameters and the lower backfat thickness, while they did not differ in meat quality
from the other genotypes. This is important finding since the use of c.392G>A mis-
sense variant in breeding practice can allow selecting pigs to improve meat content
without decreasing its quality. However, there is one limitation of selection toward
c.392G>A, because AA animals presented lowered daily gains. According to current
trends in pig breeding, the fattening traits are the most decisive economic features
in pig production (Mirilović et al., 2016). Although AA pigs had lower daily gains
and the highest age of slaughter, detected differences between opposite homozygotes
were low (54 g and 5.8 days, respectively). Based on such comprehensive analysis,
we hypothesized that using ATGL SNP can bring benefits in the possibility of im-
proving carcass meatiness in terms of low fat and maintaining meat quality at current
levels. The study of Piórkowska et al. (2018) performed on native Puławska and
Polish Landrace pigs, confirmed that AA animals in terms of c.392G>A SNP were
characterized by lower backfat thickness. In pigs, the transcription analysis of ATGL
gene showed its overexpression in backfat tissue compared to other tissues (Dai et
al., 2011). Moreover, the association study performed for c.392G>A polymorphism
strongly indicated that it affects fat deposition and carcass characteristics in pigs (Dai
et al., 2011). Similarly, as in the current study, the authors observed that homozygote
pigs (AA) were characterized by higher meatiness parameters (loin eye area, lean
meat percentage) and lower fatness (average backfat thickness). Authors proposed
c.392G>A polymorphism as a candidate marker for fat deposition traits in pigs. The
significant relation of ATGL gene with pig production traits was also pinpointed byMYOM1 and ATGL as gene markers in pig breeding 841
Dai et al. (2016), who showed that polymorphisms localized upstream 5’UTR region
of ATGL gene could influence meat and fat contents.
In turn, for MYOM1 gene our results as well confirmed a significant effect of
c.2539G>A polymorphism on evaluated pig production parameters. Likewise, for
ATGL gene, for c.2539G>A SNP one genotype – AA was characterized by signifi-
cantly higher meatiness traits (loin weight and weight of primary cuts) and lower
average backfat thickness (trend observed). The most important finding allowing the
potential use of this missense variant in breeding practice is a fact that we observed
positive association of c.2539G>A MYOM1 with carcass features and lack of the
effect on pork quality and fattening traits. Such an approach allows performing one-
sided selection to improve specific carcass traits without deterioration of the other
pig production characteristics. The above breeding strategy can be applied for pig
breeds which represent an insufficient level of meatiness, but desirable meat quality.
The significance of MYOM1 polymorphism with backfat thickness, intramuscular
fat content and pork texture parameters were previously indicated (Piórkowska et
al., 2018). According to involvement in sarcomeric structure, myomesin 1 is one of
the proteins determining the muscle fiber type (Agarkova and Perriard, 2005). It has
been established that muscle fiber distribution due to differences in energy metabo-
lism, lipid and glycogen storage strongly affects pork quality (Karlsson et al., 1999)
and growth performance (Lee et al., 2016). Moreover, the disruption of each protein
(including myomesin 1) involved in M-line structure can result in the degeneration of
the sarcomere (Fukuzawa et al., 2008; Prill et al., 2019). In the present research, the
significant association of c.2539G>A polymorphism with lean meat characteristics
was detected. It can be related to a specific function of myomesin-1 and obtained cor-
relation suggested that MYOM1 should be investigated for use in breeding practice.
In pig breeding, there is still a need to search for single genes with a high effect
on phenotypic traits due to the relatively low cost of such marker evaluation for one
individual. The present study performed on synthetic pig line 990 that is used as
a significant sire component, allows us to propose two polymorphisms within
MYOM1 and ATGL genes which may be used in pig selection to obtain appropri-
ate meatiness and fatness level in carcasses without decreasing meat quality. The
genetic marker assisted selection can bring measurable financial benefits in a shorter
time and in a more precise way than selection based only on phenotypic features.
However, further study should be performed to confirm such a correlation in the
other pig breeds.
Conflicts of interest
The authors declare no conflicts of interest.
Ethics approval and consent to participate
The research was performed on biological material derived from pigs maintained
and slaughtered in the Pig Test Station (National Research Institute of Animal Pro-
duction). In the Test Station pigs are slaughtered, dissected and after carcass evalua-
tion, meat is standardly intended for consumption. Therefore, our research does not
require the approval of the Animal Experimentation Committee.842 K. Ropka-Molik et al.
References
A g a r k o v a I., P e r r i a r d J.C. (2005). The M-band: An elastic web that crosslinks thick filaments in
the center of the sarcomere. Trends Cell Biol., 159: 477–485.
B e u z e n N.D., S t e a r M.J., C h a n g K.C. (2000). Molecular markers and their use in animal breed-
ing. Vet. J., 160: 42–52.
D a i L.H., X i o n g Y.Z., J i a n g S.W., C h e n J.F. (2011). Molecular characterization and association
analysis of porcine adipose triglyceride lipase PNPLA2 gene. Mol. Biol. Rep., 382: 921–927.
D a i L., C h u X., L u F., X u R. (2016). Detection of four polymorphisms in 5′ upstream region of
PNPLA2 gene and their associations with economic traits in pigs. Mol. Biol. Rep., 4311: 1305–1313.
F u k u z a w a A., L a n g e S., H o l t M., V i h o l a A., C a r m i g n a c V., F e r r e i r o A., U d d B.,
G a u t e l M. (2008). Interactions with titin and myomesin target obscurin and obscurin-like 1 to the
M-band – implications for hereditary myopathies. J. Cell Sci., 12111: 1841–1851.
K a r l s s o n A.H., K l o n t R.E., F e r n a n d e z X. (1999). Skeletal muscle fibres as factors for pork
quality. Lives. Prod. Sci., 602: 255–269.
K n o l E.F., N i e l s e n B., K n a p P.W. (2016). Genomic selection in commercial pig breeding. Anim.
Front., 61: 15–22.
L a n g e S., H i m m e l M., A u e r b a c h D., A g a r k o v a I., H a y e s s K., F ü r s t D.O., P e r -
r i a r d J.C., E h l e r E. (2005). Dimerisation of myomesin: implications for the structure of the
sarcomeric M-band. J. Mol. Biol., 3452: 289–298.
L e e S.H., K i m J.M., R y u Y.C., K o K.S. (2016). Effects of morphological characteristics of muscle
fibers on porcine growth performance and pork quality. Korean J. Food Sci. Anim. Resour., 365:
583–593.
M i r i l o v i ć M., Ve l e b i t B., D j u r i ć S., Ve j n o v i ć B., D i m i t r i j e v i ć M., T a j d i ć N.,
R o g o ž a r s k i D., (2016). Determination of the economic effects in intensive production of pig-
lets. Mac. Vet. Rev., 39: 233–238.
O r z e c h o w s k a B., T y r a M., M u c h a A. (2010). Effect of growth rate on slaughter value and meat
quality of pigs. Rocz. Nauk. PTZ, 64: 341–351.
P i ó r k o w s k a K., Ż u k o w s k i K., R o p k a - M o l i k K., T y r a M. (2018). Detection of genet-
ic variants between different Polish Landrace and Puławska pigs by means of RNA-seq analysis.
Anim. Genet., 493: 215–225.
P r i l l K., C a r l i s l e C., S t a n n a r d M., W i n d s o r R e i d P.J., P i l g r i m D.B. (2019). Myo-
mesin is part of an integrity pathway that responds to sarcomere damage and disease. PLOS ONE,
1410: e0224206.
R ó ż y c k i M., D z i a d e k K. (2012). Creation and use of line 990 pigs for fattener production. Wiad.
Zoot., 3: 27–36.
S a m o r è A.B., F o n t a n e s i L. (2016). Genomic selection in pigs: state of the art and perspectives.
Italian J. Anim. Sci., 152: 211–232.
S m i r n o v a E., G o l d b e r g E.B., M a k a r o v a K.S., L i n L., B r o w n W.J., J a c k s o n C.L.
(2006). ATGL has a key role in lipid droplet/adiposome degradation in mammalian cells. EMBO
Reports, 71: 106–113.
T y r a M., Ż a k G. (2013). Analysis of the possibility of improving the indicators of pork quality
through selection with particular consideration of intramuscular fat (IMF) content. Ann. Anim. Sci.,
13: 33–44.
Z i m m e r m a n n R., S t r a u s s J.G., H a e m m e r l e G., S c h o i s w o h l G., B i r n e r - G r u e n -
b e r g e r R., R i e d e r e r M., L a s s A., N e u b e r g e r G., E i s e n h a b e r F., H e r m e t t e r A.,
Z e c h n e r R. (2004). Fat mobilization in adipose tissue is promoted by adipose triglyceride lipase.
Science, 3065700: 1383–1386.
Received: 8 VI 2020
Accepted: 7 IX 2020You can also read