Kaitlyn E. Johnson, Spencer Woody, Remy Pasco, Cameron Matsui, Michael Lachmann, Spencer J. Fox, Lauren Ancel Meyers - The University of Texas at ...
←
→
Page content transcription
If your browser does not render page correctly, please read the page content below
Kaitlyn E. Johnson, Spencer Woody, Remy Pasco, Cameron Matsui,
Michael Lachmann, Spencer J. Fox, Lauren Ancel Meyers

The University of Texas at Austin
COVID-19 Modeling Consortium
utpandemics@austin.utexas.edu
Early introductions and projections of the B.1.1.7 SARS-CoV-2 variant at the University of Texas at Austin February 12, 2021 The University of Texas COVID-19 Modeling Consortium Contributors: Kaitlyn E. Johnson, Spencer Woody, Remy Pasco, Cameron Matsui, Michael Lachmann, Spencer J. Fox, Lauren Ancel Meyers Contact: utpandemics@austin.utexas.edu Summary Recent identification of the highly transmissible novel SARS-CoV-2 variant in the UK (B.1.1.7) has raised concerns for renewed pandemic surges around the globe [1]. While this variant has only recently been identified in the United States, it has been predicted to become dominant as early as March of 2021 [2]. Starting in January of 2021, the University of Texas at Austin (UT) began sequencing positive SARS-CoV-2 specimens to accelerate the detection of novel variants. An estimated 390 to 1,000 University of Texas at Austin (UT) students arrived in Austin infected with SARS-CoV-2 at the start of the spring semester (January 2021) [3]. Some of these cases may have been infected with novel variants [4,5]. Given that UT recently confirmed its first cases of the B.1.1.7 variant among students, we conducted a rapid risk assessment to estimate the prevalence and future spread of the variant within the UT community. As of Friday February 5, 2021, we estimate the following: ● The percent of SARS-CoV-2 infections caused by the B.1.1.7 variant in the UT community is 21.4% [95% CI: 11.2%-35.0%[. ● B.1.1.7 is expected to become the dominant strain in the UT community, comprising greater than 50% of cases, by February 12 [95% CI: Feb 8 – Mar 2]. ● The B.1.1.7 variant may significantly elevate the spread of COVID-19 at UT throughout the spring 2021 semester, especially if spring break spurs a large number of COVID-19 introductions in mid-March. UT COVID-19 Consortium 1 February 12, 2021
The uncertainty in our estimates stems from day-to-day changes in which students and faculty seek testing and from our indirect method of estimating B.1.1.7 prevalence (as we await direct confirmation via sequencing). We do not account for potential biases, including clusters of related cases testing on the same day, that may lead to underestimating uncertainty and overestimating the proportion and growth of B.1.1.7 cases. We are posting these results prior to peer review to provide awareness regarding the immediate risk for a pandemic surge caused by the B.1.1.7 variant that could potentially overwhelm UT resources. Since very few SARS-CoV-2 specimens are sequenced in Austin and throughout Texas, the prevalence of B.1.1.7. outside of UT is highly uncertain. However, we believe that its growing prevalence at UT suggests that it may already be spreading throughout Austin. While our estimates are derived from limited data, they highlight the need for expanded molecular surveillance throughout Texas to rapidly identify B.1.1.7 and future variants and continued mitigation efforts to reduce the transmission of SARS-CoV-2 at UT and throughout Austin. Prevalence of B.1.1.7 variant at UT, as of February 5, 2021 We estimate the proportion of cases that are caused by the B.1.1.7 variant based on positive SARS-CoV-2 samples taken from UT’s Proactive Community Testing program (PCT) [6]. The B.1.1.7 variant contains deletions in the spike protein that result in a lack of detection of one of the three genes in a standard SARS-CoV-2 PCR test, resulting in what is referred to an S gene target failure (SGTF). A specimen is considered a possible B.1.1.7 variant if it lacks detection of the S gene and has a sufficiently high viral load to ensure that this lack of detection was not due to minimal virus presence. All of these SGTF specimens are sent for additional confirmation via sequencing. Our analysis focuses on the numbers of these SGTF specimens among all sufficiently high viral load positives. In the US, approximately 70-90% of these SGTF specimens have been confirmed as variants in January 2021 [7]. We restrict our analysis to SGTF specimens that have been detected since January 2021. Only two such specimens were observed during the fall semester (on November 10 and December 3). Given that B.1.1.7 was likely not introduced in the United States until November of 2020 [7], these two specimens likely had other mutations that caused the SGTF. UT COVID-19 Consortium 2 February 12, 2021
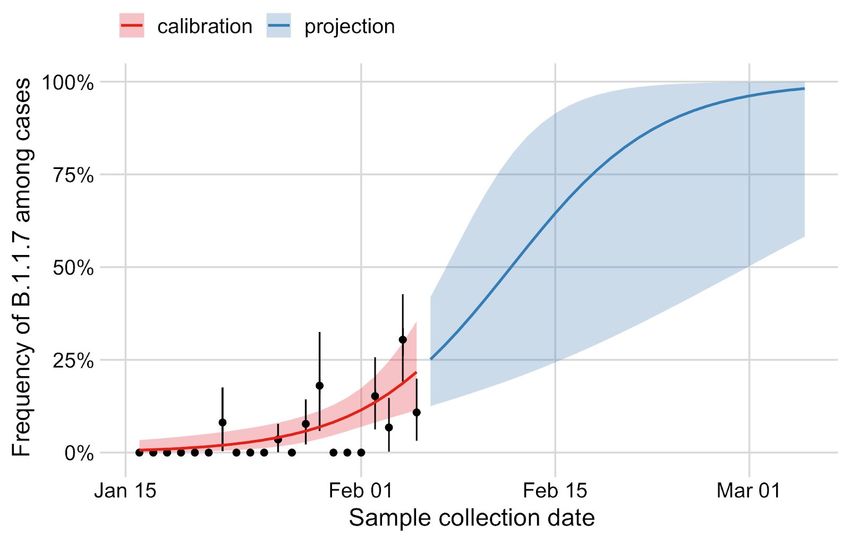
Most returning UT students arrived in Austin by January 16, 2021. We estimate that the proportion of the variant among all COVID-19 cases increased from 2% [95% CI: 0.5%-5.5%] on January 22 to 21.4% [95% CI: 11.2%-35%] on February 5, 2021 (Table 1, Figure 1). These estimates are consistent with 4 [95% CI: 0-33] students infected with the B.1.1.7 variant at the beginning of the semester (January 16) [3]. Our estimates suggest that the variant is increasing in proportion to all cases in the UT community at a relative growth rate of approximately 0.190 [95% CI: 0.079 – 0.313] (Figure 1). We note that this is higher than the growth rate of 0.072 observed in the UK [8,9] and also higher than recent estimates in Florida (0.076) and California (0.057) [1,7]. Table 1. Weekly SGTF and total positive samples reported by UT PCT and estimated percent of COVID-19 cases that are infected by the B.1.1.7 variant in the UT community. Estimates are given as posterior medians and 95% credible intervals for the Friday of the week indicated. Bold rows correspond to future projections based on the observed trend through February 5, 2021. Samples with Total COVID-19 Estimated percent of cases SGTF positive samples infected by B.1.1.7 variant* Estimates Jan. 16 - 22 1 49 2% [0.5-5.5%] Jan. 23 - 29 5 93 6.8% [3.6-11.2%] Jan. 30 - Feb. 5 15 75 21.4% [11.2-35.0%] Projections Feb. 6 - 12 NA NA 50.1% [19.4-80.7%] Feb. 13 - 19 NA NA 78.7% [30.1-97.3%] Feb. 20 - 26 NA NA 93.2% [43-99.7%] Feb. 27 - Mar. 4 NA NA 98.0% [56.8-100%] *Estimated for Friday of the specified week. UT COVID-19 Consortium 3 February 12, 2021
Figure 1. Estimated and projected frequency of the B.1.1.7 variant among positive COVID-19 cases in the UT community from January 15, 2021 to February 5, 2021. Based on the number of samples with SGTF among SARS-CoV-2 positive samples reported by UT Proactive Community Testing (PCT), we estimate the frequency of the B.1.1.7 variant (black points). Vertical error bars represent standard errors. The calibrated logistic growth model (red) and projections from the fitted model (blue) indicate rapid spread of the B.1.1.7 variant relative to the previously circulating (wildtype) virus. Shaded bands indicate 95% credible intervals, which reflect uncertainty in the percent of cases that are S gene dropouts, the percent of S gene dropouts that are B.1.1.7, and the fitted model parameters. UT COVID-19 Consortium 4 February 12, 2021
Projections of COVID-19 spread at UT, spring 2021 We projected the spread of the B.1.1.7 and original (wildtype) variants at UT throughout the spring semester of 2021 using a two-variant epidemiological model. Our projections assume the following: Simulation time period January 16 – May 23, 2021 Number of UT students 30,000 in Austin 2.0% [95% CI: 1.3-3.3%] of UT students are infected [3] State of the COVID-19 pandemic on January 16 14.7% [95% CI: 10.7-20.9%] of UT students are immunized from prior infection [10,11] Prevalence of B.1.1.7 21.4% [95%CI: 11.2-35.0%] of cases are infected by variant on February 5 B.1.1.7 Transmission rate, Estimated from UT PCT data [10,11] January 16-February 5 Relative transmission 56% [95%CI: 50-74%] faster than the wildtype variant rate of B.1.1.7 variant Infection by either variant is fully protective against Immunity future infection by either variant Transmission scenarios after February 5 The wildtype spreads either slower (Rt = 0.9 [95%CI: 0.7-1.1]) or faster (Rt = 1.1 [95%CI: 0.9-1.4]) The B.1.1.7 variant either does or does not spread All eight combinations of alongside the wildtype these three factors Spring break either does or does not increase transmission by 100% for the four days following the break (March 20 – 23) UT COVID-19 Consortium 5 February 12, 2021
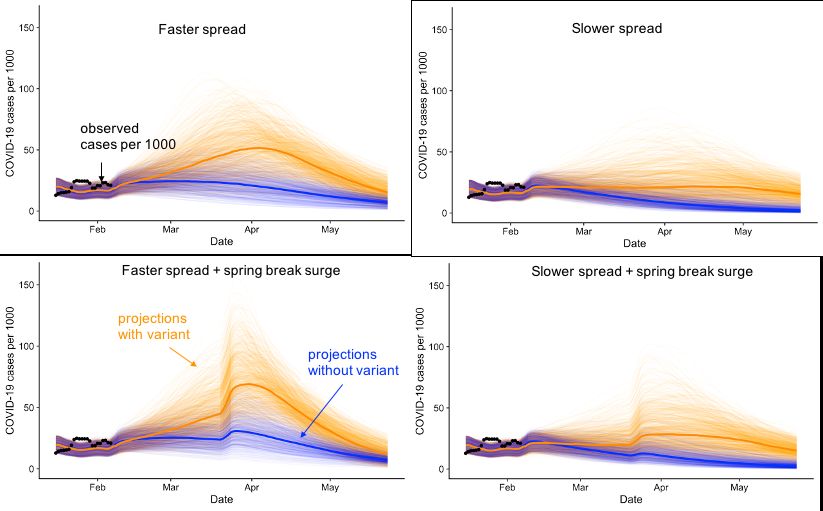
The projections suggest that the rapid emergence of the B.1.1.7 variant in January and February would lead to much higher COVID-19 prevalence in the UT community throughout the spring semester, even if the overall transmission is reduced through mitigation (Figure 2). In the worst-case scenario (high transmission with a spring break surge), we would expect the pandemic wave to peak towards the end of March, with the B.1.1.7 variant more than doubling the number of infections at the peak (70 [95%PI: 29-121] cases per 1000 with the variant versus 31 [95%PI: 16-59] cases per 1000 without). We would also expect the B.1.1.7 variant to nearly double the total number of students infected between January 16 and May 23 under this worst case scenario from 9,151 [95%PI: 4,972-15,028] to 17,730 [95%PI: 10,789-22,267]. Figure 2. Projected COVID-19 cases at UT throughout the spring semester of 2021 under eight transmission and variant scenarios. In all graphs, orange and blue indicate projections with and without the variant, respectively, and the black dots indicate observed cases detected through UT Proactive Community Testing (PCT) per 1000 (seven-day average). The left column of graphs show projections under the faster transmission scenarios (Rt = 1.1 [95%CI: 0.9-1.4]), with (top) and without (bottom) a post spring break surge; the right graphs show the corresponding projections under the slower transmission scenario (Rt = 0.9 [95%CI: 0.7-1.1]). For the spring break surge, we assume the transmission rate doubles from March 20 to 23. For each scenario, we display 500 stochastic simulations, with the bold line indicating the median projected value on each day. UT COVID-19 Consortium 6 February 12, 2021
Limitations We emphasize that our results should be interpreted as rough guideposts based on limited data from UT and very early indications of B.1.1.7 prevalence in the US. We make a number of critical assumptions that may bias our estimates. First, we assume that the SGTF prevalence among positive PCT specimens is representative of SGTF prevalence in the UT community as a whole. PCT testing is voluntary and may be used by students and faculty for surveillance testing, as well as for contact-tracing to test those who have been exposed to known positive cases. Additionally, the location of PCT testing varies each day and is sometimes targeted towards certain populations, and therefore cases tend to cluster geographically by day [12]. These two factors might increase the chance of detecting a cluster of related B.1.1.7 cases that are not indicative of the overall prevalence of the variant in the UT community. This could lead us to overestimate both its local prevalence and growth rate. However, we note that it is unlikely that B.1.1.7 cases are being systematically selected for testing within the data up to this point. All tests collected prior to February 5, 2021 at UT occurred before sequencing confirmation of the presence of B.1.1.7 on campus, and no effort was made to perform more aggressive contact-tracing of these individuals prior to this date. Second, we assume that the probability that a sample with SGTF is caused by the B.1.1.7 variant is a constant value between 70% and 90%, based on national estimates from January [7]. However this probability depends on the B.1.1.7 prevalence. Thus, the share of SGTF samples that are B.1.1.7 may increase through time as the B.1.1.7 variant becomes dominant over other lineages. If this proportion is simultaneously increasing as the proportion of S gene dropouts increases, then we may underestimate the growth rate of B.1.1.7. Third, we note that our indirect estimates of immunity and transmission rates within the UT community are based on limited data from the fall semester of 2020, and thus are highly uncertain. Fourth, we assume that the B.1.1.7 variant will have a transmission advantage over the wildtype variant based on estimates from the UK. The transmission rate of B.1.1.7 in Austin may differ from these estimates, as it will depend on the extent of individual and community efforts to slow transmission as well as the levels of infection-acquired and immune-acquired immunity, which may differ from conditions in the UK during November and December 2020 period. UT COVID-19 Consortium 7 February 12, 2021
Finally, we make the simplifying assumption that infection by either variant renders an individual immune to reinfection by either variant, despite a number of reports of COVID-19 reinfections [13]. While reinfection may become more likely as the virus continues to evolve, scientists believe that past infections provide a reasonable degree (but not full) immunity and that reinfections are not a primary driver of B.1.1.7 transmission [1]. Despite these limitations, we find clear evidence that the B.1.1.7 variant is emerging in the UT community and provide plausible projections for the future spread of the B.1.1.7 variant depending on efforts to slow transmission and prevent new introductions. On February 5, 2021, UT confirmed that two out of the two SGTF specimens sequenced are B.1.1.7. As more sequence confirmation reports become available, we will re-evaluate these assumptions and update our projections. Methods Data The data used in this analysis are pulled directly from de-identified lab results from the Proactive Community Testing (PCT) program at UT. PCT test results are based on the Thermo Fisher TaqPathTM COVID-19 Combo Kit, which targets three SARS-CoV-2 viral regions (N gene, S gene, and ORF1ab). Since samples are deidentified prior to analysis, and some individuals may test more than once, there may be some duplicate individuals in the analyses that could cause deviation from the true population fraction. Test results from positive cases, together with sample collection date and RT-qPCR cycle threshold (Ct) values for all gene targets were used to build the dataset. Ct refers to the number of cycles needed to amplify viral RNA to reach a detectable level. Ct values are inversely related to the amount of virus in a specimen. Specimens are considered SARS-CoV-2 positive when at least two of the three target genes (N, Orf1ab, and S) are detected at a Ct value below 37. Following approaches from prior studies [7,14], we filtered our dataset for positive samples with strong amplification of the N gene (Ct < 28) to increase the sensitivity and specificity of SGTF detection. S gene target failures occur when RT-qPCR fails to detect the virus’ S gene, caused by mutations in the gene. Deletions in the amino acids H69 and V70 in the B.1.1.7 variant result in an SGTF. Samples were considered to be SGTF samples if they were positive UT COVID-19 Consortium 8 February 12, 2021
for both N and Orf1ab, and negative for S. While SGTF can occur due to other mutations, the presence of the SGTF is one of several mutations that distinguish the B.1.1.7 variant from other strains [15,16]. Our analysis of B.1.1.7 variant prevalence focuses on the number of positive samples with SGTF observed out of the total number of high quality (Ct
Here, is the growth rate and is an intercept term. These coefficients can be estimated using existing regression software implementations. However, the main problem is that we do not know the true number of B.1.1.7 samples. Instead we will impute this number using the number of SGTF samples, and the proportion of SGTF samples . This proportion is also not definitively known, so we integrate over uncertainty in estimating the prevalence of the variant. We describe uncertainty in the fraction of B.1.1.7 samples to total SGTF samples by a beta distribution The parameters of this beta distribution were selected so that the 95% central credible interval is approximately (0.7, 0.9), consistent with the findings reported in [7] of percent of B.1.1.7 among S gene dropouts from mid-January 2021 in the U.S. We implement the logistic regression binomial sampling model for as described above, integrating over the uncertainty in via Monte Carlo sampling. One Monte Carlo draw of this model works as follows 1. Draw from the beta distribution described above for the fraction of S gene dropouts that are positive for B.1.1.7 2. Impute B.1.1.7 cases by multiplying S gene dropout cases by the draw from the beta distribution 3. Estimate the logistic growth model using this set of imputed B.1.1.7 case numbers, 4. Finally, project future B.1.1.7 prevalence using the fitted model We combine all draws for projected B.1.1.7 prevalence to integrate over uncertainty in the fraction of B.1.1.7 to S gene dropout samples. Projecting COVID-19 spread using a two-strain epidemiological model The two-strain SEIR model structure is diagrammed in Figure S1 and described in the equations below. The model assumes that the wildtype and variant strains infect a shared pool of susceptibles, all of whom are assumed to be well-mixed within the UT student community. The model assumes that all individuals infected with either the wildtype or variant strain are fully immune from infection by either strain after recovery. Individuals transition between the states: susceptible (S), exposed (E), infected (I), and UT COVID-19 Consortium 10 February 12, 2021
recovered (R). The V and W subscripts in the E and I compartments refer to whether the individual is infected with wildtype SARS-CoV-2 (W) or variant SARS-CoV-2 (V). The symbols S, EW, EV, IW, IV, and R denote the number of people in that state. The model equations are given by: Where (t) is the baseline transmission rate, pv is the relative transmissibility of the variant, is the exposed rate, and is the recovery rate. For each simulation, we sample from the distribution of proportion immune (previously infected) and a distribution of proportion infected on January 16th. The daily reproduction number (Rt ) prior to February 5th is sampled directly from estimates of Rt from UT PCT test positivity data, using the EpiEstim package [11]. After February 5th, we assume a fixed transmission rate (except for the spring break surge) sampled from a distribution of Rt c orresponding to either the slower transmission or faster transmission scenario. The transmission rate ( ) corresponding to the specified Rt is then given by N β (t) = Rt δ S(t) . The initial conditions are given in Table S1 and the model parameters are given in Table S2. Figure S1. Diagram of the two-strain COVID-19 transmission model. Upon exposure to either strain, susceptible individuals (S) progress to either exposed to the wildtype (EW) or exposed to the variant (EV), from UT COVID-19 Consortium 11 February 12, 2021
which they move to either infected by the wildtype (IW) or infected by the variant (IV) respectively. All infected individuals progress to the recovered state where they remain protected from future infection (R). Table S1. Initial conditions for COVID-19 transmission simulations. Variable Value Initial day of simulation 1/16/2021 Day of variant introduction 2/5/2021 Initial proportion infected 2.01% (1.32%-3.26%) [3] Initial proportion immune (percent of students previously infected, as estimated from fall UT 14.7% (95%CI:10.7-20.9%) testing data) Table S2. Model parameters Parameters Value Source : transition rate from 1/3 [18] exposed to infectious : recovery rate 1/7 [19] Slower scenario: 1.1 [95%CI: 0.9-1.4] Estimated using EpiEstim Rt: reproduction number Faster scenario: [11] from UT PCT data [10] 0.9 [95%CI: 0.7-1.1] Slower scenario: (t): transmission rate 0.15 (0.11, 0.19) Calculated from Rt Faster scenario: 0.18( 0.14, 0.24) pv: relative transmissibility of 1.56 (1.50-1.74) [1] the variant References 1. Davies NG, Barnard RC, Jarvis CI, Kucharski AJ, Munday J, Pearson CAB, et al. Estimated transmissibility and severity of novel SARS-CoV-2 Variant of Concern 202012/01 in UT COVID-19 Consortium 12 February 12, 2021
England. bioRxiv. medRxiv; 2020. doi:10.1101/2020.12.24.20248822 2. Galloway SE, Paul P, MacCannell DR, Johansson MA, Brooks JT, MacNeil A, et al. Emergence of SARS-CoV-2 B.1.1.7 Lineage - United States, December 29, 2020-January 12, 2021. MMWR Morb Mortal Wkly Rep. 2021;70: 95–99. 3. Cameron Matsui, Kaitlyn E. Johnson, Remy Pasco, Michael Lachmann, Spencer J. Fox, Lauren Ancel Meyers. COVID-19 Campus Introduction Risks for Spring 2021 at the University of Texas at Austin. The University of Texas at Austin; 2021 Jan. Available: https://sites.cns.utexas.edu/sites/default/files/cid/files/ut_spring_introductions.pdf?m=16119 61704 4. Spatio-temporal heterogeneity and the spread of lineage B.1.1.7 in the United Kingdom. 20 Jan 2021 [cited 6 Feb 2021]. Available: https://virological.org/t/spatio-temporal-heterogeneity-and-the-spread-of-lineage-b-1-1-7-in-t he-united-kingdom/601 5. Kraemer MUG, Yang C-H, Gutierrez B, Wu C-H, Klein B, Pigott DM, et al. The effect of human mobility and control measures on the COVID-19 epidemic in China. Science. 2020;368: 493–497. 6. UT Proactive Community Testing Program for COVID-19. [cited 9 Feb 2021]. Available: https://www.healthyhorns.utexas.edu/coronavirus_proactive_testing.html 7. Washington NL, Gangavarapu K, Zeller M, Bolze A, Cirulli ET, Schiabor Barrett KM, et al. Genomic epidemiology identifies emergence and rapid transmission of SARS-CoV-2 B.1.1.7 in the United States. medRxiv. 2021; 2021.02.06.21251159. 8. GISAID - Initiative. [cited 9 Feb 2021]. Available: https://www.gisaid.org/ 9. Volz E, Mishra S, Chand M, Barrett JC, Johnson R, Geidelberg L, et al. Transmission of SARS-CoV-2 Lineage B.1.1.7 in England: Insights from linking epidemiological and genetic data. doi:10.1101/2020.12.30.20249034 10. UT Austin COVID-19 Dashboard. 6 Aug 2020 [cited 12 Feb 2021]. Available: https://coronavirus.utexas.edu/ut-austin-covid-19-dashboard 11. Cori A, Ferguson NM, Fraser C, Cauchemez S. A new framework and software to estimate time-varying reproduction numbers during epidemics. Am J Epidemiol. 2013;178: 1505–1512. 12. UT Proactive Community Testing Program for COVID-19. [cited 9 Feb 2021]. Available: https://www.healthyhorns.utexas.edu/coronavirus_proactive_testing.html 13. CDC. Reinfection with COVID-19. 27 Jan 2021 [cited 12 Feb 2021]. Available: https://www.cdc.gov/coronavirus/2019-ncov/your-health/reinfection.html 14. Bal A, Destras G, Gaymard A, Marlet J, Stefic K, Regue H, et al. Two-step strategy for the identification of SARS-CoV-2 variant of concern 202012/01 and other variants with spike deletion H69-V70, France, August to December 2020. bioRxiv. medRxiv; 2020. doi:10.1101/2020.11.10.20228528 UT COVID-19 Consortium 13 February 12, 2021
15. Helix. Update on the Helix, Illumina surveillance program: B.1.1.7 variant of SARS-CoV-2, first identified in the UK, spreads further into the US. 11 Jan 2021 [cited 4 Feb 2021]. Available: https://blog.helix.com/b117-variant-updated-data/ 16. Washington NL, White S, Barrett KMS, Cirulli ET, Bolze A, Lu JT. S gene dropout patterns in SARS-CoV-2 tests suggest spread of the H69del/V70del mutation in the US. bioRxiv. medRxiv; 2020. doi:10.1101/2020.12.24.20248814 17. Goodrich B, Gabry J, Ali I, Brilleman S. rstanarm: Bayesian applied regression modeling via Stan. R package version. 2018;2: 1758. 18. Backer JA, Klinkenberg D, Wallinga J. Incubation period of 2019 novel coronavirus (2019-nCoV) infections among travellers from Wuhan, China, 20-28 January 2020. Euro Surveill. 2020;25. doi:10.2807/1560-7917.ES.2020.25.5.2000062 19. Walsh KA, Spillane S, Comber L, Cardwell K, Harrington P, Connell J, et al. The duration of infectiousness of individuals infected with SARS-CoV-2. J Infect. 2020;81: 847–856. UT COVID-19 Consortium 14 February 12, 2021
You can also read