February 2021 - Gay-Lussac Gestion
←
→
Page content transcription
If your browser does not render page correctly, please read the page content below

MONTHLY
REPORTING

  February 2021

Gay-Lussac Europe Flex
                                                                                                                                                    February 2021

GENERAL INFORMATIONS                                                                                 Performances and statistics on the 26 February 2021

  Custodian                                      Société Générale
  Cut off                             Subscriptions/redemptions
  ISIN Code (A share)                                 FR0013280211
  ISIN Code(I share)                                 FR0013280237
  Valuation                                                   Daily
  Management fees A share                      1,50% of Net assets
  Management fees I share                     0,80% of Net assets
  Performance fees (High                 12% including tax of the
  Water Mark)                               annual perf over 5%
  Entry fees                                       2% maximum
  Exit fees (UCITS acquired)                                  None
  NAV (A share)                                           175,79 €
  NAV (I share)                                         11 975,95 €
  Inception date (A share)                                29-sep-17
  Inception date (I share)                                29-sep-17
                                                                                                                     2021
  Net assets                                              36,22 M€                                       1M                      2020       2019           2018    Création *
                                                                                                                     (YTD)

  Risk indicator (I Share)        Gay-Lussac Europe Flex                           Part A            -0,4%           0,9%        11,0%      12,1%          -6,8%    17,2%

       Volatilité 3Y                         7,29 %                                Part I            -0,3%           1,0%        11,5%     12,9%           -6,1%    19,8%
     Max Drawdown                        -14,94 %
                                                                                  * Since the launch of the Fund on 29/09/2017
               Beta                           0,62                                ** Benchmark index: 50% EONIA (EONCALP7 Index) + 16.66% Stoxx 600 TR + 16.66% CAC
                                                                                  Mid&Small TR +
       Sharpe Ratio                           0,90                                16.66% MSCI EMU Microcaps TR

COUNTRY BREAKDOWN                                                   INDUSTRY BREAKDOWN                         ……….              BREAKDOWN BY INVESTMENT THEME
(on the invested share)                                             (on the invested share)
   Finlande      1,58%
                                                                                 Immobillier
       USA        2,75%
                                                                            Services publics
     Suede          3,98%
  Danemark           4,82%                                                         Telecom
                                                                                                                                    Surprise Européenne              8%
     Suisse      0,31%                                                              Energie
                                                                                                                                                                            15%
Royaume-Uni         4,55%                                                             Santé
   Portugal      0,84%
                                                                                                                                    Transition Numérique et
                                                                              Conso de base                                         Energétique
   Espagne       2,14%
                                                                       Conso discrétionnaire
   Pays-Bas         3,71%                                                                                                           Politiques Monétaires
                                                                                          IT                                        accomodantes                   46%          31%
      Italie             9,83%
   Belgique      2,65%                                                              Finance                                         Situations Spéciales
     France                                                 57,56%                Matériaux
  Allemagne         5,28%
                                                                                   Industrie
            0,00%        15,00%     30,00%     45,00%      60,00%                              0%   5%   10%   15%   20%   25%
Gay-Lussac Europe Flex
                                                                                                                February 2021

                                                     Macroeconomic review
       February was marked by the rise in rates at the end of the month, limiting the rise in indexes: STOXX 600 + 2.44%, CAC 40 +
       5.63%, S&P 500 + 3.16%.

       In Europe, health measures and the rate of vaccination are still very heterogeneous depending on the country. The recovery
       remains dependent on the timetable for reopening the economies. On the monetary front, the ECB has the tools to contain
       the risk of a too rapid rise in rates. More than 50% of the PEPP envelope remains notably still available (out of € 1,850 billion
       by March 2022). The rise in the inflation rate in Europe (+1.3% year-on-year in February in Germany versus +1% in January) is
       driven by effects such as the rise in freight rates, the rise in raw materials or one-off shortages.

       In the United States, budget support continues to drive activity. February's ISM manufacturing index climbed to a nearly
       three-year high, at 60.8 from 58.7 in January. The pace of vaccination will accelerate further with the emergency
       authorization of the Johnson & Johnson single-dose vaccine. The $ 1.9 trillion plan is expected to be validated quickly, notably
       thanks to the temporary abandonment of the minimum wage hike. Against the backdrop of the rapid rise of the 10-year US,
       Federal Reserve Chairman Jerome Powell has indicated that no tightening of monetary policy is to be expected in the short
       term. The FED indeed considers itself still far from its objectives of full employment and inflation

 KEY RATIOS                                    TOP FIVE POSITIONS                               BREAKDOWN BY MARKET CAPS
Gross Equity Exposure              69,84%                                                               Name            % net asset
Futures & Options                   -19,02%             Name            % net asset
Net Equity Exposure                50,82%                                                         More than 4 Mds €      29,85%
                                                 PHARMANUTRA SPA           3,19%
Bonds                               4,61%                                                         From 500 M€ to 4
Arbitrage / Takeover bid           10,58%           ROBERTET SA            2,71%                                         34,97%
                                                                                                       Mds €
Liquidities, money market          14,97%
Monthly performance - A Share      -0,38%          AIR LIQUIDE SA          2,57%                  Less than 500 M€        35,18%
Monthly performance - I Share      -0,28%                                                              Average
                                                       PRECIA              2,18%                                          22 519
Number of lines                         64                                                        Capitalisation (M€)
Median PER 2021                      26,13              STEF               2,13%                       Median
Median EV/Sales 2021                  2,88                                                                                2 364
                                                                                                  Capitalisation (M€)
Median EV/EBIT 2021                  20,32

                                                         Management review

     Regarding purchases, we are strengthened our stakes in Oeneo and DSV Panalpina and have initiated a line in ADP. French
     wine corking specialist Oeneo should continue to demonstrate its resilience in the fourth quarter and benefit from order delays
     to 2021. We have increased the DSV Panalpina line initiated last month. The 2020 objectives remain cautious in view of the
     synergies linked to the acquisition of Panalpina and overall rising freight rates. French airport operator ADP is expected to
     benefit from the gradual recovery in global traffic while showing a resilient profile thanks to its extensive commercial real
     estate portfolio.
     On the disposal side, we reduced our exposure to Cellnex. The sharp rise in rates initiated in the United States, linked among
     other things to the effective vaccination campaign and improved economic prospects, has penalized growth stocks. We remain
     convinced of the potential of Cellnex that should double its market shares in a high-growth, 5G environment. However, we
     prefer to wait for a lull in the interest rate market before repositioning ourselves on the Spanish player.
Gay-Lussac Green Impact
February 2021
GENERAL INFORMATIONS Performances and statistics on the 26 February 2021
+59,0%
Custodian Société Générale 190
Cut off Subscriptions/redemptions
ISIN code (A share) FR0010178665
170
ISIN code (I share) FR0010182352
ISIN code (R share) FR0014000EI9
Valuation Daily 150
Management fees A share 2,32% of Net assets
Management fees I share 0,96% of Net assets 130
+39,0%
Management fees R share 1.40%of Net assets
Performance fees (High Water 20% including tax of the 110
Mark) annual perf over the index
Entry fees 2% maximum
Exit fees (UCITS acquired) None
90
12/14 06/15 12/15 06/16 12/16 06/17 12/17 06/18 12/18 06/19 12/19 06/20 12/20
NAV (A share) 370,60 €
NAV (I share) 188 282,77 € Gay-Lussac Green Impact - Part I - Base 100 Stock 600 - Base 100
NAV (R share) 150,68 €
Inception date (A share) 3 Jun 05
Inception date (I share) 11-apr-07 YTD 2021 2020 2019 2018 2017 2016 2015 2014 2013 2012 2011 2010 2009 2008 Lancement
Inception date (R share) 18 dec.20
Net assets 30,84 M€ Part A -1,7% -1,6% 14,8% 22,0% -14,3% 9,6% -0,2% 17,7% -4,5% 19,3% 22,3% -10,0% 15,6% 32,2% -43,9% 147,07%
Risk indicator (A Share) GL Green Impact Stoxx
2,3% 1,5% -4,0% 23,2% -13,2% 7,7% -1,2% 6,8% 4,3% 17,3% 14,3% -11,3% 8,6% 28,0% -45,6% 49,86%
600
Volatilité 3Y 18,23% Stoxx
2,4% 1,7% -2,0% 26,8% -10,8% 10,6% 1,7% 9,6% 7,2% 20,7% 18,1% -8,6% 11,6% 32,4% -43,7% 131,15%
600 TR
Max Drawdown 3Y 20,98%
Part I -1,6% -1,4% 16,3% 23,7% -13,1% 11,1% 1,1% 19,4% -3,2% 20,9% 24,0% -8,7% 17,1% 32,9% -43,3% 85,28%
Beta 0,85
Stoxx
2,3% 1,5% -4,0% 23,2% -13,2% 7,7% -1,2% 6,8% 4,3% 17,3% 14,3% -11,3% 8,6% 27,9% -45,6% 5,97%
600
Sharpe Ratio 3Y 0,70 Stoxx
2,4% 1,7% -2,0% 26,8% -10,8% 10,6% 1,7% 9,6% 7,2% 20,7% 18,1% -8,6% 11,6% 32,3% -43,7% 57,12%
600 TR
Tracking Error 11,12
SECTORS BREAKDOWN COUNTRY BREAKDOWN
Food & Beverage 2,9%
Automobiles & Parts 1,6%
Telecommunications 1,5% 50% Gay-Lussac Green Impact
Technology 12,4% 41%
Retail 1,5% Stoxx 600 38%
40%
Financial Services 3,6%
Construction & Materials 4,8% 30%
Health Care 5,3%
18% 17%
Oil & Gas 2,1% 20% 15% 15%
Utilities 10,4% 11%
10% 6% 4% 6% 7%
Chemicals 10,7% 3% 4%
1%
Real Estate 2,6%
Industrial Goods & Services 19,1% 0%
Autres Espagne Suisse Danemark Allemagne France Italie
Personal & Household Goods 8,7%
0,0% 4,0% 8,0% 12,0% 16,0% 20,0%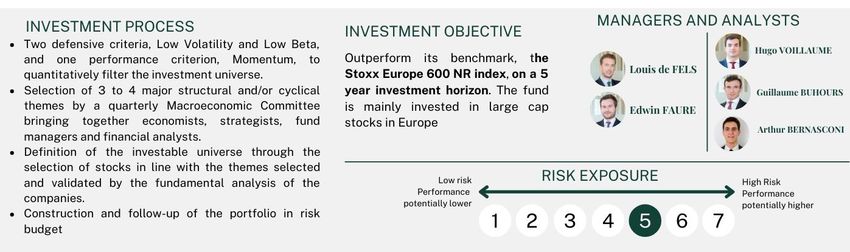
Gay-Lussac Green Impact
                                                                                                            February 2021

                                                   Macroeconomic review
     February was marked by the rise in rates at the end of the month, limiting the rise in indexes: STOXX 600 + 2.44%, CAC 40 +
     5.63%, S&P 500 + 3.16%.

     In Europe, health measures and the rate of vaccination are still very heterogeneous depending on the country. The recovery
     remains dependent on the timetable for reopening the economies. On the monetary front, the ECB has the tools to contain the
     risk of a too rapid rise in rates. More than 50% of the PEPP envelope remains notably still available (out of € 1,850 billion by
     March 2022). The rise in the inflation rate in Europe (+1.3% year-on-year in February in Germany versus +1% in January) is driven
     by effects such as the rise in freight rates, the rise in raw materials or one-off shortages.

     In the United States, budget support continues to drive activity. February's ISM manufacturing index climbed to a nearly three-
     year high, at 60.8 from 58.7 in January. The pace of vaccination will accelerate further with the emergency authorization of
     the Johnson & Johnson single-dose vaccine. The $ 1.9 trillion plan is expected to be validated quickly, notably thanks to the
     temporary abandonment of the minimum wage hike. Against the backdrop of the rapid rise of the 10-year US, Federal Reserve
     Chairman Jerome Powell has indicated that no tightening of monetary policy is to be expected in the short term. The FED
     indeed considers itself still far from its objectives of full employment and inflation.

   KEY RATIOS                                      TOP FIVE POSITIONS                            BREAKDOWN BY MARKET CAPS

Investment rate (direct lines)       87,11%                                                                   Name             % net asset
                                                           Name              % net asset
Number of lines                          54                                                             More than 5 Mds €       56,87%
Monthly Performances A Share          -1,66%           AIR LIQUIDE SA             3,96%
Monthly Performances I Share          -1,58%                                                            From 1 to 5 Mds €        29,21%
                                                    KNORR-BREMSE AG               3,76%
Monthly Performances R Share          -1,90%                                                            Less than 1 Mds €        13,92%
Median PER 2021                       27,60         NOVO NORDISK A/S-B            3,44%               Average Capitalisation
                                                                                                                               32 503,55 €
                                                       ROBERTET SA                3,34%                      (Mds €)
                                                                                                      Median Capitalisation
                                                                                                                               11 288,71 €
                                                         SOMFY SA                 3,13%                      (Mds €)

                                                    Management review

    Regarding portfolio management, we have strengthened our position in L'Oreal and initiated a line in Teamviewer and Akwel. In
    the fourth quarter, the world's leading cosmetics company, L'Oreal, reported results that were at the top end of the consensus
    expectation range. Organic growth reached an impressive 4.8%, driven by the turnaround in the Luxury Goods sector and the
    considerably high traction effect of Active Cosmetics (2nd consecutive quarter at +30%). Teamviewer offers a complete remote
    assistance, remote control and remote access solution compatible with all mobile and desktop platforms. The Group is present
    in a market that is growing by an average of 27% per year, driven by digital transformation, teleworking and strong growth in
    the augmented reality segment. The Q4 publication confirms this trend with a 32% growth in customer billings and an EBITA
    margin that now reaches 56.6%. Akwel is an independent automotive supplier, mainly active in two main product families: fluid
    management and mechanisms. The group reports impressive organic growth of 14% and operating profit is expected to exceed
    €100 million, well above expectations. Management is confident about the group's prospects, with a sales dynamic that remains
    well oriented and a favorable comparable basis for the first half of 2021. Finally, we have reduced the IT sector with Esker and
    SAP and the renewable energy sector with Orsted and EDPR due to valuation issues.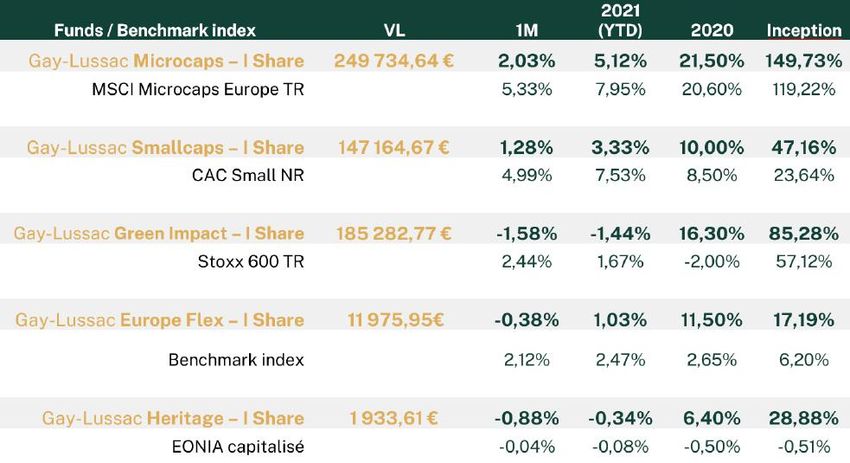
Gay-Lussac Microcaps
February 2021
GENERAL INFORMATIONS
Performances and statistics on the 26 of February 2021
Custodian Société Générale
Cut off Subscriptions/redemptions
ISIN code (A share) FR0010544791 Gay-Lussac Smallcaps MSCI Europe Micro TR - Base 100
ISIN code (I share) FR0011672757 1
ISIN code (H share) FR0013392115 0,9
ISIN code (R share) FR0013430550 0,8
Valuation Daily 0,7
Management fees A share 2,34% of Net assets
0,6
Management fees I and H 1,20% of Net assets
shares 0,5
Management fees R share 1.60%of Net assets 0,4
Performance fees (High 12% including tax of the 0,3
Water Mark) annual perf over 7% 0,2
Entry fees 2% maximum
0,1 0,0
0,0
Exit fees (UCITS acquired) None
NAV (A share) 548,31 € 0
janv.-00
janv.-00
janv.-00
janv.-00
janv.-00
janv.-00
janv.-00
janv.-00
janv.-00
janv.-00
janv.-00
janv.-00
janv.-00
janv.-00
janv.-00
janv.-00
janv.-00
janv.-00
janv.-00
janv.-00
janv.-00
janv.-00
janv.-00
janv.-00
janv.-00
janv.-00
janv.-00
janv.-00
janv.-00
janv.-00
janv.-00
janv.-00
janv.-00
janv.-00
janv.-00
janv.-00
janv.-00
janv.-00
janv.-00
janv.-00
janv.-00
janv.-00
janv.-00
janv.-00
janv.-00
janv.-00
janv.-00
janv.-00
janv.-00
janv.-00
janv.-00
janv.-00
janv.-00
janv.-00
janv.-00
janv.-00
NAV (I share) 249 734,64 €
NAV (H share) $152 976,42 €
NAV (R share) 135, 64 €
Inception date (A share) 31-mar-14 2021
YTD 2020 2019 2018 2017 2016 2015 2014 2013 2012 2011 2010 2009 2008 Lancement
Inception date (I share) 30-dec-16 (YTD)
Inception date (H share) 4-Feb-19 Part A 2,0% 5,0% 20,6% 21,7% -12,1% 21,2% 16,8% 14,7% 6,0% 26,2% 12,4% -6,8% 17,5% 49,1%
-
32,3%
265,5%
Inception date (R share) 1-Jul-19 MSCI Europe
5,3% 7,9% 19,4% 18,2% -14,3% 17,5% 10,7% 14,5% 0,9% 29,9% 10,0% -18,8% 10,9% 58,7%
-
76,6%
Micro 54,2%
Net assets 103,60 M€ MSCI Europe
5,3% 8,0% 20,6% 20,4% -12,9% 19,4% 12,7% 16,4% 2,5% 32,1% 11,9% -17,4% 13,0% 62,8%
-
122,2%
Micro TR 53,2%
GL Microcaps MSCI MICRO
Part I 2,0% 5,1% 21,5% 23,1% -11,1% 22,4% 17,9% 16,1% 6,6% 149,7%
Volatilité 3Y 12,10 19,10 MSCI Europe
Micro
5,3% 7,9% 19,4% 18,2% -14,3% 17,5% 10,7% 14,5% 0,9% 95,9%
MSCI Europe
5,3% 8,0% 20,6% 20,4% -12,9% 19,4% 12,7% 16,4% 2,5% 119,2%
Max Drawdown 3Y -23,00% -30,90% Micro TR
* Indicateur de référence : MSCI Europe Microcap après le 27/01/2011, CAC SMALL avant
Beta 0,7 ---
Sharpe Ratio 3Y 0,7 ---
Tracking Error 13,2 ---
Grade average E* 6,61/10
Grade average S* 6,37/10
Grade average G* 6,17/10
Portfolio grade overall ESG** 6,39/10
b
…
COUNTRY BREAKDOWN INDUSTRY BREAKDOWN (on total invested)
Services publics
Norvege MSCI Micro
THE FUND’S WEEKLY AVERAGE ON ↗ AND ↘*
1% *since inception
Telecom
Cash lancement
Energie
GL Microcaps
2%
10%
Italie 1,02% 1,19% Santé
24% 1%
Conso de base
0% Conso discrétionnaire
Allemagne IT
-1%
6% France
-1,15% Immobilier
59% -2% -1,63%
Finance
Gay-Lussac MicroCaps MSCI Microcaps
Matériaux
Industrie
0% 10% 20% 30%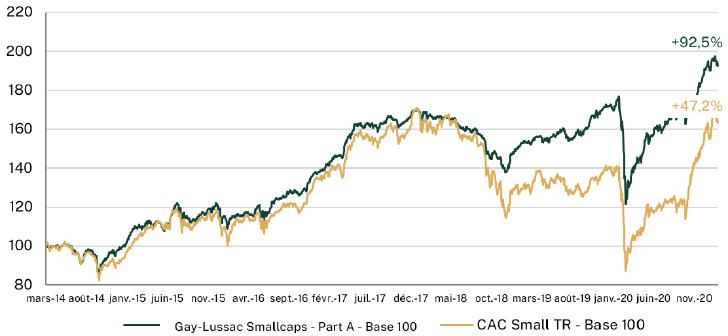
Gay-Lussac Microcaps
                                                                                                                           February 2021
                                                                                                                                    2021
                                                          Macroeconomic review

    February was marked by the rise in rates at the end of the month, limiting the rise in indexes: STOXX 600 + 2.44%, CAC 40 +
    5.63%, S&P 500 + 3.16%.

    In Europe, health measures and the rate of vaccination are still very heterogeneous depending on the country. The recovery
    remains dependent on the timetable for reopening the economies. On the monetary front, the ECB has the tools to contain the
    risk of a too rapid rise in rates. More than 50% of the PEPP envelope remains notably still available (out of € 1,850 billion by
    March 2022). The rise in the inflation rate in Europe (+1.3% year-on-year in February in Germany versus +1% in January) is driven
    by effects such as the rise in freight rates, the rise in raw materials or one-off shortages.

    In the United States, budget support continues to drive activity. February's ISM manufacturing index climbed to a nearly three-
    year high, at 60.8 from 58.7 in January. The pace of vaccination will accelerate further with the emergency authorization of
    the Johnson & Johnson single-dose vaccine. The $ 1.9 trillion plan is expected to be validated quickly, notably thanks to the
    temporary abandonment of the minimum wage hike. Against the backdrop of the rapid rise of the 10-year US, Federal Reserve
    Chairman Jerome Powell has indicated that no tightening of monetary policy is to be expected in the short term. The FED
    indeed considers itself still far from its objectives of full employment and inflation.

 KEY RATIOS………………………………………….                           TOP FIVE POSITIONS                  ……………         BREAKDOWN BY MARKET CAPS                ………….
Investment rate (direct lines) 89,8%
Number of lines                   58                           Name                % net asset                       Nom                  % Actif net
Monthly performance A Share     2,0%                                                                           More than 300M€               45%
Monthly performance I Share     2,0%                         IGE + XAO                 5,95%
                                                                                                              From 100 to 300M€              47%
Monthly performance H Share     2,1%
                                                       PHARMANUTRA SPA                 4,82%                    Less than 100M€               8%
Monthly performance R Share     2,0%
PER median 2020                  18,9                        PRECIA                    4,66%                Average Capitalisation
                                                                                                                                              353
VE/CA median 2020                 1,2                    GERARD PERRIER                                             (M€)
VE/EBIT median 2020              14,8                       ELECTRIC                   4,09%                Median Capitalisation
                                                                                                                                             221,5
                                                                                                                    (M€)
                                                        DIGITAL VALUE SPA              4,06%

                                                       Management review
    We initiated a position in Cogelec, and we strengthened participation in Precia, ABC Arbitrage and Pharmagest. Cogelec specializes in the
    design, manufacture and distribution of innovative telephone intercom and access control solutions marketed primarily under its flagship
    brand Intratone. The Group, through its innovations, introduces technological breakthroughs and permanent commercial offers in its market.
    Cogelec, for example, is the only one to offer a wireless intercom solution ("Intratone") operating with a SIM card similar to a smartphone.
    Weighing tool specialist Precia is benefiting from excellent sales momentum. The group’s strategy to offer more software looks very promising,
    so we took advantage of a market opportunity to strengthen our position. ABC Arbitrage, a company specializing in liquidity arbitrage and
    statistical arbitrage strategies. The group has collected a lot of assets under management over the past few months and should benefit from
    volatility that remains significant due to sector rotation linked to the rise in interest rates. We took advantage of a reclassification to
    strengthen our stake in Pharmagest, which is benefiting from very favorable trends and which should see its profitability further improve. In
    connection with our management process, we were forced to reduce our positions in Esker and Piscines Desjoyaux. The strong stock market
    performances of the two groups led to an increase in their volatility. However, the fundamentals of these two groups remain very strong.

    MAIN MOVEMENTS OF THE MONTH                        STOCK OF THE MONTH
                                                         Founded in 1997, Ringmetall is a specialist supplier to the packaging industry. Positioned in a
             Buy                    Sell                 niche market, the group focuses in its industrial packaging division on special packaging
           Cogelec                 Esker                 solutions for the chemical, petrochemical, pharmaceutical and food industries, as well as in the
                                                         Industrial handling division on the logistics sector. The group's product range mainly focuses
            Precia           Piscines Desjoyaux          on closing systems, the clamping ring also includes sealing rings and closures. Ringmetall is
        ABC Arbitrage                                    the world market leader in the field of clamping rings. With over 2000 different types of highly
                                                         specialized clamping rings, Ringmetall has a 70% market share globally. The demand for
         Pharmagest                                      Ringmetall products is extremely robust, with market growth of around 3%. Due to the high
                                                         degree of specialization of its products, the German group benefits from a strong barrier to
                                                         entry. In 2020, the group achieved a turnover of 118 million euros, or 2% below 2019, attesting
                                                         to the resilience of the group’s business. Despite the upturn in volumes in the fourth quarter,
                                                         management announced fairly conservative guidance due to the health uncertainties which
                                                         continue to weigh on the economy. In 2021, the group is expected to resume M&A that had been
                                                         interrupted by COVID-19. These acquisitions should focus on the clamping rings. We are
                                                         confident in the recovery of the economy driven by vaccinations, being a quality cyclical player,
                                                         Ringmetall is an interesting vector to take advantage of the recovery of the economical cycle.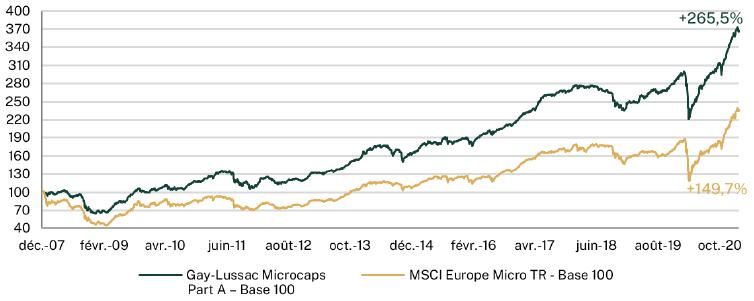
Gay-Lussac Smallcaps
February 2021
GENERAL INFORMATIONS Performances and statistics on the 26 February 2021
Custodian Société Générale GL Smallcaps - Part A - Base 100 CAC Small TR - Base 100
Cut off Subscriptions/redemptions 220
Code ISIN (A Share) FR0011759299
200 196,9
Code ISIN (I Share) FR0013228327
Valuation Daily
Management fees A Share 2,20% of Net assets 180
167,5
Management fees I Share 1,10% of Net assets
160
Performance fees None
Entry fees 2% maximum 140
Exit fees (UCITS acquired) None
NAV (A Share) 288,79€ 120
NAV (I Share) 147 164,67€
Inception date (A Share) 31-mar-14 100
Inception date (I Share) 30-dec-16
Net assets 27,53 M€ 80
mars-14 août-14 janv.-15 juin-15 nov.-15 avr.-16 sept.-16 févr.-17 juil.-17 déc.-17 mai-18 oct.-18 mars-19 août-19 janv.-20 juin-20 nov.-20
GL Smallcaps MSCI MICRO 2021
1M 2020 2019 2018 2017 2016 2015 2014 Lancement
(YTD)
Volatilité 3Y 15,41% 0,2301364 Part A 1,2% 3,2% 8,8% 21,7% -15,5% 21,8% 12,1% 23,6% -1,2% 92,5%
5,0% 7,5% 7,2% 15,2% -26,8% 21,1% 9,9% 27,2% -8,8% 50,1%
Max Drawdown 3Y -27,71% -31,90% CAC SMALL
CAC SMALL NR 5,0% 7,5% 8,5% 17,2% -26,0% 22,1% 11,3% 28,7% -7,8% 63,4%
Beta 75,96%
Sharpe Ratio 3Y 35,00% Part I 1,3% 3,3% 10,0% 23,1% -14,5% 23,1% 47,2%
CAC SMALL 5,0% 7,5% 7,2% 15,2% -26,8% 21,1% 17,7%
Tracking Error 14,0882
CAC SMALL NR 5,0% 7,5% 8,5% 17,2% -26,0% 22,1% 23,6%
Grade average E* 6,98/10
Grade average S* 6,94/10
Grade average G* 6,60/10
Portfolio grade overall ESG** 6,84/10
b
…
COUNTRY BREAKDOWN INDUSTRY BREAKDOWN (on total invested)
Finlande Cash Immobilier
Irlande CAC Small TR
5%
1% Pays-Bas 2% THE FUND’S WEEKLY AVERAGE ON ↗ AND ↘* Services publics
6% Espagne *since inception
Telecom Gay-Lussac
Autriche 2% 1,58% Energie
Smallcaps
0.2%
2% Allemagne 1,20% Santé
Italie 9% 0.1%
Belgique Conso de base
2% 7% 0.0% Conso discrétionnaire
IT
-0.1%
Finance
-0.2% -1,17%
France -1,92%
Matériaux
64% -0.3% Industrie
Gay-Lussac Smallcaps CAC Small NR 0% 5% 10% 15% 20%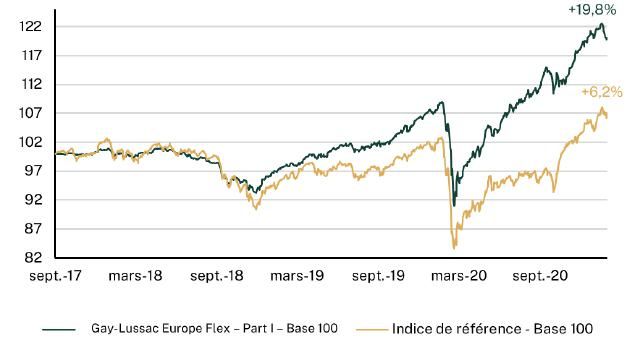
Gay-Lussac Smallcaps
                                                                                                                         February 2021

                                                      Macroeconomic review
 February was marked by the rise in rates at the end of the month, limiting the rise in indexes: STOXX 600 + 2.44%, CAC 40 +
 5.63%, S&P 500 + 3.16%.

 In Europe, health measures and the rate of vaccination are still very heterogeneous depending on the country. The recovery
 remains dependent on the timetable for reopening the economies. On the monetary front, the ECB has the tools to contain the
 risk of a too rapid rise in rates. More than 50% of the PEPP envelope remains notably still available (out of € 1,850 billion by
 March 2022). The rise in the inflation rate in Europe (+1.3% year-on-year in February in Germany versus +1% in January) is driven
 by effects such as the rise in freight rates, the rise in raw materials or one-off shortages.

 In the United States, budget support continues to drive activity. February's ISM manufacturing index climbed to a nearly three-
 year high, at 60.8 from 58.7 in January. The pace of vaccination will accelerate further with the emergency authorization of
 the Johnson & Johnson single-dose vaccine. The $ 1.9 trillion plan is expected to be validated quickly, notably thanks to the
 temporary abandonment of the minimum wage hike. Against the backdrop of the rapid rise of the 10-year US, Federal Reserve
 Chairman Jerome Powell has indicated that no tightening of monetary policy is to be expected in the short term. The FED
 indeed considers itself still far from its objectives of full employment and inflation.

KEY RATIOS                                            TOP FIVE POSITIONS                                   BREAKDOWN BY MARKET CAPS

Investment rate (direct lines)          94,8%                   Nom               % actif net                            Name                 % net asset
Number of lines                             46
                                                     AXWAY SOFTWARE SA                    5,5%                    More than 800M€                 43%
Monthly performance A Share              1,2%
Monthly performance I Share              1,3%        SAMSE SA                             4,8%                   From 400 to 800M€                42%
PER médian 2020                           19,9       ROBERTET SA                          4,3%                    Less than 400M€                  15%
VE/CA médian 2020                           1,9
                                                     CORBION NV                           4,3%               Average Capitalisation (M€)         1 144,6
VE/EBIT médian 2020                        16,1
                                                     STEF                                 4,2%               Median Capitalisation (M€)            831

                                                            Management review
 Regarding portfolio management in February, we initiated a line in SanLorenzo, the specialist in building high-end yachts, which will benefit from
 strong momentum in the luxury sector. We have strengthened our line in Salcef, an Italian rail maintenance operator, which will pursue its
 acquisition strategy and will benefit from the positive dynamic of the rail industry. We also strengthened our position in Nacon, which should
 experience another year of strong growth thanks to the excellent momentum in video games. Finally, we have strengthened our line in Verallia,
 which will continue to improve its margins thanks to the recovery in sales volumes that will occur with the lifting of lockdown measures. On the
 sales side, we sold our line in Esker. The company seemed well valued to us after a strong run in 2020. In addition, we partially sold our line in
 Mersen in order to respect our budget risk. Finally, we sold our LNA Santé’s stocks mainly to protect ourselves from the recent hike in key interest
 rates..

MAIN MOVEMENTS OF THE MONTH                           STOCK OF THE MONTH
                                                      Founded in 1972, Verallia specializes in the design, production and recycling of glass packaging.
                                                      The company was initially a Saint-Gobain Group’s branch before becoming an independent group
       Buy                       Sell
                                                      in 2015. Verallia is the European leader and the world's third largest producer of glass packaging
    SanLorenzo                Esker                   for food and beverages products.
                                                      In February, Verallia published their results for the year 2020, exceeding expectations, and is
      Salcef                 Mersen                   optimistic about the outlook for 2021. Indeed, for the year 2020, the group achieved a turnover of
      Nacon                 LNA Santé                 2,536 million euros, a decline limited to -1.9% compared to 2019, despite an unprecedented
                                                      global health and economic crisis. In addition, profits and margins should continue to grow thanks
      Verallia                                        to volume’s recovery, product mix’s evolution towards high-end products, and its operational
                                                      performance plan aimed at reducing production costs by 2% per year in its 32 production sites.
                                                      Finally, we are convinced that Verallia is well positioned to comeback to growth levels similar to
                                                      those of 2019 in 2021 and will further continue its development thanks to lockdown measures’
                                                      lifting.
You can also read