Q4 & Full Year 2018 results - February 1, 2019 - Signify

Page created by Gladys Juarez
 
CONTINUE READING
Q4 & Full Year 2018 results - February 1, 2019 - Signify
Q4 & Full Year 2018 results

February 1, 2019
Q4 & Full Year 2018 results - February 1, 2019 - Signify
Important information
    Forward-Looking Statements and Risks & Uncertainties
    This document and the related oral presentation contain, and responses to questions following the presentation may contain, forward-looking statements that reflect the intentions, beliefs or current expectations and projections of
    Signify N.V. (the “Company”, and together with its subsidiaries, the “Group”), including statements regarding strategy, estimates of sales growth and future operational results.
    By their nature, these statements involve risks and uncertainties facing the Company and its Group Companies and a number of important factors could cause actual results or outcomes to differ materially from those expressed in
    any forward-looking statement as a result of risks and uncertainties. Such risks, uncertainties and other important factors include but are not limited to: adverse economic and political developments, the impacts of rapid
    technological change, competition in the general lighting market, development of lighting systems and services, successful implementation of business transformation programs, impact of acquisitions and other transactions, impact
    of the Group’s operation as a separate publicly listed company, pension liabilities and costs, establishment of corporate and brand identity, adverse tax consequences from the separation from Royal Philips and exposure to
    international tax laws. Please see “Risk Factors and Risk Management” in Chapter 12 of the Annual Report 2017 for discussion of material risks, uncertainties and other important factors which may have a material adverse effect on
    the business, results of operations, financial condition and prospects of the Group. Such risks, uncertainties and other important factors should be read in conjunction with the information included in the Company’s Annual Report
    2017. Additional risks currently not known to the Group or that the Group has not considered material as of the date of this document could also prove to be important and may have a material adverse effect on the business, results
    of operations, financial condition and prospects of the Group or could cause the forward-looking events discussed in this document not to occur. The Group undertakes no duty to and will not necessarily update any of the forward-
    looking statements in light of new information or future events, except to the extent required by applicable law.

    Market and Industry Information
    All references to market share, market data, industry statistics and industry forecasts in this document consist of estimates compiled by industry professionals, competitors, organizations or analysts, of publicly available information
    or of the Group’s own assessment of its sales and markets. Rankings are based on sales unless otherwise stated.

    Non-IFRS Financial Statements
    Certain parts of this document contain non-IFRS financial measures and ratios, such as comparable sales growth, adjusted gross margin, EBITA, adjusted EBITA, EBITDA, adjusted EBITDA and free cash flow, and other related ratios,
    which are not recognized measures of financial performance or liquidity under IFRS. The non-IFRS financial measures presented are measures used by management to monitor the underlying performance of the Group’s business
    and operations and, accordingly, they have not been audited or reviewed. Not all companies calculate non-IFRS financial measures in the same manner or on a consistent basis and these measures and ratios may not be comparable
    to measures used by other companies under the same or similar names. A reconciliation of these non-IFRS financial measures to the most directly comparable IFRS financial measures is contained in this document. For further
    information on non-IFRS financial measures, see “Chapter 18 Reconciliation of non-IFRS measures” in the Annual Report 2017.

    Presentation
    All amounts are in millions of euros unless otherwise stated. Due to rounding, amounts may not add up to totals provided. All reported data are unaudited. Unless otherwise indicated, financial information has been prepared in
    accordance with the accounting policies as stated in the Annual Report 2017 and the semi-annual report 2018.

    Market Abuse Regulation
    This presentation contains information within the meaning of Article 7(1) of the EU Market Abuse Regulation.

    Changes to financial reporting following organizational changes to further align the organizational structure with the strategy
    As of the first quarter of 2018, Signify reports and discusses its financial performance based on the recently announced portfolio changes. In March 2018, the company provided an update to show the effect of changes to the
    business portfolio as well as changes to the allocation methods of centrally-managed costs and expenses and threshold for identifying other incidental items as adjusting items when presenting certain non-IFRS measures such as
    Adjusted EBITA.

2
Q4 & Full Year 2018 results - February 1, 2019 - Signify
Content

Welcome & introduction by Eric Rondolat

Financial performance for Q4 18 by Stéphane Rougeot

FY 18 highlights by Eric Rondolat

Outlook & conclusion by Eric Rondolat

Q&A

3
Q4 & Full Year 2018 results - February 1, 2019 - Signify
Welcome & introduction
         •   LED-based sales grew by 2.5% in FY 18 on a comparable basis to 71% of sales
         •   Signify’s installed base of connected light points increased from 30m at YE17 to 44m at YE18

    %    •
         •
             Adj. EBITA margin improved by 50 bps to 10.1%, including a currency impact of -50bps
             Adj. indirect costs decreased by EUR 224m on a currency comparable basis, a reduction of 10%

         •   FCF of EUR 306m (FY 17: EUR 403m, incl. real estate proceeds of EUR 56m and EUR 40m lower restructuring
             cash-out)
         •   EUR 1.1bn returned to shareholders since IPO, incl. proposed 2018 dividend of EUR 1.30 (+4%)

         •   Solid progress towards achieving our 2020 Sustainability goals
         •   Continue to focus on new growth platforms to strengthen our market leadership and progressively improve
             our growth profile
         •   Execute concrete actions to further simplify thus improving our cost base
         •   Deliver in 2019 on the mid-term financial targets set at the time of the IPO
4
Q4 & Full Year 2018 results - February 1, 2019 - Signify
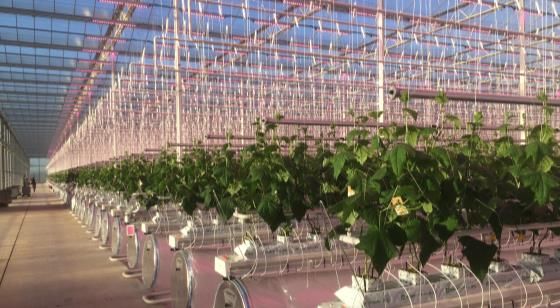
Our transformation journey has made Signify the leading company in the
new era of the Lighting industry
                                                 Growing profit engines                                                        Cash engine

                      LED                              Professional                                  Home                         Lamps

    •     We have been building a new worldwide leader focusing on our growing profit engines, in line with our         •   We are increasing our
          strategy to move to LED and connectivity, unleashing new growth platforms and new business models                 leadership in
                                                                                                                            conventional
    •     Signify is today the leader in LED lighting, and in connected lighting systems and services                       products, optimizing
                                                                                                                            cash to fund growth

        % of total sales from growing          Adj. EBITA margin development of         Adj. EBITA contribution from
        profit engines                         growing profit engines (in %)            growing profit engines (in %)
                                                                      8.6%                                   66%
                              77%                       +500 bps

                62%                                                                           31%
                                                       3.6%

               2015           2018                    2015            2018                    2015           2018

5
Q4 & Full Year 2018 results - February 1, 2019 - Signify
Content

Welcome & introduction by Eric Rondolat

Financial performance for Q4 18 by Stéphane Rougeot

FY 18 highlights by Eric Rondolat

Outlook & conclusion by Eric Rondolat

Q&A

6
Q4 & Full Year 2018 results - February 1, 2019 - Signify
Growing profit engines: Adjusted EBITA margin improved by 140 bps

                            Adjusted EBITA                  Adjusted
    Q4 18          CSG %                     vs LY (EURm)              vs LY (bps)
                                (EURm)                      EBITA %

    LED            0.2%           69            +21          14.4%        +460

    Professional   -6.9%          85              -9         12.0%          -10

    Home           -2.6%          16              -2           8.9%         -60

    Total          -4.0%         170            +11          12.4%        +140

7
Q4 & Full Year 2018 results - February 1, 2019 - Signify
LED Adjusted EBITA margin increased by 460 bps, mainly as a result of
indirect cost savings
    Sales (in EURm) & comparable sales growth (in %)   Key observations for Q4 18
                                                       •   Comparable sales growth increased by 0.2%. An
        5.1%
                                                           improvement on a sequential basis due to LED lamps
                 3.6%
                           0.0%     -1.9%      0.2%

         492      444      443       444        481

        4Q17     1Q18      2Q18     3Q18       4Q18

    Adjusted EBITA (in EURm & as % of sales)
                                                       •   Adjusted EBITA margin increased by 460 bps, mainly as a
                                               14.4%
                                                           result of indirect cost savings
                                    12.0%
                          10.6%
       9.8%      9.6%

         48       43        47       53         69

        4Q17     1Q18      2Q18     3Q18       4Q18
8
Q4 & Full Year 2018 results - February 1, 2019 - Signify
LED business highlights
    Expanded glass filament      Private label wins           Launched TrustSight G3        Launched connected
    decorative range                                          emergency driver in           EvoKit
                                                              Europe

    •   Uses 80% less energy     •   24 tenders won in 2018   •   Self-contained solution   •   Provides cost-effective
        than traditional bulbs                                                                  solution for renovation
                                 •   Ongoing focus on cost    •   Operates LED modules
                                     optimization to remain                                 •   Offers connected
    •   Lasts 10x longer                                          when mains power fails
                                     competitive                                                product with sensor at
    •   Maintains classic look                                •   Un-switched mains line        same price as previous
                                                                  continuously charges          non-connected version
                                                                  TrustSight batteries
                                                                                            •   “Clickable” assembly in 2
                                                                                                minutes, saving > 30% on
                                                                                                transport volume

9
Q4 & Full Year 2018 results - February 1, 2019 - Signify
Professional Adjusted EBITA margin solid at 12.0% as continued indirect cost
savings largely offset the impact from lower sales volumes
 Sales (in EURm) & comparable sales growth (in %)       Key observations for Q4 18
       10.4%
                           3.6%
                                                        •   CSG of -6.9%, on the back of a high comparison base
                 3.2%
                                    0.4%                    which reflected strong market activity in various regions
                                                -6.9%
                                                            and a large-scale project in the US
                                                            • Deteriorated market conditions compared to Q4
                                                               2017, most notably in China and Europe
        775      593       652      675          715

       4Q17      1Q18      2Q18     3Q18        4Q18

     Adjusted EBITA (in EURm & as % of sales)
      12.1%                        11.7%        12.0%   •   Adjusted EBITA margin remained solid at 12.0% as
                                                            continued indirect cost savings largely offset the impact
                          8.4%                              from lower sales volumes
                  5.2%

        94       31        55       79           85

       4Q17     1Q18      2Q18     3Q18         4Q18
10
Professional business highlights
 To illuminate Shanghai’s      To illuminate up to 15 of       Installed architectural          Installed Horti LED
 buildings, bridges and        London’s iconic bridges         lighting on façade of            lighting at French
 rivers                        by 2022                         Beijing’s WTC tower              cucumber growers

 •   Installed more than       •   To install more than        •   Provided 400,000 white       •   Concerns two
     50,000 connected light        22,000 connected Color          LED light points                 greenhouses of 20,000
     points                        Kinetics LED light points   •   Illuminated top by 88            m² and 25,000 m²
 •   Managed through           •   Managed through                 sets of Color Kinetics LED   •   Increased light levels
     Interact Landmark             Interact Landmark               floodlights                      improve cucumber
 •   Our largest ever          •   To provide lifecycle        •   Illustrates growing trend        production
     implementation of             services for the next 10        to make cities more          •   Enables growers to
     connected architectural       years                           attractive with                  increase light levels
     lighting                                                      connected lighting               without increasing heat
                                                                   technologies
11
Home’s sales performance reflects a high comparison base; profitability is
now back on track
 Sales (in EURm) & comparable sales growth (in %)   Key observations for Q4 18
      53.9%                                         •   CSG of -2.6%, due to a high comparison base as US retail
                                                        partners built up inventories in H2 17

                                            -2.6%
                                 -1.4%
                -6.4%   -5.9%

      186      92        89       110        176

      4Q17    1Q18      2Q18     3Q18       4Q18

 Adjusted EBITA (in EURm & as % of sales)
     9.5%                                   8.9%
                                                    •   Adjusted EBITA of EUR 16m showed a significant
                                                        improvement compared with previous quarters,
                                 -6.9%
                                                        reflecting:
       18                                     16        • Higher sales levels
               -21       -25                            • Ongoing cost optimization
                                  -8

              -23.1%
                        -27.9%
      4Q17    1Q18       2Q18    3Q18       4Q18
12
Home business highlights
 Extended Philips Hue           Added Philips Hue and            Updated Hue Power-on            Added RunLessWire to
 Outdoor range                  Google Assistant sleep           Behavior in app                 the Friends of Hue
                                and wake up feature                                              program

 •   Added sensor, wall-        •   Brings voice commands        •   Saves bulb’s last setting   •   Adds more switches to
     mounted fixtures and           to Google Assistant’s            when turned on and off          Philips Hue offering
     new path lighting              sleep and wake up            •   Also saves last setting     •   Switches are self-
 •   Expands number of              feature                          when power is lost              powered
     options to transform the   •   Showcases first                                              •   Easy to setup
     home                           integration of the Philips                                   •   Fit seamlessly in home
                                    Hue sleep and wake up                                            interior
                                    feature with a digital
                                    assistant

13
Cash engine: Lamps maintained free cash flow at 22% of sales

     Lamps Free Cash Flow bridge* (in EURm)                                                                 Key observations

         438
                                                                                                        •    Our cash engine continued to deliver on its “last man
                                                                                            22% of
                                                                                             sales           standing” strategy
                                32                    4
                                                                                                        •    Further market share gains
                                                                          94
                                                                                                  308   •    FCF of EUR 308m in FY 18
                                                                                                        •    FCF as % of sales remained relatively stable at 22%,
                                                                                                             excluding real estate proceeds in 2017 and higher
                                                                                                             restructuring cash-out in 2018

      FCF 2017         Higher real estate         Higher      Decrease in FCF               FCF 2018
                       proceeds in 2017        restructuring
                                             cash-out in 2018

      *Excluding   non-allocated FCF items (e.g. tax, interest) that are accounted for in Other
14
Signify Adj. EBITA margin: improvement driven by indirect cost reductions

       Adjusted EBITA (in EURm)

 as %
of sales   10.9%                                         +150 bps                                  12.4%
                                   Gross margin
                                     -120 bps

                                                                     83           (12)
             207        (44)                                                                (1)      214

                                        (78)
                                                   58

            Q4 17   Volume / Mix       Price      CoGS         Indirect Costs   Currency   Other    Q4 18

15
Working capital as % of sales decreased by 20 basis points y-o-y to 8.4%
driven by lower receivables
Working capital1 (in EURm & as % of sales)                                                                            Inventories (in EURm & as % of sales)

                             10.5%               10.1%                                                                               15.3%       15.2%
           9.0%                                                                                                             14.1%                             13.8%
                                                                     8.4%

           612                 694                659                 536                                                    957      1.009       994          878
                                                                                             -20 bps                                                                  + 50 bps
          1Q18                2Q18               3Q18                4Q18                                                   1Q18      2Q18        3Q18        4Q18

                                                                                                                                     15.3%       16.2%
                                                12.5%
                            11.2%                                                                                           13.8%                             13.3%
         10.1%
                                                                    8.6%

           717                789                 879                597                                                     982      1.082       1.137        924

          1Q17               2Q17                3Q17               4Q17                                                    1Q17      2Q17        3Q17        4Q17

     1 Working capital includes inventories, receivables, accounts and notes payable, other current assets & liabilities,
16
      derivative financial assets & liabilities, and accrued liabilities
Net debt decreased by EUR 148m, mainly due to solid FCF generation partly
used to complete the share repurchase program
In EURm
          737

                               231                                                                                                                                                589
                                                                                                                                                                      6
                                                                                                                                                        125

                                                                                                                                     11
                                                                                                                 29
                                                    147                  14                  45

                                                                               FCF: EUR
                                                                                +279m

       Net debt              EBITDA            Change in           Net capex           Change in Interest & Tax   Other                             Share           Other**     Net debt
     end of Q3 18                               working                                provisions               FCF items                        repurchases*                 end of Q4 18
                                                capital
      *Share   repurchases for cancellation purposes
17     **Other   includes cash used for derivatives and acquisition of business, cash received for sale of business, FX effect on cash, cash equivalents and debt
Content

Welcome & introduction by Eric Rondolat

Financial performance for Q4 18 by Stéphane Rougeot

FY 18 highlights by Eric Rondolat

Outlook & conclusion by Eric Rondolat

Q&A

18
Growing profit engines drive profitable growth as we move to LED,
connected systems and services
     CSG (%)                            Adj. EBITA margin (%)                Free Cash Flow* (in EUR m)

     LED, Professional & Home            LED, Professional & Home            LED, Professional & Home
                     10.1%                                                                                                            370
                                                         8.3%       8.6%
                                                                               353
                                                                                                                         47
         5.4%                                5.4%
                                                                                              20
                                                                                                           10

                                -0.4%

         2016        2017       2018         2016        2017       2018     FCF 2017       Higher      Higher     Increase        FCF 2018
                                                                                         real estate restructuring in FCF
                                                                                          proceeds cash-out in
                                                                                           in 2017       2018

     • CSG of -0.4% for FY18 reflects    • Profitability of our growing      • The growing profit engines already
       high comparison base,               profit engines increased by 30      generate a large FCF
       challenging market                  bps in 2018, despite a negative   • FCF generation continued to increase in
       conditions, and an                  impact of Home (-100 bps)           2018 despite an unanticipated negative
       unanticipated temporary                                                 FCF from Home
       decline in Home
                                                                               *Excluding non-allocated FCF items (e.g. tax, interest) that are accounted
19                                                                             for in Other
Continue to invest in new growth platforms

 Horticulture                             Solar                                     LiFi

 •   Growers benefit from customer-       •   More than 1 billion people do not     •   Extra layer of security thanks to line-
     centric approach, and market             have access to electricity grid           of-sight
     leading products and light recipes   •   Solar is safe and sustainable         •   Able to connect many smart devices
 •   Better growth predictability, crop       solution vs fuel-based alternatives       and multiple users as LiFi bandwidth
     quality and yields                       both for professionals and                is more than 1,000 times the size of
 •   Market projected to grow by more         consumers                                 radio spectrum
     than 20% per year until 2025         •   Market expected to grow more than     •   Ideal for use in radio frequency
 •   Expanded the world’s largest             20% per year until 2024                   sensitive areas or areas with poor or
     horticulture LED installation to     •   Sold more than 300,000 solar lights       no WiFi connection
     equivalent of 100 soccer pitches         in 2018                               •   Over 30 pilots across the world

20
Market dynamics impacted top-line in FY18, solid improvements in margins
                                           Growing profit engines                                                                Cash engine

     LED CSG & Adj. EBITA margin (%)    Professional CSG & Adj. EBITA margin (%)   Home CSG & Adj. EBITA margin (%)    Lamps FCF (in EUR m)

      CSG    12.8%           0.4%         CSG    4.1%              -0.4%            CSG    41.1%            -3.8%

                                                                                                                              438
                                                                                          2.3%
                                                                   9.5%                                                                       308
                            11.7%                 8.3%
            9.9%

                                                                                                          -8.1%

            2017             2018                2017               2018                  2017            2018               2017             2018

      • Improving top-line in LED           • CSG impacted by                       • The decline mainly reflects       • Continued to optimize
        electronics was offset by the         deteriorating market                    high demand from trade              cash to fund growth: FCF
        anticipated decline in LED            conditions in various regions           partners in the US in H2 2017       of our cash engine, Lamps,
        lamps                                 (China, Europe)                         which led to a high comparison      was EUR 308m
                                                                                      base and lower sales levels in
      • Margin improvement driven           • Margin improvement mainly
                                                                                      H1 18 to allow for inventory
        by procurement savings and            driven by lower indirect costs
                                                                                      reductions at these trade
        indirect cost savings
                                                                                      partners

21
Currency comparable adjusted indirect costs decreased by 10% in FY18

 Adj. indirect cost savings per quarter (in EUR m)                                                   Key observations
                                                                                                     • EUR 224m saved in FY18, down 10%, or 180
                                                     89          31.5%
                                                                                                       bps of sales, excl. FX
                                                      6
      73           71
                                    65                                                               • Progress made in 2018:
                                                                                     29.8%
                                     7
      35           25                                                                                 •   Reduced non-manufacturing workforce by
                                                      83                                                  10% through organization simplification
                                    58
                   46                                                                                     •   80% reduction in contingent workers
      38
                                                                  2.194              1.896            •   Indirect material spend lowered by 50 bps
     1Q18        2Q18              3Q18              4Q18   Adj. indirect costsAdj. indirect costs        as % of sales
                                                                   FY17               FY18
            Currency effect on adj. indirect costs                                                    •   Office space reduced by 12%
                                                                                                      •   Improved direct shipment and digital
                                                                                                          capabilities

22
Our 2018 results
                                                          2018 result      Achievement               2020 target

                               Sustainable revenues       79.0%            Increasing energy         80%
   Sustainable
    revenues

                                                                           efficiency of portfolio
                                                          1.7 billion
                               LED lamps &                                 87% of our commitment
                                                          (cumulative                            >2 billion
                               luminaires delivered                        completed
                                                          from 2015)
                                                                           49% decrease vs 2017
                               Carbon footprint           Net 146 kt CO2   9 markets carbon          Net 0 kt CO2
                                                                           neutral
      Sustainable operations

                               Waste to landfill          2.4 kt           17% decrease vs 2017      0 tonnes

                               Safe & healthy             TRC = 0.29       59% improvement from
                                                                                                TRC = 0.35
                               workplace                                   our 2015 baseline

                                                          93%                                        90%
                                                                           93% of risk suppliers
                               Sustainable supply chain   performance                                performance
                                                                           passed the audit
                                                          rate                                       rate
Attractive shareholder return
 2018 dividend EUR 1.30 to be paid in 2019

     Dividend 2018 (in EURm)                                                             Key observations
                                                               FY 2018                  • Proposed dividend increase of 4% at EUR 1.30 per share;
     Net income attributable to shareholders                       263                    pay-out ratio of 46%

     Restructuring costs                                           118                  • Disciplined management of balance sheet
     Incidentals*                                                   10
                                                                                        • Continue to look for non-organic growth opportunities
     Tax impact                                                    -34                    primarily through small- to medium-sized acquisitions
     Continuing net income                                         357
                                                                                        • If in the course of the year, the funds needed for non-
     Total dividend                                                164
                                                                                          organic growth opportunities are substantially less than
     Total number of outstanding shares (million)**                126                    the capital available, we will consider other use of our
                                                                                          capital, which includes returning excess cash to
                                                                                          shareholders through share repurchases

                                                         EUR 1.30 per share

24      • Other incidentals consists of acquisition-related charges, separation costs and other incidentals
        ** Excluding treasury shares
EUR 1.1bn returned to shareholders since IPO, incl. proposed 2018 dividend

 Cash available                                                 Return to shareholders since IPO (in EURm)
 •   Continued free cash flow generation
 •   Managing our financial ratios to maintain a financing                 1,127
                                                                                                       1,055
     structure compatible with an investment-grade profile
                                                                                                                  Share repurchases
                                                                                                        563       for cancellation
 Cash uses since IPO
 •   Dividend of EUR 492m since the IPO, including proposed
                                                                                                                  Dividend
     dividend of 2018                                                                                   492

 •   Seized non-organic growth opportunities, e.g. LiteMagic,
     Stack Lighting, PointGrab                                   Cash generation 2016-2018 Shareholder returns since IPO

 •   Contributed EUR 114m to US Pension Fund since the IPO
 •   Repurchased shares for EUR 68m to cover performance
     share plans
 •   Repurchased shares for EUR 563m for cancellation

25
Our financial measures have significantly improved over the last five years

       Transition from             Significantly improved       Transition to an asset-
                                                                                               Strong FCF generation
     conventional to LED                 profitability           light business model

        Total LED sales               Adjusted EBITA margin       Gross capex as % of sales         FCF as % of sales
        (as % of sales)

                                                                   2.8%
                             71%
                                      +370              10.1%                                                           4.8%
       +19%
       CAGR                            bps

                                                                                        1.3%
                                                                                                ~1.0%
          26%
                                      6.4%

       2013               2018        2013           2018          2013             2018          2013            2018

      In 2018, LED-based                Substantial              Gross capex as % of           Solid FCF generation:
     sales grew by 2.5% on            improvement in               sales has been               EUR 306m of FCF in
      a comparable basis           Adjusted EBITA margin          strongly reduced                     2018

26
Content

Welcome & introduction by Eric Rondolat

Financial performance for Q4 18 by Stéphane Rougeot

FY 18 highlights by Eric Rondolat

Outlook & conclusion by Eric Rondolat

Q&A

27
Outlook 2019

          • Our growing profit engines (LED, Professional and Home combined), are expected to
            deliver a CSG in the range of 2 to 5%
          • Our cash engine, Lamps, is expected to decline at a slower pace than the market in
            the range of -21 to -24% on a comparable basis.

          • For total Signify, we aim to reach an Adjusted EBITA margin within the range of 11.0-13.0%
     %      (as set at the time of the IPO in May 2016)

          • Expect free cash flow to be above 5% of sales

28
Signify Path to value – Targeting Adj. EBITA margin of 11-13% by 2019
                                                                   Signify
                                                                                            +90-290 bps     11-13%

                                                                                    10.1%
                                                          +370bps
                                            6.4%

                                            2013                                    2018                    2019

                                                         Growing profit engines                                                            Cash engine

                                    LED                              Professional                              Home                          Lamps
                                                                                    11-14%
                                                                                                                                             21.1%
                                                10-12%                                                                                               > 16%
                                   11.7%
                                                                         9.5%                                                      16.4%

                                                            2.2%                                                            5-8%

                                                           2013          2018        2019                                          2013       2018       2019
                       -2.1%                                                                                    -8.1%
                                                                                                   -11.6%
                        2013        2018        2019                                                2013        2018        2019

     Expected margin           Reached target                                                             +1,310 to 1,610
                                                               +150 to 450 bps
      improvement                  range                                                                       bps
29
Q&A

30
71% of sales is LED-based and growing by 2.5% on a comparable basis

 LED-based sales continue to grow by CAGR of 22%
 (in % of total sales)                             LED-based sales of EUR 4.5bn in FY 18, CSG of 2.5%

                                                            LED Home
                                                               10%
                                           71%              (CSG 0.8%)
                                   65%
                           55%                                                              BG LED
                                                                                             40%
                    43%                                                                   (CSG 0.4%)
            34%
     26%
                                                          LED
                                                      Professional
                                                          50%
                                                       (CSG 4.4%)
     2013   2014   2015    2016    2017    2018

31
Currency movements had a negative impact on sales and Adjusted EBITA
 Q4 18 Sales FX Footprint (% of total)       Key observations
                                         •    Currency movements negatively impacted sales and
                                              Adjusted EBITA
       Other
                                  EUR
                                  32%
                                         •    Sales impact of EUR -32m, mainly coming from the
     Currencies
        36%
                                              devaluation of emerging market currencies
                                         •    Adjusted EBITA impact of EUR -12m, and -50 bps on
                                              the Adjusted EBITA margin, mainly from emerging
                                              market currencies
                                         •    Our policy is to hedge 100% of committed FX
                                              transactions and anticipated transactions up to 80%
                                              in layers over the next 15 months
                  CNY
                  7%        USD
                            25%

32
Net income improved to EUR 119m, mainly as a result of improved
     operational profitability and lower restructuring

         From Adjusted EBITA to net income (in EURm)              Key observations
                                                  Q4 17   Q4 18
         Adjusted EBITA                            207     214
         - Restructuring                            -75     -27
         - Acquisition related charges               0       -1
                                                                      Gain of EUR 16m associated with tax related reliefs
     1   - Other incidental items                   -12     11    1
                                                                      linked to the separation
         EBITA                                     119     197
         Amortization                               -45     -24
                                                                      Last year’s amortization included an impairment of
     2                                                            2
                                                                      other intangible assets related to Professional
         EBIT                                       75     173
         Net financial income / expenses            -12      -7
                                                                      Income tax expense increased by EUR 22m mainly due
 3       Income tax expense                         -25     -47   3
                                                                      to higher taxable earnings in Q4 18
         Results from investments in associates      0       -1
         Net income                                 38     119

33
Free Cash Flow of EUR 279m

     Free cash flow (in EURm)                                  Key observations
                                              4Q17     4Q18    •   Free cash flow of EUR 279m as a result of better
     Income from operations                      75     173        working capital management throughout the year
     Depreciation and amortization               88       58
                                                               •   In Q4 17, we started with a high level of working capital,
     Additions to (releases of) provisions       99       28
                                                                   most notably in inventories
     Utilizations of provisions                 -61      -73
     Change in working capital                 259      147    •   Free cash flow in Q4 18 included higher restructuring
     Interest paid                               -5       -7       cash-out of EUR 36m (Q4 17: EUR 25m) and an outflow
     Income taxes paid                          -18      -22       of EUR 5m related to the company name change
     Net capex                                  -22      -14
     Other                                       18      -11
     Free cash flow                            434      279
     As % of sales                           22.9%    16.2%

34
You can also read