SEAWORLD INVESTOR PRESENTATION ICR CONFERENCE - January 8, 2018
←
→
Page content transcription
If your browser does not render page correctly, please read the page content below
SEAWORLD
INVESTOR PRESENTATION
    ICR CONFERENCE
      January 8, 2018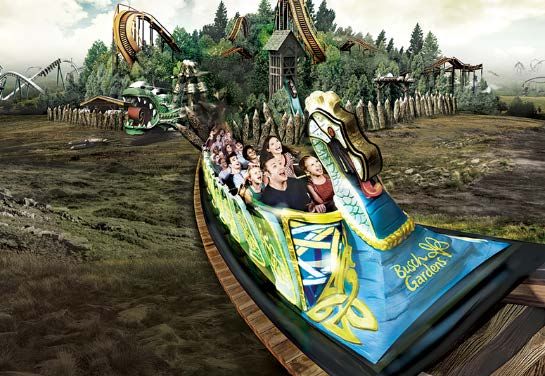
Disclosures
Statement Regarding Forward-Looking Statements
This presentation contains “forward-looking statements” within the meaning of U.S. federal securities laws. All statements contained in this presentation other than statements of historical
facts are forward-looking statements. Words such as “might,” “will,” “may,” “should,” “estimates,” “expects,” “continues,” “contemplates,” “anticipates,” “projects,” “plans,” “potential,” “predicts,”
“intends,” “believes,” “forecasts,” “future”, “guidance” , “targeted” and variations of such words or similar expressions are intended to identify forward-looking statements.
Forward-looking statements are not historical facts, and are based upon management’s current expectations, beliefs, estimates and projections, and various assumptions, many of which are
inherently uncertain and beyond our control. Such expectations, beliefs, estimates and projections are expressed in good faith and management believes there is a reasonable basis for
them. However, there can be no assurance that management’s expectations, beliefs, estimates and projections will be achieved and actual results may differ materially from what is
expressed in or indicated by the forward-looking statements. Forward-looking statements are subject to risks and uncertainties that could cause actual performance or results to differ
materially from those expressed in the forward-looking statements, including risks detailed in SeaWorld Entertainment, Inc.’s (“SeaWorld” or the “company”) 2016 Annual Report on Form
10-K as filed with the U.S. Securities and Exchange Commission (the “SEC”), as such risk factors may be updated from time to time in our periodic filings with the SEC. Forward-looking
statements speak only as of the date the statements are made. The company assumes no obligation to update forward-looking statements to reflect actual results, subsequent events or
circumstances or other changes affecting forward-looking information except to the extent required by applicable securities laws.
Statement Regarding Non-GAAP Financial Measures
This presentation includes several metrics which are not calculated in accordance with the generally accepted accounting principles in the United States (“GAAP”), including Adjusted
EBITDA and Free Cash Flow. These metrics have important limitations and should not be considered in isolation or as a substitute for measures of a company’s financial performance or
liquidity prepared in accordance with GAAP. In addition, these metrics, as presented, may not be comparable to similarly titled measures of other companies due to varying methods of
calculations.
Adjusted EBITDA is defined as net income (loss) before income tax expense, interest expense, depreciation and amortization, as further adjusted to exclude certain non-cash, and other
items permitted in calculating covenant compliance under the credit agreement governing the company’s Senior Secured Credit Facilities. Management believes the presentation of
Adjusted EBITDA is appropriate as it eliminates the effect of certain non-cash and other items not necessarily indicative of the company’s underlying operating performance. Management
uses Adjusted EBITDA in connection with certain components of its executive compensation program. In addition, investors, lenders, financial analysts and rating agencies have historically
used EBITDA-related measures in the company’s industry, along with other measures to estimate the value of a company, to make informed investment decisions and to evaluate a
company’s ability to meet its debt service requirement. The presentation of Adjusted EBITDA also provides additional information to investors about the calculation of, and compliance with,
certain financial covenants in the company’s Senior Secured Credit Facilities. Adjusted EBITDA is a material component of these covenants.
Free Cash Flow is defined as net cash provided by (used in) operating activities less capital expenditures. Management believes that Free Cash Flow is useful to investors, equity analysts
and rating agencies as a liquidity measure. The company uses Free Cash Flow to evaluate its ability to generate cash flow from business operations. Free Cash Flow does not represent the
residual cash flow available for discretionary expenditures, as it excludes certain expenditures such as mandatory debt service requirements, which are significant. Free Cash Flow is not
defined by GAAP and should not be considered in isolation or as an alternative to net cash provided by (used in) operating, investing and financing activities or other financial data prepared
in accordance with GAAP. Free Cash Flow as defined above may differ from similarly titled measures presented by other companies. Prior to the second quarter of 2016, the company’s
definition of Free Cash Flow differed from the above. The company changed the definition of Free Cash Flow to provide a more meaningful metric to investors. Prior year amounts have
been calculated using the above definition in all periods presented. For a reconciliation of Adjusted EBITDA to net income (loss) and Free Cash Flow to net cash provided by (used in)
operating activities, please refer to the Appendix in this presentation or our Quarterly Earnings Release, which can be found at our website www.seaworldentertainment.com.
Statement Regarding Use of Registered Trademarks
The company owns or has rights to use a number of registered and common law trademarks, service marks and trade names in connection with its business in the United States and in
certain foreign jurisdictions, including SeaWorld Entertainment, SeaWorld Parks & Entertainment, SeaWorld®, Busch Gardens®, Aquatica®, Discovery Cove®, Sea Rescue®, and other
names and marks that identify our theme parks, characters, rides, attractions and other businesses. In addition, the company has certain rights to use Sesame Street® marks, characters
and related indicia through certain license agreements with Sesame Workshop (f/k/a Children’s Television Workshop).
Solely for convenience, trademarks, service marks and trade names referred to in this presentation may be without the ® and ™ symbols, but such references are not intended to indicate, in
any way, that the company will not assert, to the fullest extent under applicable law, its rights or the rights of the applicable licensors to these trademarks, service marks, and trade names.

                                                                                                                                                                                                          2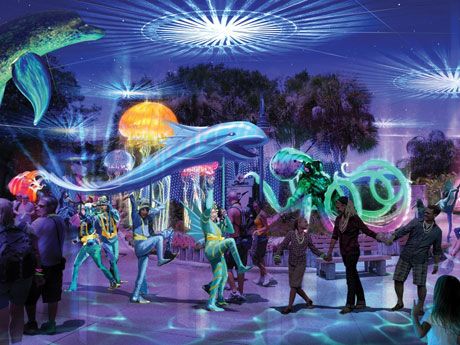
COMPANY OVERVIEW

A Unique Theme Park and Entertainment Company

                     Providing
                  experiences that
                matter and inspiring
                 guests to protect
                animals and the wild
                   wonders of our
                       world

                                                4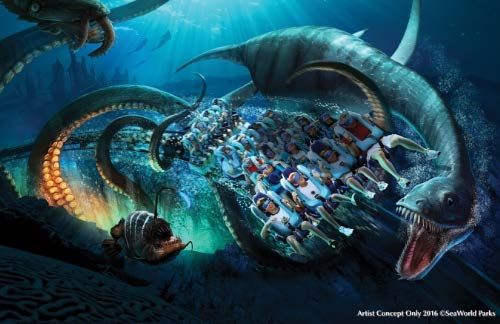
A One of a Kind Portfolio

Busch Gardens Williamsburg       Discovery Cove     SeaWorld Orlando

                                                                       5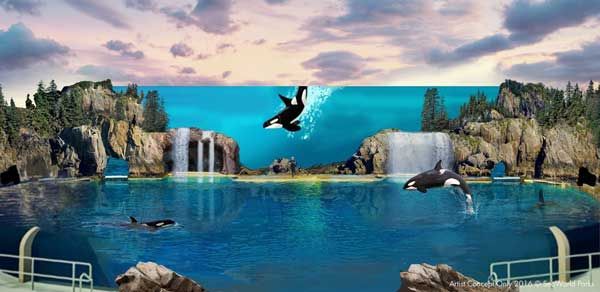
Executing Our Strategy
1 Taking Action to Address the Challenges
2 Repositioning Brand to Experiences that Matter
Investing in Distinct Guest Experiences: Fun and
3
Meaningful
4 Focused on Organic and Strategic Revenue Growth
5 Enhancing Financial Discipline
We are moving quickly and continue to execute a deliberate strategy
to improve performance and increase value for investors
6
1   Taking Action to Address the Challenges

     • Leadership: New Leadership Team

     • Reputation
        - Ended Orca Breeding Program, transitioned from
             entertainment to educational focus
     • Refocus
        -   Following Orca announcement, discontinued $300 Million
            Blue World Project
        -   Redeployed Capital to cost-effective and higher return
            attractions

                                                                     7
Repositioning Brand
2
                   to Experiences that Matter
    • Repositioning
       -   From “Animal Entertainment” to “Experiences that Matter”
       -   Highlight our role as global leader in animal rescue,
           rehabilitation, release and research
    • Unique Experiences
       -   Going beyond standard theme and water parks
       -   Engaging the community with SeaWorld’s wildlife enrichment
           programs
       -   World class attractions explain our mission and vision

                                                         8

    EXPLORE                        INSPIRE                       ACT

                                                                        8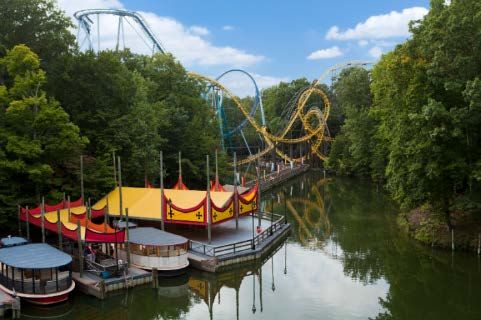
“From Park to Planet”

   Click here to view video

                              9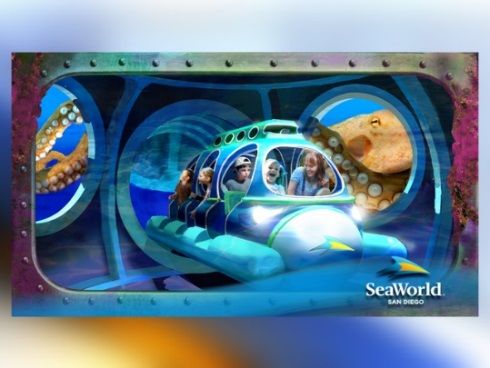
3   Investing in Distinct Guest Experiences:
               Fun and Meaningful
                     Wave Breaker: The Rescue Coaster
                     • Multi-launch Roller Coaster
                     • Ocean inspired, animal rescue themed attraction
                     • First of its kind in North America
                     • Located at SeaWorld San Antonio

                     Kraken® Unleashed: Virtual Reality Experience
                     • SeaWorld’s first virtual reality coaster
                     • Retrofitted existing coaster
                     • Sea creature themed ride inspired by extinct and
                        legendary animals of the past
                     • Located at SeaWorld Orlando

                     InvadR
                     • First wooden roller coaster, eighth coaster in park
                     • Features 70 foot drop, nine airtime hills and 2,100 feet
                        of track including woodlands and underground tunnel
                     • Located at Busch Gardens Williamsburg

                                                                                  10
3 Investing in Distinct Guest Experiences:
Fun and Meaningful
New Orca Encounter
• Educational experience
• Focused on marine science research and rescue
• Live documentary showcasing Orca enrichment, exercise
and overall health
• Located at SeaWorld San Diego
Ocean Explorer
• A new 3-acre family-friendly realm combining multiple
aquariums, exciting rides and digital technologies
• Guests can get up close to real giant Pacific octopuses,
Japanese spider crabs and California moray eels in three
uniquely designed aquariums
• Located at SeaWorld San Diego
Electric Ocean
• A brand new, end-of-day event for guests
• Features bioluminescent lighting, music and pathway
entertainment, immersing guests in a glowing sea of
wonder
• Has garnered positive attention on social media as the
“best night show in Orlando”
• Featured in SeaWorld Orlando and SeaWorld San Diego
114
Driving Organic and Strategic
Revenue Growth
• Season Pass
- Initial 2018 pre-sales increased high-single digits vs. prior year (as
of Sept. 2017)
- 2017 Sept. YTD 300 mile radius attendance higher vs. 2016 in
Orlando and San Antonio
- 2017 Sept. YTD Season Pass sales higher in all markets except
California
• Committed to Consistent Capital Investment
- Six new rides and attractions in 2017 compared to three in 2016
• Reinvigorated Marketing Campaign
- Increasing investment in national advertising in 2018 featuring
“From Park to Planet” inspirational message
- Reinvesting in reputation messaging in California market
• Pricing: Admission Per Cap Opportunities
124
Driving Organic and Strategic
Revenue Growth Continued
• Strategic Partnerships
- SeaWorld Abu Dhabi set to open by 2022 - Capital-lite partnership is
a template for future international expansion
- Agreement with ZhongHong Holding Co. to advise and support
development of theme parks, water parks and family entertainment
centers in China, Taiwan, Hong Kong and Macau
- Entered licensing agreement with Sesame Workshop as exclusive
theme park partner in the U.S., scheduled to open a second Sesame
Place theme park no later than mid-2021
- Hotel Strategy:
- Evans Group in SD
- TBD for other cities
135 Enhancing Financial Discipline
• Cost Savings
- Achieve $40 million of net cost savings by end of 2018
- Identifying additional $25 million in potential savings
• Improved Balance Sheet Health
- Renewed and increased capacity of revolving credit facility to
$210 million
- Refinanced $1 billion of existing term debt (2/3 of total term debt)
- Term loans are competitively priced, maturities are better
staggered increasing financial flexibility
• Disciplined Investment
- Targeting minimum 20% cash-on-cash returns on new projects
- Prioritizing capital deployment to highest returning projects
14THE END
APPENDIX
INVESTMENT THESIS
 Why SeaWorld Entertainment?
Why SeaWorld?

1           A One of a Kind Portfolio

2        Strategic Growth Opportunities

3               Free Cash Flow

4        Disciplined Capital Deployment

5   Experienced and Focused Leadership Team

6            Executing Our Strategy

                                              18
1 A One of a Kind Portfolio
Busch Gardens Williamsburg Discovery Cove SeaWorld Orlando
192 Strategic Growth Opportunities
Evolutionary Product Revolutionary Growth
Growth • i.e., Extend company-
• i.e., Evans Hotels Group as branded entertainment
New New
hotel partner in San Diego outside of parks
Businesses in Businesses in
Existing Markets New Markets
PRODUCTS / CONCEPTS
• Hotel / Resort options • Opportunistically
assess compelling
projects
Improve Existing Existing
Businesses Businesses in
New Markets
• Organic growth leads to Evolutionary Market
strategic growth • Multi-park Growth
opportunities international • Partnership to develop
development SeaWorld Abu Dhabi, a first-
• Discovery Cove
• Sesame Place of-its-kind marine life themed
license agreement park on Yas Island
• Entered into a license
agreement with Sesame
Workshop to open another
Sesame Place theme park
no later than mid-2021
MARKETS / GEOGRAPHIES
203 Free Cash Flow
$ in millions
$129 1
$120
$107
1
$45
2014 2015 2016 LTM 2017 2
Net cash provided
$262 $286 $280 $209
by Operations
Capital Expenditures $155 $157 $161 $165
• Strong Free Cash Flow business with Positive Free Cash Flow, even in challenging years
• Stable and inexpensive debt
• The company has projected to have federal NOL’s to defer paying any cash taxes until
3
2023
• Free Cash Flow will be deployed to maximize shareholder value over long term
1 May not foot due to rounding.
2 Represents the twelve month period ended September 30, 2017.
3 As of September 30, 2017 214 Disciplined Capital Deployment
$ in millions
• Committed to reinvesting in the business
Capital Expenditures
Average $166 • Disciplined capital spend and ROI hurdles
– Generally target a minimum 20% cash on
$192 cash project returns
$166 $155 $157 $161 $165
– Prioritize capital deployment where
highest returns are generated
• Establish cadence of capital with customer-
facing major and minor attractions
1 – Helps address competition in key tourist
2012 2013 2014 2015 2016 LTM 2017 markets with most upside
– Focus on uniqueness of brands and guest
Growth Capital Approach (~75%) preferences
Drive revenue growth across portfolio of parks, • Leverage value add technology in unique and
New attractions
target key markets at regular intervals
differentiated ways
Unique offerings aimed at driving repeat visitation
Events – Increase mobile engagement utilizing in-
and providing value
park Wi-Fi
Drive per capita growth through culinary,
Revenue initiatives merchandise, animal experiences and – Reduce lines and hassles for guests
interactions, etc.
– Deliver personalized experience
Sustainment Capital Approach (~25%) • Ongoing analysis to measure and manage
Safety, animal welfare, maintain guest performance
Infrastructure
expectations and cleanliness
1 Represents the twelve month period ended September 30, 2017
225 Experienced and Focused Leadership Team
Years with Years in
Name Title
SEAS Industry
Joel Manby President & Chief Executive Officer, Director 2.5 18.5
Marc Swanson Chief Financial Officer 17 17
Anthony Esparza Chief Creative Officer 2 33.5
John Reilly Chief Parks Operations Officer 32 32
Chief Legal Officer, General Counsel & Corporate
G. Anthony (Tony) Taylor 17 17
Secretary
Dr. Chris Dold Chief Zoological Officer 12 12
Denise Godreau Chief Marketing Officer 1 20.5
Chief Accounting Officer
Elizabeth Gulacsy 20+ years experience in corporate accounting/reporting 4.5 4.5
roles
Chief Human Resources and Culture Officer
Jack Roddy 1 1
20+ years experience including Starbucks and Luxottica
Note: Tenure as of August 8, 2017.
236 Executing Our Strategy
Delivering results
• Improved attendance from
Executing a clear strategy Ongoing actions guests within 300 miles of
to improve performance parks in Orlando and San
Antonio for nine months of
and increase value for
shareholders • Delivered robust lineup of 2017
new rides and attractions for • Season pass sales and
• Repositioned brand 2017 season pass utilization up in
• Introduced innovative new • Building centralized pricing all markets outside of
team to achieve stronger California
rides and attractions
• Developing new pricing
ticket yields and season • Efficient capital deployment
pass improvements strategy – more attractions
strategies
• Executing an enhanced cost with less capital
• Enhancing financial optimization plan
discipline with greater focus
on margin improvement
24Reconciliation of Non-GAAP
Financial Measures
$ in millions
LTM Q3 Q3
2012 2013 2014 2015 2016
20172 2016 2017
Net income (loss) $74 $52 $50 $49 $(13) $(194) $66 $55
Provision for income taxes 37 26 29 24 9 (93) 72 34
Loss on early extinguishment of debt 2 30 -- 21 -- 8 -- --
Interest expense 111 90 82 66 63 76 15 20
Depreciation & amortization 167 166 176 183 200 164 41 42
Goodwill impairment charges -- -- -- -- -- 269 -- --
Equity-based compensation expense 2 6 2 7 38 22 3 3
Other non-cash expenses 10 10 5 6 9 11 -- 7
Other business optimization expenses -- -- 12 2 12 20 -- 6
Other items -- -- -- 1 -- 4 -- 2
Other adjusting items 1 1 3 1 3 5 -- 1
Estimated cost savings -- -- 10 2 10 10 -- --
Secondary offering costs -- 1 1 -- -- -- -- --
Debt refinancing costs 5 4 -- -- -- -- -- --
Termination of advisory agreement -- 50 -- -- -- -- -- --
Advisory fees 6 3 -- -- -- -- -- --
Adjusted EBITDA1 $415 $439 $370 $361 $332 $304 $196 $172
1 Columns may not foot due to rounding.
2 Represents the twelve month period ended September 30, 2017.
25Reconciliation of Non-GAAP
Financial Measures
$ in millions
2014 2015 2016 LTM 20172
Net cash provided by operating
$262 $286 $280 $209
activities
Capital expenditures 155 157 161 $165
Free Cash Flow1 $107 $129 $120 $45
1 Columns may not foot due to rounding.
2 Represents the twelve month period ended September 30, 2017.
26Efficient Debt
$ in millions
Ratings Coupon Floor Maturity Amount1,4 xEBITDA2
5
Cash and Cash Equivalents3 Corp: B2 / B (Negative) $52
Revolver $210 L + 275 -- Mar-22 0
Term Loan B-2 B2 / B L + 225 0.75% May-20 558
Term Loan B-5 B2 / B L + 300 0.75% Mar-24 993
Total Debt $1,551 5.10x
Total Net Debt $1,499 4.93x
• Effectively staggered maturities by extending
approximately $1 billion of term loan debt through March
Amortization
2024 $191
TLB-2
• Inexpensive debt with no near-term maturities
TLB-5
• WACD = 4.79% Undrawn Revolver
• Approximately 64% of debt fixed through hedging until
May 2020
• Revolver capacity sufficient for liquidity needs for the $931
foreseeable future
1 As of September 30, 2017.
2 Calculated using Adjusted EBITDA for the twelve month period ended September 30, $523
2017.
3 Excludes Parent Company-only cash balance.
4 Column may not foot due to rounding.
$6 $24 $13 $20
5 The Revolving Credit Facility will mature on the earlier of March 31, 2022 and a
springing maturity of 91 days prior to the maturity of the Term B-2 Loans.
$24 $10
2017 2018 2019 2020 2021 Thereafter
27Q3 2017 Financial Results
In millions, except per capita data
Variance favorable / (unfavorable); Columns may not foot due to rounding
1 Defined as admissions revenue divided by attendance
2 Defined as food, merchandise, and other revenue divided by attendance
28Historical Financial Highlights
$ in millions, except per capita data
LTM
2012 2013 2014 2015 2016
20172
Theme Park Attendance 24.391 23.391 22.399 22.471 22.000 20.915
Total Revenue per
$58.37 $62.43 $61.51 $61.01 $61.10 $60.50
Capita1
Total Revenue $1,424 $1,460 $1,378 $1,371 $1,344 $1,265
Adjusted EBITDA $415 $439 $370 $361 $332 $304
Capital Expenditures $192 $166 $155 $157 $161 $165
1 Calculated as total revenue divided by attendance.
2 Represents the twelve month period ended September 30, 2017. 29SEAWORLD
ICR CONFERENCE
INVESTOR PRESENTATION
January 8, 2018You can also read