BASE METALS World class assets, leading capabilities and attractive growth options - Anglo American

Page created by Glen Griffin
 
CONTINUE READING
BASE METALS World class assets, leading capabilities and attractive growth options - Anglo American
BASE METALS
World class assets, leading capabilities and attractive growth options
Ruben Fernandes – CEO, Base Metals
October 2019
BASE METALS World class assets, leading capabilities and attractive growth options - Anglo American
CAUTIONARY STATEMENT
•   Disclaimer: This presentation has been prepared by Anglo American plc (“Anglo American”) and comprises the written materials/slides for a presentation concerning Anglo American. By attending this
    presentation and/or reviewing the slides you agree to be bound by the following conditions. The distribution of this document in certain jurisdictions may be restricted by law and persons into whose
    possession this document comes should inform themselves about, and observe, any such restrictions.
•   This presentation is for information purposes only and does not constitute an offer to sell or the solicitation, inducement or an offer to buy shares in Anglo American or any other securities. Further, it does
    not constitute a recommendation by Anglo American or any other party to sell or buy shares in Anglo American or any other securities and should not be treated as giving investment, legal, accounting,
    regulatory, taxation or other advice.
•   No representation or warranty, either express or implied, is provided in relation to the accuracy, completeness or reliability of the information contain herein. None of Anglo American, its affiliates, advisors or
    representatives shall have any liability whatsoever (in negligence or otherwise) for any loss howsoever arising from any use of this material or otherwise in connection with this material.
•   Forward-looking statements
•   This presentation includes forward-looking statements. All statements other than statements of historical facts included in this presentation, including, without limitation, those regarding Anglo American’s
    financial position, business, acquisition and divestment strategy, dividend policy, plans and objectives of management for future operations (including development plans and objectives relating to Anglo
    American’s products, production forecasts and reserve and resource positions), are forward-looking statements. By their nature, such forward-looking statements involve known and unknown risks,
    uncertainties and other factors which may cause the actual results, performance or achievements of Anglo American, or industry results, to be materially different from any future results, performance or
    achievements expressed or implied by such forward-looking statements.
•   Such forward-looking statements are based on numerous assumptions regarding Anglo American’s present and future business strategies and the environment in which Anglo American will operate in the
    future. Important factors that could cause Anglo American’s actual results, performance or achievements to differ materially from those in the forward-looking statements include, among others, levels of
    actual production during any period, levels of global demand and commodity market prices, mineral resource exploration and development capabilities, recovery rates and other operational capabilities, the
    availability of mining and processing equipment, the ability to produce and transport products profitably, the availability of transport infrastructure, the impact of foreign currency exchange rates on market
    prices and operating costs, the availability of sufficient credit, the effects of inflation, political uncertainty and economic conditions in relevant areas of the world, the actions of competitors, activities by
    governmental authorities such as permitting and changes in taxation or safety, health, environmental or other types of regulation in the countries where Anglo American operates, conflicts over land and
    resource ownership rights and such other risk factors identified in Anglo American’s most recent Annual Report. Forward-looking statements should, therefore, be construed in light of such risk factors and
    undue reliance should not be placed on forward-looking statements. These forward-looking statements speak only as of the date of this presentation. Anglo American expressly disclaims any obligation or
    undertaking (except as required by applicable law, the City Code on Takeovers and Mergers (the “Takeover Code”), the UK Listing Rules, the Disclosure and Transparency Rules of the Financial Conduct
    Authority, the Listings Requirements of the securities exchange of the JSE Limited in South Africa, the SIX Swiss Exchange, the Botswana Stock Exchange and the Namibian Stock Exchange and any other
    applicable regulations) to release publicly any updates or revisions to any forward-looking statement contained herein to reflect any change in Anglo American’s expectations with regard thereto or any
    change in events, conditions or circumstances on which any such statement is based.
•   Nothing in this presentation should be interpreted to mean that future earnings per share of Anglo American will necessarily match or exceed its historical published earnings per share.
•   Certain statistical and other information about Anglo American included in this presentation is sourced from publicly available third party sources. As such it has not been independently verified and presents
    the views of those third parties, but may not necessarily correspond to the views held by Anglo American and Anglo American expressly disclaims any responsibility for, or liability in respect of, such
    information.
•   No Investment Advice
•   This presentation has been prepared without reference to your particular investment objectives, financial situation, taxation position and particular needs. It is important that you view this presentation in its
    entirety. If you are in any doubt in relation to these matters, you should consult your stockbroker, bank manager, solicitor, accountant, taxation adviser or other independent financial adviser (where
    applicable, as authorised under the Financial Services and Markets Act 2000 in the UK, or in South Africa, under the Financial Advisory and Intermediary Services Act 37 of 2002).
•   Alternative Performance Measures
•   Throughout this presentation a range of financial and non-financial measures are used to assess our performance, including a number of financial measures that are not defined or specified under IFRS
    (International Financial Reporting Standards), which are termed ‘Alternative Performance Measures’ (APMs). Management uses these measures to monitor the Group’s financial performance alongside IFRS
    measures to improve the comparability of information between reporting periods and business units. These APMs should be considered in addition to, and not as a substitute for, or as superior to, measures
    of financial performance, financial position or cash flows reported in accordance with IFRS. APMs are not uniformly defined by all companies, including those in the Group’s industry. Accordingly, it may not
    be comparable with similarly titled measures and disclosures by other companies.

                                                                                                                                                                                                                            2
BASE METALS World class assets, leading capabilities and attractive growth options - Anglo American
RESILIENT PORTFOLIO BENEFITS FROM MACRO TRENDS…
WHILST ASSET QUALITY PLAYS TO GLOBAL DEMAND THEMES
     Consumer                               Greener                            Electrified                  Electrified
        World                                World                               World                        World

 ~1.4 billion                                                                                       Diamonds                WORLD
                                                                                                                            LEADER

 global population increase by 2035                                                                 aspiration &
                                                                                                    growing prosperity

                                                                                                    Copper               WORLD CLASS
                                                                                                                          GROWTH
             Rural population
                                                                                                    electrification
             Urban population
                                                                                                    supporting renewables

                                                                                   2000 2018 2035

                                                              2000 2018 2035           China
                                                                                                    PGMs                    WORLD
                                                                                                                            LEADER
                                                                  India
                                             2000 2018 2035
                                                                                                    air quality &
                                                Africa                                              lower emissions

                           2000 2018 2035

                                 South
                                America
                                                                                                    Bulks                HIGH QUALITY
                                                                                                                            NICHE
                                                                                                    modern infrastructure
                                                                                                    development

                                                                                                                                        3
BASE METALS World class assets, leading capabilities and attractive growth options - Anglo American
WELL POSITIONED FOR OUR NEXT TRANSFORMATION

      Competitive                      Sustainable                    Differentiated
       Average quality                Net debt : EBITDA              Cu Equivalent Growth3
 adjusted cost curve position                                             2018-2023

                                                                    ~20-25%
                                                             1.2x

                                47%

                              Peer
                             range
                                                                                             ~15%
    36%                                                      Peer
                                                            range
                                34%
                                                                                              Peer
                                                                                             range
                                      0.3x
                                                                                             ~5%
                                                             0.2x

                    Peers1                         Peers2                          Peers2

                                                                                                     4
BASE METALS World class assets, leading capabilities and attractive growth options - Anglo American
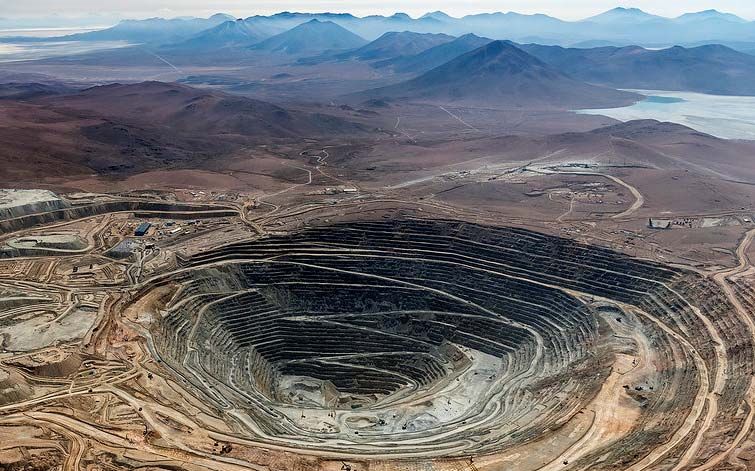
ANGLO AMERICAN’S BASE METALS BUSINESS

                        Structure                                                                 2018 Key Metrics
                              AA Sur                                         Copper Production (ktpa)                   Quellaveco production
                                                                                                                        100%, first 10-year average
                                                                                     ~1.2 Mt
3 operated assets:     Los Bronces and El Soldado        Chagres Smelter
                                                 Bcrux 29.50%                                                 ~1.0 Mt               TOTAL COPPER

                                                                                      982                                           100% Quellaveco
                       Mitsubishi          Codelco                  Mitsui                                                          (from 2022)

   50.10%            20.40%             20.00%                  9.50%                                           668
                                                                                                                                    100% AA Sur
                                                                                                                                    44% Collahuasi
                          Collahuasi
                                                                                          100%                Reporting
            1 non-managed asset:           Collahuasi                                     Basis                 Basis

                                              Consortium 12.00%
                                                                             Underlying   EBITDA   (in $bn)
                                                                Others
                                            Mitsui

   44.00%            44.00%             7.43%                   4.57%

                                                                                           1.9
                                                                                                                         $ 1.9  bn     44%
                        Quellaveco                                                                             52%      Accounting
                                                                                                                           Basis

       1 managed asset:         Quellaveco (in project execution)
                                                                                                                               4%

                                                                                                                 Los Bronces @100%
                                           Mitsubishi                                Accounting
                                                                                                                 El Soldado and Chagres @100%
                                                                                          Basis
                     60.00%             40.00%                                                                   Collahuasi @44%

                                                                                                                                                      5
BASE METALS World class assets, leading capabilities and attractive growth options - Anglo American
COPPER INDUSTRY FUNDAMENTALS

Copper grades continue to decline …                                                                           with some offset from ‘possible’ projects …
Average mine grade and size                                                                                   Number of greenfield project approvals
Avg. mine size (ktpd ore) and avg. head grade (% Cu)                                                          SNL: Greenfield project approvals > 50ktpa from 2000

  50                                                                                               1.4             7

                                                                                                                   6
  40
                                                                                                   1.0             5
  30
                                                                                                                   4
                                                                                                   0.6
  20                                                                                                               3

                                                                                                   0.2             2
  10
                                                                                                                   1
                                                                                                    0
    0                                                                                                              0
                                                                                                                       2005-          2007-              2009-             2011-           2013-              2015-             2017-
          1980                                                                2016          2025
                                                                                                                       2006           2008               2010              2012            2014               2016              2018

… coupled with longer term potential from                                                                        … resulting in a tightly balanced market
the low carbon economy …                                                                                       and a supply gap in medium and long term
 Global copper demand in vehicles                                                                              Primary demand, base and project supply (Mt Cu)
 LDV, HDV & buses ‐ (Mt)                                                                                       AA Commodity Research Analysis, May 2019

   7                                                                                    +4,285kt                  35
                                                                             +3,590kt
   6
                                                                                                                  30                                                                                           Demand
                                                                  +2,630kt
   5

   4                                                   +1,400kt                                                   25

                                        +670kt
   3
                                                                                                                  20
   2

                                                                                                                  15
   1
                                                                                                                               Firm Supply
   0
                                                                                                                  10
                 2015       2020          2025           2030       2035       2040       2045                          2007    09   11   12   13   15    17     19   21   22   23   24   25   27   29   31    33     35   37   2039
                                                                                                                                                                                                                                        6
                                    Source: AA Commodity Research team analysis – May 2019, Wood Mackenzie: Global Copper long-term outlook, SNL Dec 2018
BASE METALS World class assets, leading capabilities and attractive growth options - Anglo American
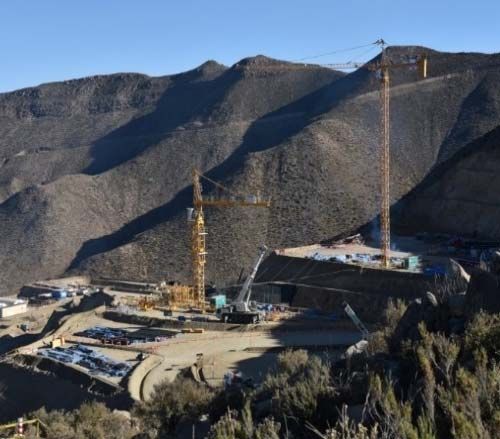
BASE METALS STRATEGY
                To double the value of our business by 2023, by increasing attributable copper
                      production at an improved cost curve position with zero harm

  Focusing the portfolio on high                                                  Pursuit of value enhancing
                 quality assets                                                   organic growth

Extracting full potential from our                                                Seeking superior value
                  existing assets                                                 opportunities through mineral
                                                 PORTFOLIO                        discoveries
       Continuous improvement
   through our operating model                                                    Quality growth through
                                                                                  opportunistic acquisitions /
                     and P101
                                                                                  partnerships

                                                     OUR
                                                  STRATEGY
                                                 FOUNDATION
     Thriving work environment,                                                   Key technologies
     challenging and purposeful                                                   implementation
    Anticipating future trends of                                                 Digital transforming business
                   the workforce                                                  environment
    Compelling employee value        PEOPLE                    INNOVATION         Breakthrough initiatives
                   proposition
                                                                                  challenging the status quo
  Encouraging experimentation
   through continuous learning                                                    Excellence in project
                                                                                  generation and execution

                                                                                                                  7
BASE METALS World class assets, leading capabilities and attractive growth options - Anglo American
OUR PORTFOLIO

     Collahuasi                                             Los Bronces                                                          Quellaveco                                                               Sakatti

3rd                                                  ~55 Mt                                                            Q1                                                                Poly-metal
                                                                                                                                                                                         unique deposit, 100%
Largest endowment in                                 Contained Cu in Mineral                                           Cost curve position                                               Anglo American
the world                                            Resources4*

105 c/lb                                             370 kt                                                            30 year                                                           Negative Cash
                                                                                                                                                                                         Cost from seven payable
C1 unit cost                                         2018 production                                                   Reserve Life5                                                     metals1

               *Due to the uncertainty that may be attached to some Inferred Mineral Resources, it cannot be assumed that all or part of an Inferred Mineral Resource will necessarily be upgraded to an Indicated or Measured Resource after
               continued exploration.                                                                                                                                                                                                           8
               1) copper, nickel, cobalt, platinum, palladium, gold, and silver
BASE METALS World class assets, leading capabilities and attractive growth options - Anglo American
A UNIQUELY POSITIONED COPPER BUSINESS

A transformed business                                                                Portfolio strength                                                                  Disciplined growth

~630-660 kt                                                                   ~1 Mtpa                                                                                        Organic growth
2019 production guidance                                                      Production (post Quellaveco)                                                                       delivered from
                                                                                                                                                                                 Quellaveco &

Q2                                                                            120 c/lb                                                                                           optionality at
                                                                                                                                                                                 Los Bronces &
C1 unit cost: Lowest since 2010                                               Future
with more to come…                                                            C1 unit cost                                                                                         Collahuasi

                                                                   2019 Copper Mine C1, Cash Cost ($/lb)
                                                                                                                                                                                                                         $/lb

                     Q1                                                       Q2                                                         Q3                                                      Q4                      400

                                                                                                                                                                                              El Soldado                 300
                                                                                                                               Los Bronces

                    Collahuasi                                                                                                                                                                                           200
                                                                                                                  (2)
    Quellaveco                                                                             (2)              AA
                                                            AA                      AA
                                                                                                            2019                                                                                                         100
                                                                                    2023
                                                           Future

                                                                                                                                                                                                                         0

0                5,000                        10,000                       15,000                       20,000                      25,000                       30,000                     35,000         40,000 Mlbs

                  Source: WoodMac Report - Global Copper Production Ranking by Company - 2019 (estimate).   (1) Ore Reserves and Mineral Resources Report 2017   (2) Including Quellaveco                                       9
BASE METALS World class assets, leading capabilities and attractive growth options - Anglo American
A TRANSFORMED BUSINESS OFFERING ORGANIC GROWTH

       High quality, long life assets                                                                                                    Growth in quality volumes
Estimated Contained Copper (Mt)                                                                                        Copper production (kt)6
    Ore Reserves                                                                                                                 Other

        29
                                                                                                                                 Quellaveco
                                                                                                                                 Collahuasi
                                                                                                                                 Los Bronces
                                                                                                                                                                             +50%
                                         9                                    8                                          1,400

                                                                                                                         1,200
  Collahuasi                Los Bronces                           Quellaveco
                                                                                                                         1,000

        52                                                                                                                  800

                                                                   At the very start
                                                                                                                            600
                                                                    of its resource
                                                                        journey
                                        16                                                                                  400
                                                                              6
                                                                                                                            200

    Mineral Resources (excluding Reserves)
                                                                                                                                        2020                        2025   2030   2035

               Please refer to the AA plc Ore Reserves and Mineral Resources Report 2018 for the tonnes, grades and a breakdown of the classification categories.                        10
QUELLAVECO: A WORLD CLASS COPPER PROJECT

 Meaningfully de-risked       Focus on execution                    Attractive returns

$ 2.7 bn                    4 years                             >50 %
Implied NAV                 Payback …from 1st production 2022   EBITDA margin…average over first 10y

~0.84% TCu 4*               26                                  >20 %
Grade … in first 5 years    Dialogue table commitments          ROCE …average over first 10y

  SUCCESSFULLY SYNDICATED    ALL KEY PERMITS IN PLACE &          LOW COST WITH SIGNIFICANT
 WELL UNDERSTOOD ORE BODY    SIGNIFICANT EARLY WORKS                FURTHER POTENTIAL
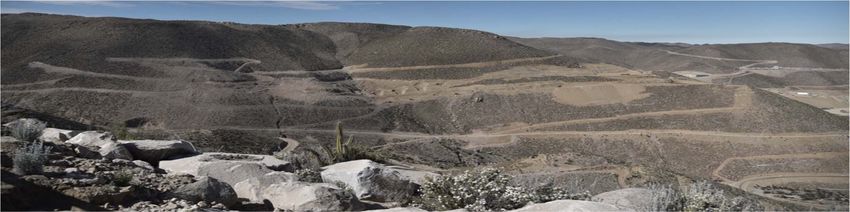
                                                                                                       11
COLLAHUASI: SIGNIFICANT EXPANSION POTENTIAL

                                 A high quality, long-life asset

Our 44% share …
                  + 80 ktpa                    $ 0.9 ~ 1.1 bn              >50 %
                  Production … incremental     Capex … for the base case   EBITDA … end-state
                  from 2024                    expansion                   margin

                                WITH FURTHER EXPANSION OPTIONALITY

                                                                                                12
LOS BRONCES UNDERGROUND: SUSTAINABLE GROWTH

    Unique design credentials …                                                                                        unlocking a significant endowment

  ~ 3 bt                                ~ 1.16%                                TCu                                    ~ 150 ktpa                                                      ~ 125 c/lb
  Inferred Mineral                      Grade of Inferred Mineral                                                     Incremental Production                                          C1 unit cost
  Resource                              Resources4                                                                    first 10 years post full ramp up                                first 10 years post full ramp up

                COMPETITIVE RETURNS                                                                                                                    SUSTAINABLE DESIGN

                                                                                                                                          NO impact on glaciers

                                                                                                                                          NO impact on nature reserve

                                                                                                                                          NO increase in water consumption

                                                                                                                                          NO increase in tailings dam capacity

                                                                                                                                          NO additional traffic on the G-21 road

                                                                                                                                          NO additional processing plants

           Due to the uncertainty that may be attached to some Inferred Mineral Resources, it cannot be assumed that all or part of an Inferred Mineral Resource will necessarily be upgraded to an Indicated or Measured Resource   13
           after continued exploration.
WATER IS A STRATEGIC IMPERATIVE

   Recent, intense Chilean droughts ... coupled with water licensing constraints
                                                Annual series of Central Chile regional precipitation index
 RPI (%)                                                                       Droughts, defined as years with RPI < 80%                                DROUGHT
           220
           200
           180
           160
           140
           120
           110

            80
            60
            40
            20
             0

             1910       1920             1930             1940              1950             1960           1970           1980   1990       2000     2010    2020

being addressed through innovative, sustainable and integrated water solutions

           Water efficiencies &                                                                                                          Tailings water efficiency &
                                                                                    Water-less Mining
               recycling                                                                                                                    storage optimisation

                 Desalination                                             Alternative water sources,                                        Pipeline upgrade &
                 as an option                                                 including reservoirs                                          contingency plans

                    Source: wileyonlinelibrary.com/journal/joc © 2019 Royal Meteorological Society                                                                     14
WE ARE RE-IMAGINING MINING…

                       P101 Performance Journey

        Provide CLARITY, produce STABILITY and reduce VARIABILITY

                                                          • We have safety as
                                                           our number one
                                                           priority and
                                                           operational
                                                           excellence as
                                                           standard

                                                          • P101 PERFORMANCE:
                                                           establishing new
                                                           benchmarks,
                                                           pushing towards the
                                                           absolute limit and
                                                           setting the stable
                                                           platform for new
                                                           technologies

                                                                                 15
STEP-CHANGING THE INTENSITY EQUATION

                               Bulk Sorting

     5% grade improvement, 25% more throughput – LOWER COSTS & ENERGY

                                                                        16
CREATING PATHWAYS TO THE WATER-LESS MINE

                      Coarse Particle Flotation - CPF

      85% water recovery, 20% more throughput – LOWER COSTS & ENERGY

                                                                       17
A COPPER BUSINESS SET FOR THE FUTURE

                             FutureSmart MiningTM

        ENERGY                      WATER                     COSTS

  Contributing to Group       One step closer to a         Lower operating
     energy targets             water-less mine                 costs

     Electricity 100%            Bulk ore sorting
 renewables certified from      implementation            Reduction in mine
      2021 in Chile              at Los Bronces          equipment SIB capex

          >15%                       >20%                      >20%
          Energy                     Water consumption         C1 unit cost

                                                                               18
IMPROVING LIVES OF THOSE IN OUR LOCAL COMMUNITIES

                                      Base Metals Sustainable Mining Plan

  TRUSTED CORPORATE                                  THRIVING                                 HEALTHY
       LEADER                                      COMMUNITIES                              ENVIRONMENT

COLLABORATION                             EDUCATION & LIVELIHOODS                   PERMITTING & EFFICIENCIES
Flagship community economic and           Top 20% school performance by             Integrated EIA process, energy
social programme in Chile and Peru        2030 and full employment                  and water targets

 Over 950 employees and 330                19 schools in 13 districts, with 1,500   Solar panel plant installed at Los
 different projects through                students ‘Soy Técnico’ and 75,000+       Bronces tailings dam (150,000
 Ambassadors for Good in Chile             entrepreneurs supported in Chile         kWh/year of renewable energy)
                                                                                    First mining trucks in the world with tier
 Improve agricultural production in        9 projects in Peru with early            4 and stop-start engines
 Peru - Alpaca fibre marketing             childhood education centres,
 (£84,000) with increased income of        education programme for adults           Specialised module in Peru for the
 high-altitude alpaca breeders by          and training / scholarship               development of algae, repopulation
 43% and olive producers by 65%            programmes                               of sea urchins, vicuñas, others

SDGs                                      SDGs                                      SDGs

                                                                                                                                 19
WORLD CLASS ASSETS, LEADING CAPABILITIES AND
ATTRACTIVE GROWTH OPTIONS
                               Supreme mineral endowment, combining long life,
                                  Q1/Q2 assets in a compelling environment
Set of Strategic Optionality   LB Underground            Quellaveco upsides   Collahuasi expansion          Sakatti / Mineral Discoveries

                  Three world class assets,                                               … underpinned by a strong
                  each with significant                                                     safety culture and social
                  endowment optionality …                                                       licence to operate …

 …leveraging on a robust and                                                                            … focused on ‘Green World’
   accelerated ‘Future Smart’                                                                               and energy market, well
  technology and innovation                                                                                positioned to respond to
                 programmes                                                                            climate change trends and …

   … fostering significant uplift                                                                       … pursuing more than 2/3
    in marketing with potential                                                                        of its capacity operating at
    to expand capacity to meet                                                                               the lowest cost curve
      future Copper demand …                                                                                           percentile…

                                     Production                                          Cash Cost
                                Mt                                               c/lb
                                          >1.0     ~2x                                                 Low Q2
                                                                                        140
                                 0.6                                                           >120

                                 Base      End                                          Base   End                                      20
                                 Case      State                                        Case   State
FOOTNOTES
1. Source: Wood Mackenzie; AAP; De Beers; CRU. Includes non-AA mined commodities (e.g. zinc, bauxite). Excludes non-mining activities (e.g. petroleum,
   alumina/aluminium processing, marketing).
2. Peer range: leverage based on 2018. Growth based on data from external advisors.
3. Copper equivalent production is calculated using long-term consensus parameters. Excludes domestic / cost-plus production. Production shown on a
   reported basis. Includes assets sold, closed or placed on care and maintenance.
4. Estimates as at 31 December 2018. Please refer to the AA plc Ore Reserves and Mineral Resources Report 2018 for the tonnes, grades and a breakdown
   of the classification categories. The ~55Mt Contained Copper quoted as Los Bronces Mineral Resources includes Los Bronces Underground Project.
5. Reserve life from AA plc Ore Reserves and Mineral Resources Report 2018.
6. All figures stated on 100% basis except Collahuasi which is on a 44% basis.
7. First 10 years post full ramp up. Pre-feasibility study 2018.

                                                                                                                                                         21
You can also read