Superior Strategic Positioning - ASX: PLL NASDAQ: PLL - cloudfront.net
←
→
Page content transcription
If your browser does not render page correctly, please read the page content below
Superior Strategic Positioning
   Corporate Presentation – December 2018

ASX: PLL    NASDAQ: PLL

  ABN 50 002 664 495
Lithium Market Update
Demand Growth Accelerating and Supply Delays Persist
Lithium Market Commentary

                                    ▪ Tesla Model 3 the #1 selling car in USA
    EV Demand Accelerating          ▪ Wave of new models coming to market
                                    ▪ Cost parity has arrived

                                    ▪ Producers all under-performing expectations
   Supply Below Expectations        ▪ Big 4 producing nations face challenges

                                    ▪ China spot down from 2018 but contract prices high
  Lithium Prices Remain Strong
                                    ▪ Albemarle and Livent contracting at record levels

                                    ▪ Required in high-nickel chemistry batteries
 EV Market Shifting to Hydroxide    ▪ Spodumene the low-cost source

                                    ▪ Albermarle’s $1.15bb investment in Wodgina
  Positive Strategic Transactions   ▪ Tianqi’s $4.1bb purchase of a 24% stake in SQM
                                    ▪ Posco’s $280mm purchase of lithium rights from Galaxy

                                                                                              3
Outstanding Lithium Demand Fundamentals

~10%                                                                                    5x                                                                                                                1,047
Electric Vehicle                                                                        Estimated Increase in demand
Penetration Rate by 2025                                                                of Lithium by 2025                                                                                      845
                                                               10%

                                                                                                                                                                                       633
                                                                                         Lithium-ion Batteries   Other Industrial Applications   Glass & Ceramics Industries
                                                                                                                                                                               489
                                                                                                                                                                 387
                                                                                                                                                   317
                                                                                                                       240           270
                                                                                           189           218
                  1%

                 2017                                          2025                       2016          2017         2018           2019          2020          2021           2022   2023      2024      2025

                                                 Electric Vehicles in Market by 20251                                                      Lithium Demand Forecast to 2025 (000’s tonnes)2

~53%                                                                                    30x
Demand of Lithium by                                                      Batteries     Increase in Lithium Supply
Li-ion Batteries in 2017                                                     53%        Required in 100% EV World
                                         Other

                                                                                         Lithium                                                                                                       2,900%

                                                                                         Cobalt                                                                                              1,900%

                                                                                         Nickel                                            105%

                                                                                        Copper                                          22%

                                         Glass &                                           Steel                             -1%
                                        Ceramics
                                                                                           PGM                           -53%
                                                    Lithium Demand by Market 20172
                  1    Wall Street Consensus

                  2    UBS Securities 2018 Research Report
                                                                                                                                                                                                                  4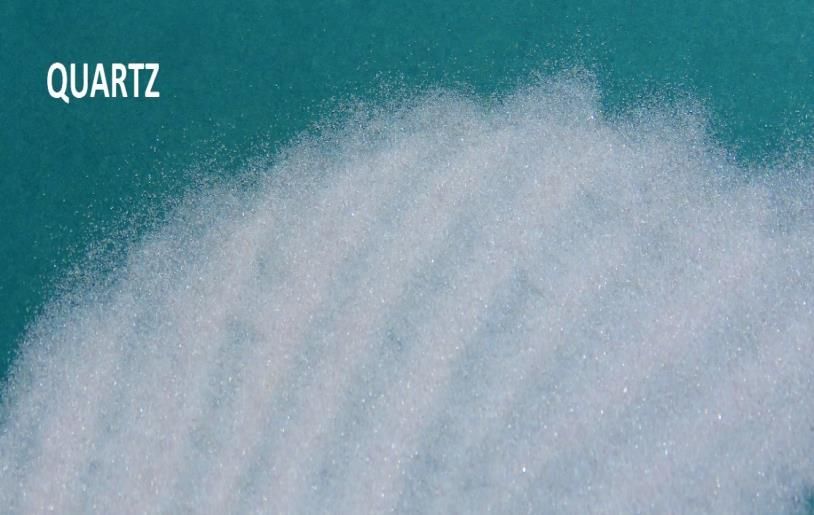
Wave of New EVs Driving Lithium Demand

                                          Tesla Outselling Audi, BMW and Mercedes Combined

                                        25,000
                 Tesla Model 3 (2018)

                                        20,000

                                                                               Tesla Model 3
                                                                                  Tesla Model 3
                                        15,000
  Jaguar I-Pace(2018)
                                                                                               Tesla Model 3
                                                                                               Mercedes C + E + CLS
                                                                                               BMW 3 + 4 + 5
                                        10,000
                                                                                               Audi 4 + 5
                                                                                               Lexus ES

                                         5,000
                  Audi e-tron (2019)

                                            0

            Porsche Taycan (2019)

                                         Source: CleanTechnica

                                                                                                                      5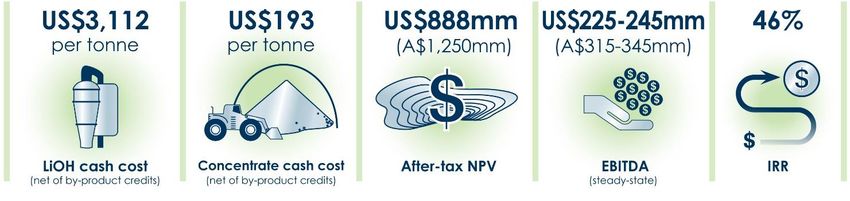
Lithium Prices Remain Very Strong

                                           Reported Lithium Carbonate Prices
                                 $18,000
 “…contract prices in 2021
 and 2025 are equal to or
 greater than the 2018           $16,000

 sales price with
 opportunities for price         $14,000

 increases” – Luke Kissam,
 Albemarle CEO                   $12,000

 “It’s almost impossible for
 me to see a meaningful          $10,000

 decrease in lithium
 prices” – Paul Graves, Livent    $8,000

 CEO
                                  $6,000

                                  $4,000
                                           Q1   Q2   Q3   Q4   Q1     Q2     Q3   Q4   Q1   Q2     Q3
                                                 2016                  2017                 2018

                                                           Orocobre    SQM

                                                                                                        6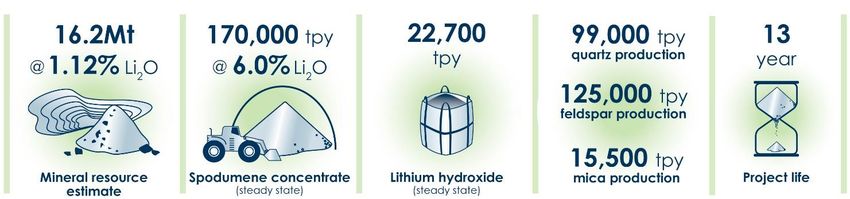
Cost Parity Has Arrived
                                                                       TESLA MODEL 3                  AUDI S4 / BMX 340ix

                                   CATEGORY                           Luxury sport sedan                  Luxury sport sedan
 “In the entry-level
 luxury market, (the                0-60 MPH                               4.6 seconds                           4.6 seconds
 Model 3) offers a
 better product at a
                                      RANGE                                  310 miles                           ~400 miles
 lower cost of                                                                                      Tesla Model 3
 ownership…”                                                                                           Tesla Model 3
                                       PRICE                                  $55,000                         $55,000

 “…In the mainstream
 sedan market, it                 5-YEAR FUEL1                                 $2,549                              $10,194
 offers a dramatically
 superior product at a    5-YEAR MAINTENANCE1                                  $3,018                               $9,551
 similar cost of
 ownership.” -                5-YEAR INSURANCE1                                $4,430                               $4,513
 CleanTechnica

                                TAX INCENTIVE2                               ~$11,000                                $0

                                  5-YEAR TCO3                          $65,497 / $54,497                           $82,696
                                                                         (pre- / post- incentive)

                         1.   Source: Clean Technica and OEM websites
                         2.   Reflects New Jersey – $7,500 US tax credit plus waiver of 6.625% state sales tax
                         3.   Includes insurance, Tesla shown pre-/post-tax benefits                                           7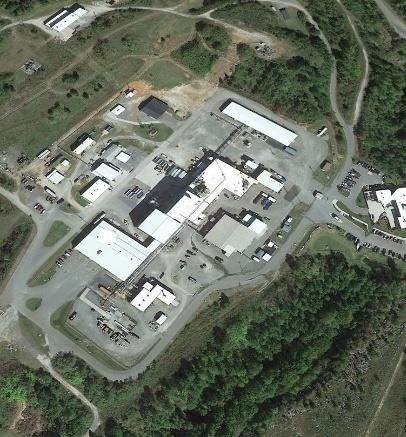
Lithium Supply Disappointments Continue in Q3 2018

                3 unplanned shutdowns; volume down 5%

                Carbonate expansion delay; volume down 15%

                6-month stage 2 expansion delay; volume down 36% vs. Q2

                Yield Optimization Project project delay; volume down 35%

                8-week delay due to late deliveries from OEM suppliers

                Flotation plant delays

                H2 production guidance cut 15%

                                                                            8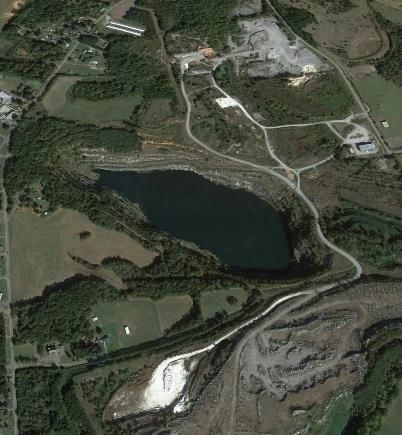
Big 4 Producing Nations Face Challenges

                40% royalties / ‘war for water’ / active government

                Hyperinflation / ‘temporary’ 8% export tax

                High cost power and transport / labor shortages

                Imported raw materials / 16% VAT on re-exports

                Low costs and taxes / large market / critical material

                                                                         9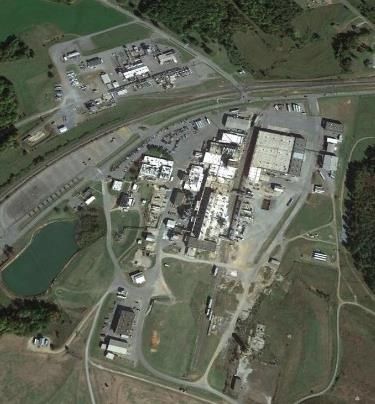
EV Market Shifting to Hydroxide
                                                                       Hydroxide Demand                     Carbonate Demand
Fast Growth…                                               400,000

 Hydroxide preferred for high-nickel                       300,000

                                                  tonnes
 chemistry batteries
                                                           200,000

 Battery-grade hydroxide to grow from
 20,000tpy to 400,000tpy by 2027                           100,000

                                                                -
                                                                     2017 2018 2019 2020 2021 2022 2023 2024 2025 2026 2027

                                                                                                     Hydroxide Price                      Carbonate Price
                                                                                    18,000

               …Premium Prices…
                                                                                    16,000

                                                                        US$/tonne
               “We assume the current ~$2,000                                       14,000
               premium for hydroxide remains
               constant” – Goldman Sachs & Co.                                      12,000

                                                                                    10,000
                                                                                             2017   2018   2019    2020     2021   2022    2023    2024      2025

                                                                                                                          6,165
                                                                                                                                                    5,300
                               …and Low Production Costs                                                                  2,000

                                                                                                                                                     2,100                      3,111

                                 “Spodumene is 15% more cost-effective                                                    3,500
                                                                                                                                                                                 1,975
                                 to produce lithium hydroxide than salt                                                                              3,000

                                 brine” – McKinsey & Co.                                                                   665                                                   1,136

                                                                                                                          Brine                   Spodumene                  Piedmont
                                                                                                                                                   Processing to Lithium Hydroxide (Upper Range)
                                                                                                                  US$/tonne Costs                  Processing to Lithium Hydroxide
                                                                                                                                                   Processing to Lithium Carbonate
                                                                                                                                                   Concentrate Mining / Brine Harvesting

                                                                                                                                                                                                   10
Piedmont Lithium Superior Strategic Position
Superior Strategic Position
▪ Conventional quarrying and processing
Hard-Rock Base ▪ Lower risk and faster ramp vs brine or soft-rock
▪ Integrated spodumene projects at low end of cost curve
+
▪ Nickel-intensive cathodes require hydroxide
Hydroxide Integration ▪ Hydroxide demand growing 35% per annum
▪ Premium pricing vs. carbonate
+
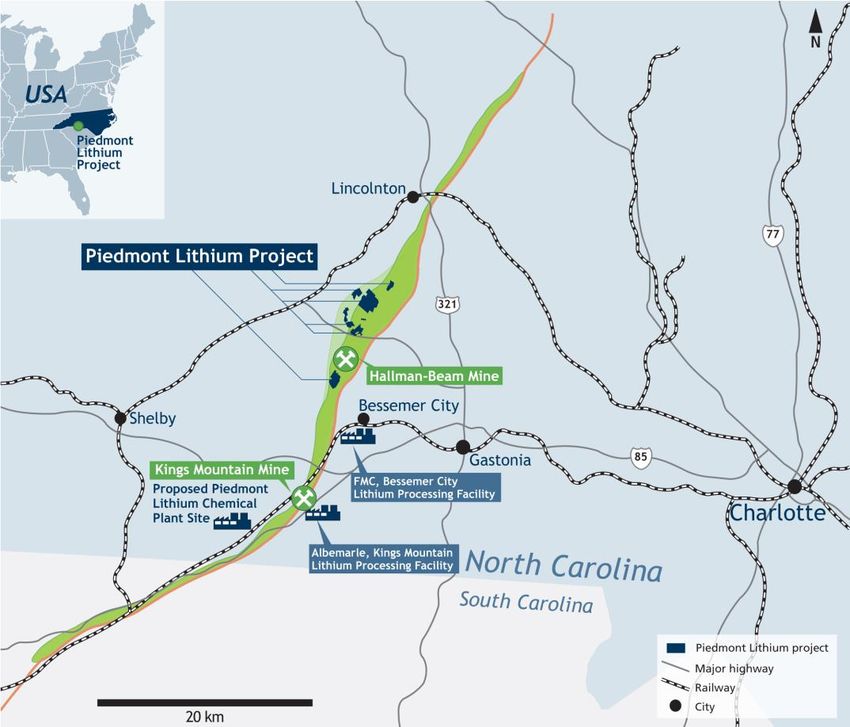
▪ 50+ years of lithium processing in North Carolina
North Carolina, USA Location ▪ Abundant infrastructure and deep local talent pool
▪ Low operating costs, royalties and taxes
=
▪ Strategic US source of lithium hydroxide
▪ Low-risk and low-cost
Superior Strategic Position
▪ First-mover position as only US spodumene project
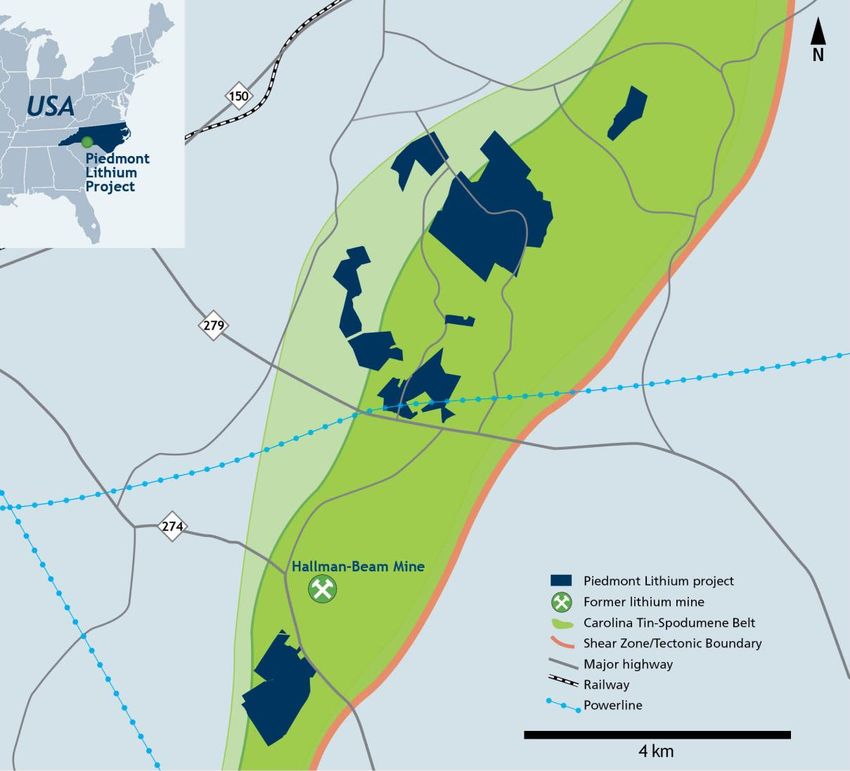
12Piedmont Ideally Located in North Carolina
#1 0% 23% ~100%
State for Business State Mining Royalties Corporate Tax Rate Historic Lithium Production
Forbes 2017
13North Carolina Cost Advantage
Location drives 1st
quartile cost position
NORTH CAROLINA WESTERN AUSTRALIA CANADA
LABOR $42 / Hr $63 / Hr $65 / Hr
ELECTRICITY 6c / kWh 17c / kWh 4c / kWh
DIESEL $0.65 / L $1.02 / L $0.91 / L
NATURAL GAS $4.00 / Gj $6.57 / Gj $12.54 / Gj
TRANSPORTATION $6 / T $46 / T $50 / T
GOVERNMENT ROYALTIES 0% 5% 0%
EFFECTIVE TAX RATE 23% 30% 33%
Source: Public filings, Primero and Company estimates
14World-Class Spodumene Business
+ Low unit operating costs
+ RoyaltiesPositive Impact of By-Products
By-products were a large business for
past lithium producers in NC
Strong local markets for quartz, feldspar
and mica
Imports represent large market share
due to US mine depletions
Initial offtake conversations underway
with leading market participants
Annual Volume Assumed Average Sales
By-product Markets
(tpy) Price (US$/t)
Quartz 99,000 $100 Low-iron glass including solar panel cover glass, industrial ceramics
Feldspar 125,000 $75 Glass, frit, and industrial ceramics
Mica 15,500 $50 Specialty paints including automotive, filler uses, joint-compound
16Ultra-Low-Cost Hydroxide Producer
+ Low-cost spodumene supply
+ Low input costs
- Labor
- Electricity
- Natural Gas
Source: Roskill, Refined production cost includes all direct and indirect operating costs related directly to the physical activity of producing a
refined lithium compounds, including feedstock costs (either from internal sources measured using the all-in sustaining cost of production (site
operating plus other costs, as defined above), refining, on-site general and administrative costs and selling expenses. It does not include 17
costs associated with corporate-level administrative expenses.Vast Potential For Project Life Extension
Drilling the Exploration Target Consolidating Land on the TSB
Follow-up at Central & Sunnyside
182019 Catalysts Should Drive Re-Rating
2,690
• Mine Life Extension
• Land Acquisition
2018E LCE
• Exploration Drilling Production of
20,000t
• Resource Upgrade
• Strategic Arrangements Lithium Hydroxide Valuations (US$mm)
• Concentrate Offtake
• By-Product Monetization
• Chemical Plant Partnering
• Permitting 1,150
• PFS / DFS Engineering
Resource of
• Project Financing 16.6Mt @ 1.16%
in March 2015
• Final Investment Decision
511
391
52
PLL KDR NMX ALB / MIN LTHM
19Indicative Development Timeline
2018 2019 2020
Q1 Q2 Q3 Q4 Q1 Q2 Q3 Q4 Q1 Q2 Q3 Q4
Resource
Technical Consultants
Scoping Study
Pilot Plant Met Testwork
Phase 4 Drilling –
Resource Upgrade
PFS
Chemical Plant Partner
Discussions
DFS
Permit Submissions
Construction
Decision
Mine / Concentrator
Construction & Commissioning
Chemical Plant Engineering
20Benchmarking Shows Deep Undervaluation
Annual Hydroxide Production Steady-State EBITDA (US$) Net Present Value (8% real) (US$)
50,000 $500 $1,750
$1,500
40,000 $400
$1,250
30,000 $300 $1,000
$750
20,000 $200
$500
10,000 $100
$250
0 $0 $0
PLL ALB / MIN KDR NMX PLL ALB / MIN KDR NMX PLL ALB / MIN KDR NMX
EV / Annual Production Tonnage EV / EBITDA EV / NPV
$25,000 2.50 0.50
$20,000 2.00 0.40
$15,000 1.50 0.30
$10,000 1.00 0.20
$5,000 0.50 0.10
$0 0.00 0.00
PLL ALB / MIN KDR NMX PLL ALB / MIN KDR NMX PLL ALB / MIN KDR NMX
Annual LiOH Steady-State
Production Enterprise Production EBITDA Net Present
Region (Mtpy) Mine Life Value (US$mm) Cost per Tonne (US$mm) Value (US$mm)
Piedmont Lithium (PLL) USA 22,700 13 $50 $3,112 $235 $888
Albemarle / MinRes JV (ALB / MIN) WA 50,000 30 $1,150 $4,952 $452 NA
Kidman Resources (KDR) WA 22,627 47 $383 $5,406 $208 $993
Nemaska Lithium (NMX) CAN 32,000 33 $569 $2,811 $358 $1,800
21Corporate Snapshot
Piedmont Lithium Limited 0.25
Senior Management
Appointments
Nasdaq
Updated
Scoping Study
Listing
Name
Shares outstanding 669.0 mm Change to
Piedmont
A$12 million
0.20 CEO Placement
Appointed
ADRs effective 6.69 mm
0.15
Share price2 (ASX:PLL) A$0.125
0.10 Maiden Resource
ADR price1,2 (Nasdaq:PLLL) US$9.23 A$16 million
Placement
ASX Share Price (A$)
0.05
Market capitalization2 A$83.6 mm
-
Cash (@ September 30, 2018)3 A$16.6 mm
10 Daily Volume (million)
5
Key Shareholders 3 -
Jul 17 Sep 17 Nov 17 Jan 18 Mar 18 May 18 Jul 18 Sep 18 Nov 18
AustralianSuper Pty Ltd 13.2%
Directors 11.6%
Board of Directors
Ian Middlemas Australia Chairman
Research Coverage Keith D. Phillips USA CEO
Anastasios Arima USA Executive Director
Jeff Armstrong USA Director
Jorge Beristain USA Director
Levi Mochkin Australia Director
1 100 Ordinary Shares per ADR
2 As at November 30, 2018
3 Pro forma for 110mm share placement 22Background Materials
Outstanding Scoping Study Results
Note: Mineral Resources of 16.2Mt @ 1.12% Li2O comprises Indicated Mineral Resources of 8.5Mt @ 1.15% Li 2O and Inferred Mineral Resources
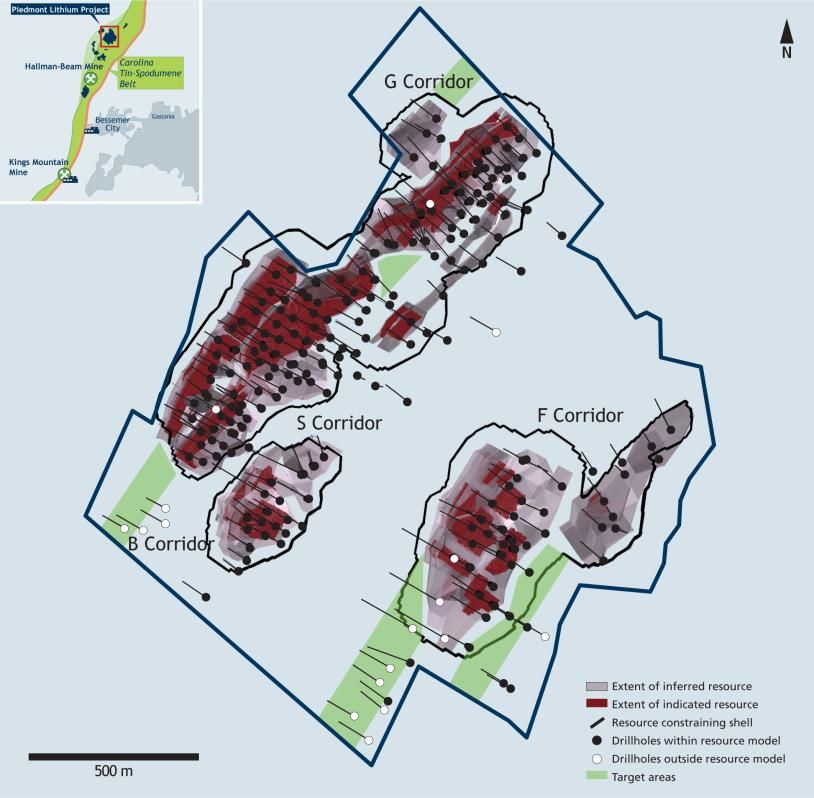
of 7.7Mt @ 1.09% Li2O. 24Maiden Resource on Core Property
16.2 Mt @ 1.12% Li2O
✓ 450,000 tonnes of contained LCE
✓ Shallow open pit mine design
✓ 231 core holes in 35,300 meters of drilling
✓ Open along strike and at depth
Mineral Resource Estimate – Piedmont Lithium Project
Li2O Quartz Feldspar Mica
Category Tonnes (Mt) Grade Tonnes Grade Grade Grade
Tonnes (Mt) Tonnes (Mt) Tonnes (Mt)
(%) (t) (%) (%) (%)
Indicated 8.50 1.15 98,000 30.3 2.57 43.5 3.69 4.4 0.38
Inferred 7.69 1.09 84,000 30.0 2.31 44.4 3.41 4.5 0.34
Total 16.19 1.12 182,000 30.1 4.88 43.9 7.11 4.5 0.72
25Strong Recovered Grade
1.60%
Resource Grade
1.40%
Competitive Resource Grade…
1.20%
1.12% Resource Grade
1.00%
0.80%
…and Positive Met Recoveries…
0.60%
85% recoveries…based on bench KDR NMX PLS TAW MIN PLL GXY SAV EUR SYA AJM CRE
scale tests and in line with historical 1.20%
precedent in North Carolina Recovered Grade
1.00%
…Lead to Strong Recovered Grade 0.80%
Driving strong project economics
0.60%
NMX KDR PLS PLL SAV SYA TAW AJM GXY EUR MIN CRE
26Benchmarking Shows Deep Undervaluation
Piedmont Albemarle / Kidman Nemaska
Unit Lithium MinRes JV Resources Lithium Net Present Value (8% real) EV / NPV
(US$)
0.50
Project Piedmont Wodgina Mt. Holland Whabouchi
$1,750
0.40
Ownership % 100% 50% 50% 100% $1,500
$1,250 0.30
Project Location USA Australia Australia Quebec $1,000
$750 0.20
Resource / Reserve Mt 16.2 76.0 94.5 37.0
$500
0.10
Resource Grade % Li20 1.12% 1.17% 1.53% 1.40% $250
$0 0.00
Recoveries % 85% 65% 75% 85% PLL ALB / KDR NMX PLL ALB / KDR NMX
MIN MIN
Recovered Grade % Li20 0.95% 0.76% 1.15% 1.19%
Spod Con Grade Modeled % 6.00% 6.00% 6.20% 6.25% Annual Hydroxide EV / Annual Production
Production Tonnage
Annual Spod Con Production tpy 170,000 416,500 182,402 213,000
50,000 $25,000
Spod Con Production Cost US$/t $193 $296 $293 $257
40,000 $20,000
Annual LiOH Production tpy 22,700 50,000 22,627 32,000
30,000 $15,000
LIOH production Cost US$/t $3,112 $4,952 $5,406 $2,811 20,000 $10,000
Effective Royalties %Disclaimers
Cautionary Statements and Important Information
This presentation does not constitute or form part of any offer to sell, or solicitation of any offer to buy, any securities in the United States or any other country. This presentation may not form the basis of any
contract or commitment whatsoever with any person. Distribution of this presentation may be restricted by applicable law. This presentation has been prepared by Piedmont Lithium Limited (“Piedmont”) as
a summary only, and does not contain all information about Piedmont’s assets and liabilities, financial position and performance, profits and losses, prospects, and the rights and liabilities attaching to
Piedmont’s securities. Any investment in Piedmont should be considered speculative and there is no guarantee that they will make a return on capital invested, that dividends would be paid, or that there will
be an increase in the value of the investment in the future. Piedmont does not purport to give financial or investment advice. No account has been taken of the objectives, financial situation or needs of any
recipient of this presentation. Recipients of this presentation should carefully consider whether the securities issued by Piedmont are an appropriate investment for them in light of their personal
circumstances, including their financial and taxation position.
Forward Looking Statements
This presentation contains forward-looking statements within the meaning of securities legislation in Australia and the United States, including statements regarding exploration and development activities;
plans for Piedmont’s mineral projects; projections of market demand and lithium prices; statements about the timing and amount of resource declarations; and statements about the timing and ability to
complete scoping studies and feasibility studies.
Such forward-looking statements involve known and unknown risks, uncertainties and other factors which may cause actual events, results, performance or achievements to be materially different from
events, results, performance or achievements expressed or implied by the forward-looking statements. Such factors include, among others, the risk that we will be unable to commercially extract mineral
deposits, that our properties may not contain expected reserves, risks and hazards inherent in the mining business (including risks inherent in developing mining projects, environmental hazards, industrial
accidents, weather or geologically related conditions), uncertainty about our ability to obtain required capital to execute our business plan, our ability to hire and retain required personnel, changes in the
market prices of lithium, changes in technology or the development of substitute products, the uncertainties inherent in exploratory, developmental and production activities, including risks relating to
permitting and regulatory delays, uncertainties inherent in the estimation of lithium resources, risks related to competition, as well as other uncertainties and risk factors set out in filings made from time to time
with the Australian Stock Exchange and the U.S. Securities and Exchange Commission, including our most recent Form 20-F. Actual events, results, performance and achievements could vary significantly
from the estimates presented in this presentation. Readers are cautioned not to put undue reliance on forward-looking statements. We disclaim any intent or obligation to update publicly such forward-
looking statements, whether as a result of new information, future events or otherwise. Additionally, we undertake no obligation to comment on analyses, expectations or statements made by third parties in
respect of Piedmont, its financial or operating results or its securities.
Cautionary Note to United States Investors Concerning Estimates of Measured, Indicated and Inferred Resources
The information contained in this presentation has been prepared in accordance with the requirements of the securities laws in effect in Australia, which differ from the requirements of U.S. securities laws. The
terms "mineral resource", "measured mineral resource", "indicated mineral resource" and "inferred mineral resource" are Australian terms defined in accordance with the 2012 Edition of the Australasian Code
for Reporting of Exploration Results, Mineral Resources and Ore Reserves (the “JORC Code”). However, these terms are not defined in Industry Guide 7 ("SEC Industry Guide 7") under the U.S. Securities Act of
1933, as amended (the "U.S. Securities Act"), and are normally not permitted to be used in reports and filings with the U.S. Securities and Exchange Commission (“SEC”). Accordingly, information contained
herein that describes Piedmont’s mineral deposits may not be comparable to similar information made public by U.S. companies subject to reporting and disclosure requirements under the U.S. federal
securities laws and the rules and regulations thereunder. U.S. investors are urged to consider closely the disclosure in Piedmont’s Form 20-F, a copy of which may be obtained from Piedmont or from the
EDGAR system on the SEC’s website at http://www.sec.gov/.
Competent Persons Statements
The information in this presentation that relates to Exploration Results is extracted from the Company’s ASX announcements dated August 23, 2018, July 19, 2018, June 14, 2018, June 7, 2018, May 17, 2018,
May 10, 2018, April 9, 2018, 4 April 2018, 15 March 2018, 1 December 2017, 2 November 2017, 27 September 2017, 23 May 2017, 3 April 2017, and 18 October 2016 which are available to view on the
Company’s website at www.piedmontlithium.com. The information in this presentation that relates to Exploration Targets and Mineral Resources is extracted from the Company’s ASX announcement dated
June 14, 2018 which is available to view on the Company’s website at www.piedmontlithium.com. The information in this presentation that relates to Metallurgical Testwork Results is extracted from the
Company’s ASX announcements dated September 4, 2018 and July 17, 2018 which are available to view on the Company’s website at www.piedmontlithium.com. The information in this presentation that
relates to Process Design, Process Plant Capital Costs, and Process Plant Operating Costs is extracted from the Company’s ASX announcements dated September 13, 2018 and July 19, 2018 which are
available to view on the Company’s website at www.piedmontlithium.com. The information in this presentation that relates to Mining Engineering and Mine Schedule is extracted from the Company’s ASX
announcements dated September 13, 2018 and July 19, 2018 which are available to view on the Company’s website at www.piedmontlithium.com.
Piedmont confirms that: a) it is not aware of any new information or data that materially affects the information included in the original ASX announcements; b) all material assumptions and technical
parameters underpinning Mineral Resources, Exploration Targets, Production Targets, and related forecast financial information derived from Production Targets included in the original ASX announcements
continue to apply and have not materially changed; and c) the form and context in which the relevant Competent Persons’ findings are presented in this report have not been materially modified from the
original ASX announcements.
Exploration Target
The Exploration Target is based on the actual results of Piedmont’s previous drill programs. To determine potential tonnage and grade ranges at the deposit, Li2O assay values and density values from drilling
have been applied to the volume estimates. For the 80% of assays within pegmatite models that are above a 0.4 % Li2O cut off, an average grade of 1.10 % Li2O is estimated. For the 70% of assays that are
above a 0.6% Li2O cut off, an average grade of 1.20 % Li2O is estimated. Applying these assay frequency proportions to the modelled volumes outside the Mineral Resource results in estimated volume ranges
from 1.75 million cubic meters to 2 million cubic meters for spodumene bearing pegmatite with economically interesting grades. A density value of 2.71 g/cm3 is applied to derive tonnage values. Using this
methodology an Exploration Target of between 4.5 to 5.5 million tonnes at a grade of between 1.10% and 1.20% Li2O is approximated for the Piedmont Lithium Project deposit. The potential quantity and
grade of this Exploration Target is conceptual in nature, there has been insufficient exploration to estimate a Mineral Resource and it is uncertain if further exploration will result in the estimation of a Mineral
Resource.
28Piedmont Lithium Limited
Superior Strategic Positioning
Corporate Presentation – December 2018
Keith D. Phillips
+1 973 809 0505
kphillips@piedmontlithium.com
Head Office
28 West 44th Street |Suite 810 | New York | NY 10036 | USA
Exploration Office
5706 Dallas-Cherryville Hwy. 279 | Bessemer City | NC 28016| USA
Registered Office
28 The Esplanade | 9th Floor | Perth | WA 6000 | Australia
www.piedmontlithium.comYou can also read