HALF YEAR RESULTS 2019 - JULY 2019 LEADING THE WORLD OF MOLTEN METAL FLOW ENGINEERING - Vesuvius
←
→
Page content transcription
If your browser does not render page correctly, please read the page content below
2019
HALF YEAR
RESULTS
JULY 2019

LEADING THE WORLD OF MOLTEN METAL FLOW ENGINEERING
DISCLAIMER
This presentation (which includes this document, the oral presentation of this document, any question-and-answer session that follows that oral presentation and any other materials distributed at, or in
connection with, such presentation), which has been prepared by Vesuvius plc (the “Company”), includes statements that are, or may be deemed to be, “forward looking statements”, which can be identified by
the use of forward looking terminology, including (but not limited to) the terms “believes”, “estimates”, “plans”, “projects”, “anticipates”, “expects”, “intends”, “may”, “will”, or “should” or, in each case, their
negative or other variations or comparable terminology. These forward looking statements include matters that are not historical facts and include statements regarding the Company’s intentions, beliefs or
current expectations. By their nature, forward looking statements involve risk and uncertainty because they relate to future events and circumstances. A number of factors could cause actual results and
developments to differ materially from those expressed or implied by any forward looking statements. Any forward looking statement in this presentation reflects the Company’s view with respect to future
events as at the date of this presentation and is subject to risks relating to future events and other risks, uncertainties and assumptions relating to the Company and its subsidiaries’ operations, results of
operations, growth strategy and liquidity. The Company undertakes no obligation publicly to release the results of any revisions or updates to any forward looking statement in this presentation that may occur
due to any change in its expectations or to reflect events or circumstances after the date of this presentation. In addition, forward looking statements contained in this presentation regarding past trends or
activities should not be taken as a representation that such trends or activities will continue in the future.
Certain industry and market data contained in this presentation has been derived from third-party sources. While the Company believes each of these sources to be accurate, there is no guarantee as to the
accuracy or completeness of such data, and the Company has not independently verified such data. In addition, certain of the industry and market data contained in this presentation has been derived from the
Company’s own internal research, knowledge and experience of the market. While the Company believes that such data is reasonable and reliable, both it and the underlying methodology and assumptions
have not been verified by any independent source for accuracy or completeness and are subject to change without notice. Accordingly, the Company makes no representation as to the accuracy or
completeness of the industry or market data contained in this presentation and no reliance should be placed on any of the industry or market data contained in this presentation.
This presentation includes extracts from the Announcement of Half Year results for the six months ended 30 June 2019. You should read the whole of that announcement. No reliance should be placed for any
purposes whatsoever on the information contained in this presentation or on its completeness. Except as required by applicable law, the Company (nor any of its affiliates, associates, directors, officers,
employees, advisers) or any other person is under any duty to update or inform a recipient of this presentation of any change to the information contained in this presentation.
The presentation is being provided for information purposes only. The information contained in the presentation does not constitute or form part of, and should not be construed as, an offer to sell or issue, or
the solicitation of an offer to buy or subscribe for, securities or other financial instruments of the Company or any of its subsidiaries in any jurisdiction, or an inducement to enter into investment activity. No part
of the presentation, nor the fact of its distribution, should form the basis of, or be relied on in connection with, any contract or commitment or investment decision whatsoever.
The presentation is being made only to, and is only directed at, persons to whom such presentation may lawfully be communicated. This presentation is being made only to and directed only at persons in
member states of the European Economic Area (“EEA”) who are qualified investors within the meaning of Article 2(1)(e) of the Prospectus Directive (Directive 2003/71/EC), as amended (“Qualified Investors”).
In the UK, this presentation is being made and directed only at Qualified Investors who are persons who have professional experience in matters relating to investments falling within Article 19(5) of the
Financial Services and Markets Act 2000 (Financial Promotion) Order 2005, as amended (the “Order”), and persons who are high net worth entities falling within Article 49(2)(a) to (d) of the Order, or are
persons to whom it may otherwise be lawful to communicate it to (all such persons being referred to as “Relevant Persons”). This presentation must not be acted on (i) in the UK by persons who are not
Relevant Persons and (ii) in any member state of the EEA other than the UK, by persons who are not Qualified Investors. Any investment or investment activity to which this presentation relates is available
only to Relevant Persons in the UK and Qualified Investors in any member state of the EEA other than the UK and will be engaged in only with such persons.
This presentation is not an offer of securities and is not for publication or distribution in the United States or to persons in the US (within the meaning of Regulation S under the US Securities Act of 1933, as
amended), or in any other jurisdiction where such distribution is unlawful.

                                                                                                                                                                                                                        2
AGENDA

PERFORMANCE UPDATE       Patrick André, Chief Executive

FINANCIAL REVIEW     Guy Young, Chief Financial Officer

OUTLOOK                  Patrick André, Chief Executive

Q&A

                                                          3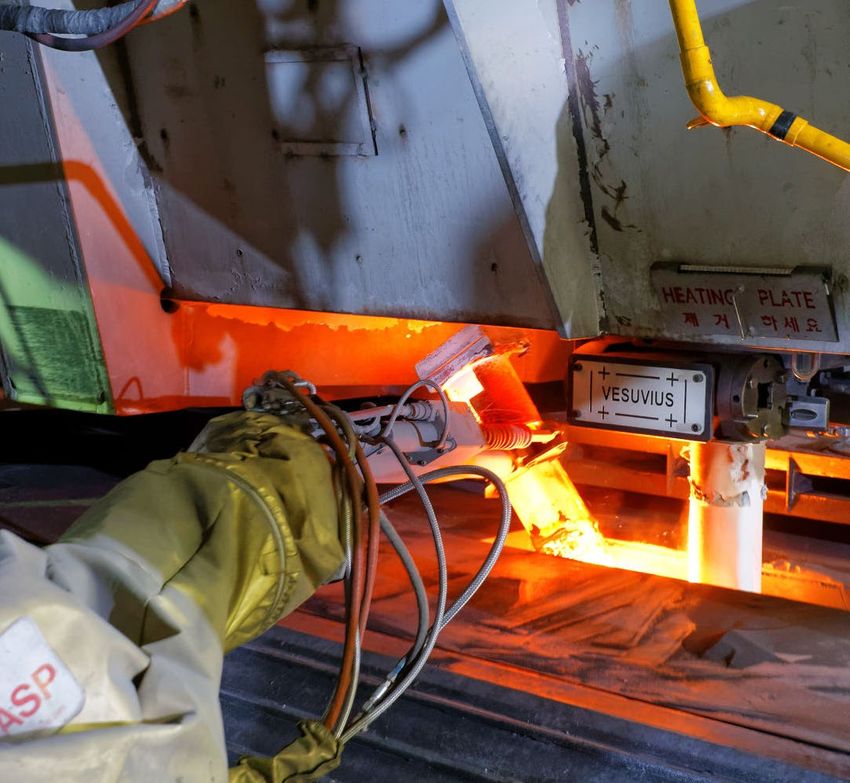
PERFORMANCE
UPDATE

              4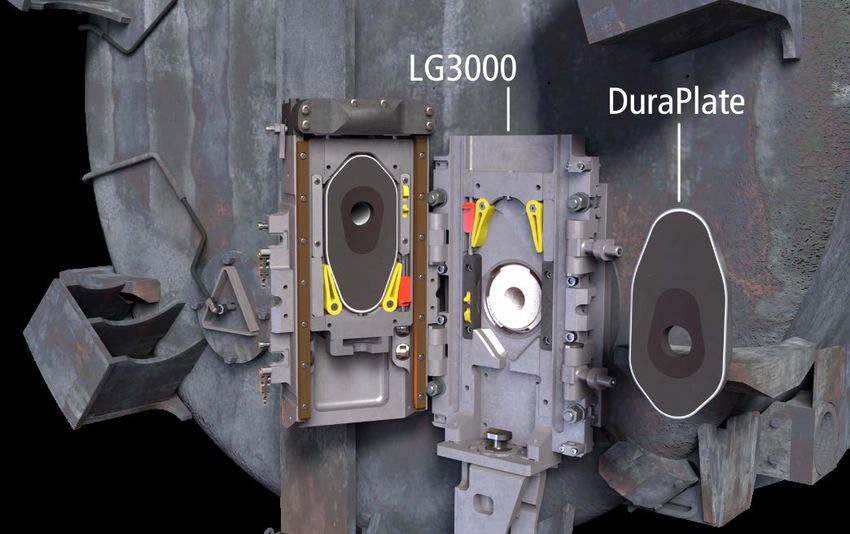
RESILIENT H1 2019 PERFORMANCE
DESPITE A CHALLENGING MARKET ENVIRONMENT

                  Revenue                                      Trading profit        Return on sales
                 £889.4m                                         £98.9m                   11.1%
                         -0.9%                                       -0.7%                  +2bps
                   Reported change                               Reported change         Reported change

                         -1.1%                                       -0.5%                  +6bps
                  Underlying change                              Underlying change      Underlying change

           Headline EPS                                      Net debt / EBITDA       Interim dividend
                      23.7p                                         1.3x                    6.2p
                         -6.7%                                   FY 2018: 1.0x              +3.3%

Note: Percentage change figures are H1 2019 versus H1 2018                                                  5
RESILIENT OPERATIONAL PERFORMANCE IN H1 2019
CHALLENGING STEEL MARKETS OUTSIDE OF CHINA AND LIGHT VEHICLE
RELATED MARKETS IN FOUNDRY
£5.8M OF RESTRUCTURING SAVINGS DELIVERED IN H1 2019
EXPANSION OF OUR RESTRUCTURING PROGRAMME WITH NEW RESTRUCTURING
INITIATIVES TARGETING £16M OF INCREMENTAL ANNUAL SAVINGS BY 2021
(INCLUDING CCPI SYNERGIES)
ACCELERATION OF LAUNCHES OF NEW PRODUCTS TO EXPAND OUR
MARKET SHARE GOING FORWARD
6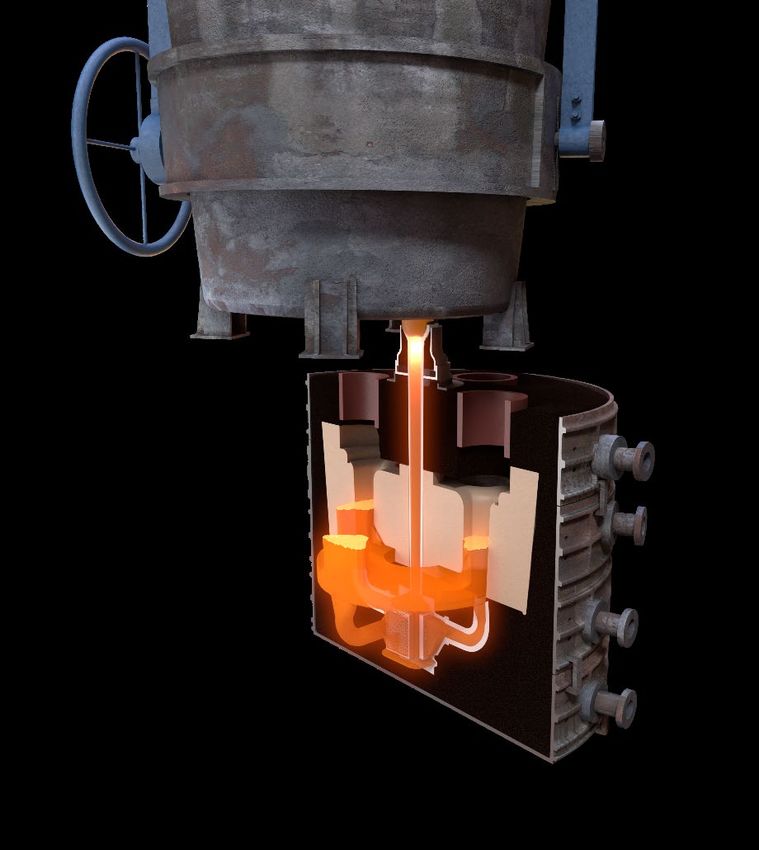
CHALLENGING ENVIRONMENT IN STEEL MARKETS OUTSIDE CHINA
                                          12%

                                          10%
                                                                                                                                                                 China
                                                                                                                                                                +10.2%
Crude steel production growth YTD May 2019/18

                                                8%                                                       NAFTA
                                                                                                         +3.5%
                                                6%    South East Asia
                                                          +3.5%
                                                4%
                                                                                                                                                            Crude steel production
                                                                                                                                                            growth YTD May 2019/18

                                                2%                                                                                                          China               +10.2%
                                                                                           India                                   EEMEA1
                                                                                                                                                            Rest of the world    -0.2%
                                                                                           +1.1%                                    -0.1%
                                                0%
                                                            South America                                                                  Crude steel production volume YTD May 2019
                                                                -2.6%
                                                -2%
                                                                                                                                 EU28
                                                                                                                                 -2.4%
                                                -4%

                                                -6%
                                                                        Size of bubble represents relative revenue of Vesuvius’ Steel Division in H1 2019
       Notes: 1. Eastern Europe, Middle East (incl. Turkey) and Africa                                                                                                                   7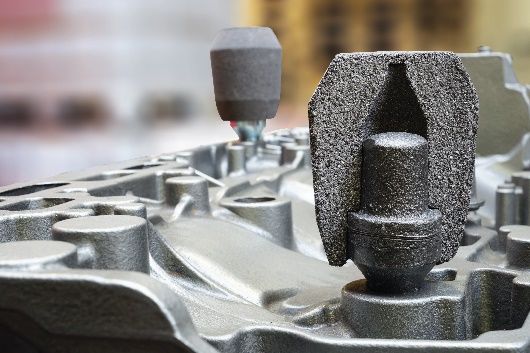
STEEL DIVISION PERFORMANCE VS. REGIONAL STEEL VOLUMES
                                                                               15%         South East Asia
                                                                                           Steel Division sales: +14%
                                                                               12%
                                                                                           Steel production: +3.5%                NAFTA (excl. CCPI)
                                                                                9%                                                Steel Division sales: +4%
                                                                                                                                  Steel production: +3.5%                     China
Steel Division revenue growth H1 2019/18

                                                 South America                  6%                                                                                            Steel Division sales: +11%
                                                 Steel Division sales: -0.5%                                                                                                  Steel production: +10.2%
                                                 Steel production: -2.6%        3%

                                                                                                                                                         Crude steel production growth YTD May 2019/18
                                                                                0%
                                           -4%                  -2%                   0%                  2%                 4%                  6%                  8%                  10%

                                                                               -3%                       India
                                                                                                         Steel Division sales: -5%
                                                                               -6%                       Steel production: +1.1%
                                             EU 28
                                             Steel Division sales: -3%         -9%              EEMEA1
                                             Steel production: -2.4%                            Steel Division sales: -11%
                                                                               -12%
                                                                                                Steel production: -0.1%

                                                                               -15%

                                                                       Size of bubble represents relative revenue of Vesuvius’ Steel Division in H1 2019
  Notes: 1. Eastern Europe, Middle East (incl. Turkey) and Africa                                                                                                                                    8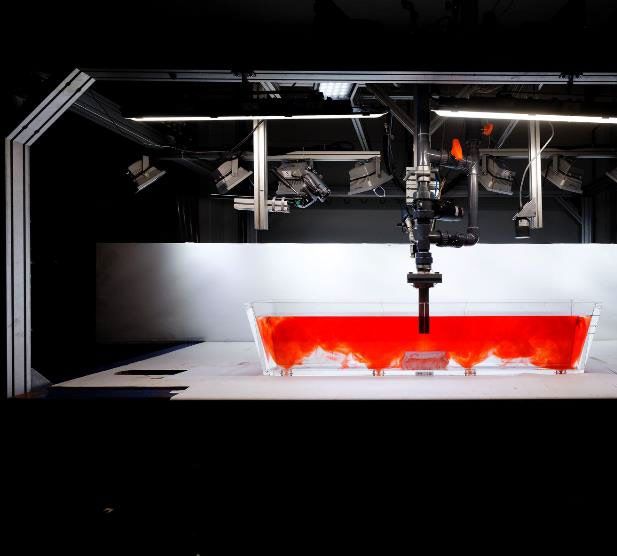
CHALLENGING ENVIRONMENT IN FOUNDRY END-MARKETS
                                        END-MARKET PERFORMANCE IN H1 2019                                      FOUNDRY DIVISION PERFORMANCE
                                         General
                                                                     Light
                                                                               Medium/heavy   Construction /             IN H1 2019
                                       engineering                              commercial     agriculture
                                                                   vehicles*
                                       and mining                                vehicles*     equipment

EMEA                                                                                                             EEMEA            EU 28

NAFTA                                                                                                            NAFTA

CHINA                                                                                                                             CHINA

INDIA                                                                                                                             INDIA
SOUTH                                                                                                            SOUTH
AMERICA                                                                                                         AMERICA
                                                                                                                                 NORTH
NORTH ASIA
                                                                                                                                  ASIA
* Light vehicles and medium/heavy commercial vehicles production                                                                              9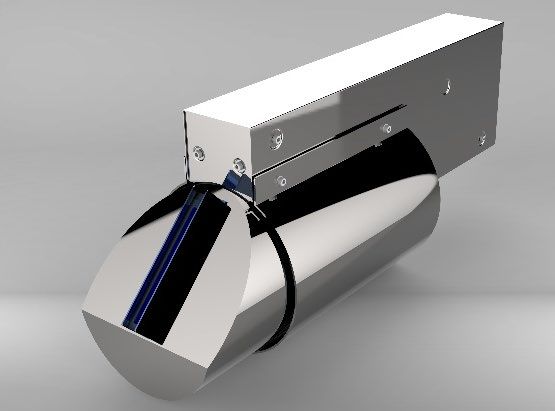
IMPORTANT STRATEGIC PROGRESS IN H1 2019
IN LINE WITH OUR OBJECTIVES
Acceleration of our R&D efforts with the expansion of our research centre in
Suzhou, China
Technology
leadership Successful launch in H1 2019 of several innovative new products
Quarterly waves of new product launches planned over next 18 months
Steel Division Foundry Division
H1 2019/18 revenue growth H1 2019/18 revenue growth
Increased penetration
in key developing
markets +11% +14% +10% +6%
China South East Asia EEMEA South America
10CONTINUED FOCUS ON VALUE-CREATING SOLUTIONS: STEEL
LAUNCH OF OUR NEXT GENERATION INCREASED PENETRATION OF OUR
HIGH PERFORMANCE SLIDE GATE PLATES ROBOTIC INSTALLATION AND LASER
AND SYSTEMS MEASUREMENT CAPABILITIES
Next generation
Continued penetration
lasers with increased
Enhanced performance and significant improvements in of our robots in Asia
scanning speed
safety, ergonomics and economics for our customers
11CONTINUED FOCUS ON VALUE-CREATING SOLUTIONS: FOUNDRY
LAUNCH OF OUR NEW FILTER TECHNOLOGY
FOR LARGE, HIGH VALUE STEEL CASTINGS
Minimisation of air entrainment in the metal
stream, preventing the generation of oxides
Cleaner metal
Improved fluidity enabling the use of finer
filters further improving final casting quality
12CCPI SYNERGIES ARE AHEAD OF EXPECTATION
Integration of CCPI Blanchester production into Vesuvius’ existing
North American manufacturing footprint
Expected synergies increased materially
Total of £4m synergies to be delivered in 2020
Post synergies multiple c.4x EBITDA
13£16M INCREASE IN RECURRING RESTRUCTURING SAVINGS
RECURRING RESTRUCTURING SAVINGS REMAINING TO BE DELIVERED
(CUMULATIVE ALL PROGRAMMES)
(£M)
5.0 35.0
18.2
11.8
H2 2019 2020 2021 Total
• In H1 2019 we delivered £5.8m of restructuring savings
• CCPI synergies are included in the restructuring savings target
• New restructuring initiatives have an incremental cost of £25.7m. We expect to incur the majority
of these costs by the end of 2019, with the exception of £3.0m, which will be incurred in 2020
14DIVISIONAL PERFORMANCE STEEL
KEY FINANCIALS
Reported Underlying Underlying revenue1 / Return on Sales1
£m H1 2019 H1 2018 Change change 1
10.3% 10.6% 11%
1000
Revenue 614.9 610.9 +0.6% +0.4% 10%
800
603 605 9%
600 8%
Trading profit 65.3 63.0 +3.7% +3.3%
400 7%
Return on Sales 10.6% 10.3% +30bps +30bps 200 6%
0 5%
H1 2018 H1 2019
H1 2019 PERFORMANCE
Resilient H1 2019 performance despite challenging steel markets outside of China
1) Resilient top-line despite specific customer issues in EEMEA and challenging competitive environment in India
2) Successful implementation of restructuring programmes
3) Initial positive impact of the CCPI acquisition
Note 1. H1 2019 underlying financials have been adjusted for CCPI acquisition and H1 2018 underlying financials have been adjusted for BMI disposal and for the effects of currency translations 15DIVISIONAL PERFORMANCE FOUNDRY
KEY FINANCIALS
Reported Underlying Underlying revenue1 / Return on Sales1
£m H1 2019 H1 2018 Change change1
450
12.6% 12.2% 13%
400
12%
Revenue 274.5 286.1 -4.0% -4.1% 350
300
286 275 11%
250
Trading profit 33.6 36.6 -8.2% -7.3% 10%
200
150 9%
100
Return on Sales 12.2% 12.8% -60bps -40bps 8%
50
0 7%
H1 2018 H1 2019
H1 2019 PERFORMANCE
Foundry Division revenue was affected by a challenging environment in light vehicle related markets
• Revenues down 7.8% in China and 7.6% in EU28
• On the positive side, prices have now been adjusted to compensate for historical raw material cost increases
• Implementation of restructuring actions in EMEA has been proceeding slower than planned. Corrective actions are underway
Note 1. H1 2018 underlying financials have been adjusted for the effects of currency translations 16FINANCIAL REVIEW LEADING THE WORLD OF MOLTEN METAL FLOW ENGINEERING
INCOME STATEMENT
                                                                                   H1 2019                         H1 2018                                               Change (%)
 (£m unless indicated)
                                                                                    Actual                          Actual                                     As reported      Underlying

 Revenue                                                                             889.4                           897.0                                       -0.9%                -1.1%

 Trading Profit                                                                       98.9                            99.6                                       -0.7%                -0.5%

 ROS %                                                                              11.1%                            11.1%                                       +2bps            +6bps

 Post tax Share of JV Results                                                          0.5                             2.6

 Net Finance Costs                                                                    (6.2)                           (4.8)

 Headline Profit Before Tax                                                           93.2                            97.4                                       -4.3%

 Effective Tax Rate                                                                 28.0%                            26.0%

 Tax                                                                                 (26.0)                          (24.6)

 Non-Controlling Interest                                                             (3.4)                           (4.1)

 Headline Earnings                                                                    63.8                            68.7                                       -7.1%

 Headline EPS (pence)                                                                 23.7                            25.4                                       -6.7%
Notes:
Underlying basis is at constant currency and excludes separately reported items and the impact of acquisitions and disposals                                                                  18
Income tax associated with headline performance, divided by the headline profit before tax and before the Group’s share of post-tax profit of joint ventures
RESILIENT REVENUE PERFORMANCE
• Revenue down £7.6m on a reported basis (-0.9%) and down £9.4m on an underlying basis (-1.1%)
(£m)
897.0 +3.2 -11.1
889.1 -9.4 +9.7 889.4
879.7
H1 2018 FX BMI H1 2018 Steel & Foundry H1 2019 CCPI H1 2019
Reported adjustments disposal Underlying Divisions Underlying acquisition Reported
revenue revenue revenue revenue
19SOLID TRADING PROFIT
• Trading profit down £0.7m on a reported basis (-0.7%) and down £0.5m on an underlying basis (-0.5%)
RoS 11.1% 11.1%
(£m) 99.6 -0.8 -0.2 98.6 -4.4 +5.8 -1.9 98.1 +0.8 98.9
H1 2018 FX BMI H1 2018 Steel & Foundry Restructuring One-off H1 2019 CCPI H1 2019
Reported adjustments disposal Underlying Divisions savings costs Underlying acquisition Reported
trading profit trading profit trading profit trading profit
20RESILIENT RETURN ON SALES PERFORMANCE
IN A CHALLENGING ENVIRONMENT
Half yearly steel production volume for world excluding China vs. Vesuvius return on sales (%)
World steel production
excl. China Return on sales (%)
435,000 11.5%
11.0%
430,000
10.5%
425,000
10.0%
9.5%
420,000
9.0%
415,000
8.5%
410,000 8.0%
2017 H2 2018 H1 2018 H2 2019 H1
World steel production excl. China Vesuvius return on sales (%)
21TRADE WORKING CAPITAL DEVELOPMENT
Debtor days (12m)
TRADE WORKING CAPITAL / REVENUE 79 78
78 77
77
26.6% 76
75
24.9%
Dec-18 Jun-19
23.9% 23.9%
Creditor days (12m)
58
56
56 55
54
52
Dec-18 Jun-19
Inventory days (12m)
2016 2017 2018 H1 2019 80 76
75
74
70
65
Dec-18 Jun-19
22CASH FLOW PROGRESS
CASH CONVERSION: 82.7%
+24.9 -25.4
(£m) 98.9 -10.3
-6.3
81.8
H1 2019 Depreciation Net capex Trade working Other Operating
Reported capital working cash flow
trading profit capital
23£307.0M NET DEBT AND 1.3X NET DEBT / LTM EBITDA
• Net debt up £59.0m at £307.0m, versus £248.0m at year end 2018
― £81.8m operating cash flow generation from continuing operations offset by £25.6m income taxes, £37.2m dividend payment, £32.4m
acquisition of CCPI and an adjustment of £29.6m to reflect the reclassification of leases under IFRS 16
+32.4 +3.2 307.0
+29.6 -81.8 +37.2
(£m) 248.0
+25.6 +1.0 228.4 +5.8
+6.0
Net Debt Transition to Operating Net Income JV / Non Net Debt Restructuring Dividends CCPI Others Net debt
year end IFRS 16 on cash flow interest taxes controlling before other paid acquisition H1 2019
2018 1 Jan 2019 interest adjustments
dividends
24OUTLOOK
25OUTLOOK
• We have experienced challenging end markets in H1 2019 and we do not expect
a recovery in H2 2019
• Current market conditions do not change the fact that in the medium-term and beyond, our core
end markets in both steel and foundry are structurally growing and we have the right strategy and
teams in place to deliver
• Assuming a stabilisation of our end markets at current levels, we expect our trading profit (EBITA)
for 2019 to be broadly in-line with market expectations, supported by the acceleration and
intensification of efforts to optimise our costs and we remain confident in our ability to grow both
trading profit (EBITA) and return-on-sales in the coming years
26Q&A
27APPENDIX
28WHAT WE DO
Steel Division Foundry Division
Steel Advanced
Product Lines Steel Flow Control Digital Services Foundry Technologies
Refractories
Revenue(1)
% of Group
36% 31% 2% 31%
Provides products, systems and Installation expertise and materials Provides products that Improves casting quality and foundry
services to regulate and protect the that withstand extreme enhance the control and process efficiency through the supply of
Overview
flow of steel in the continuous temperatures and offer corrosion monitoring of our customers’ products and application engineering to
casting process resistance at customers’ facilities production processes the global foundry industry
Products
Nozzles Tube Robotic spray Turbostop Probes and sensors Sleeves Coatings
Changers lining system
General Engineering & mining
End Steel Steel Light vehicle
Steel
Markets Aluminium, other industries Foundry Medium / heavy commercial vehicles
Construction equipment / agriculture
Brand
Note: 1. Based on HY 2019 underlying revenue 29IMPACT OF NEW ACCOUNTING STANDARDS
SUMMARY AT 30 JUNE 2019
IFRS 16 Leases has had the following impact after transition (1 January 2019)
Previous lease After application of
accounting, IFRS16, Net impact,
£m £m £m
Revenue - - -
Depreciation - (4.6) (4.6)
Other operating costs (5.6) - 5.6
Headline operating profit (5.6) (4.6) 1.0
Income Finance charges - (0.6) (0.6)
statement Profit before tax (5.6) (5.2) 0.4
Headline operating profit (5.6) (4.6) 1.0
Depreciation - 4.6 4.6
Operating cash flow (5.6) - 5.6
Repayment of lease liabilities - (5.6) (5.6)
Cash flow Financing cash flow - (5.6) (5.6)
Net cash flow (5.6) (5.6) -
31 Dec 2018 IFRS 16 1 Jan 2019 30 Jun 2019
impact
Balance sheet
Right of use assets 4.4 32.7 37.1 36.7
Trade and other receivables 3.1 (3.1) - -
Lease liabilities (3.9) (29.6) (33.5) (33.4)
The transition to IFRS 16 resulted in an increase in right of use assets of £32.7m, a decrease in trade and other receivables of £3.1m and
30
an increase in lease liabilities of £29.6m.IMPACT OF NEW ACCOUNTING STANDARDS
(PREVIOUS GUIDANCE- FEBRUARY 2019)
IFRS 16 Leases will have the following impact on transition (1 January 2019)
Current lease After application of Net impact,
accounting, IFRS16, £m
£m £m
Revenue - - -
Depreciation - (9) (9)
Income Other operating costs (10) - 10
statement Headline operating profit (10) (9) 1
Finance charges - (1) (1)
Profit before tax (10) (10) -
Headline operating profit (10) (9) 1
Depreciation - 9 9
Cash flow Net interest - (1) (1)
Operating cash flow (10) (1) 9
Repayment of lease liabilities - (9) (9)
Financing cash flow - (9) (9)
Net cash flow (10) (10) -
Balance sheet at Right of use assets - 33 33
1 Jan 19 Lease liabilities - (33) (33)
Equity adjustment - - -
31TAX UPDATE
• In line with guidance provided at the 2018 full year results, our Effective Tax Rate (“ETR”) in H1 2019 was 28.0%
(26.0% in H1 2018)
• This resulted in an H1 2019 headline tax charge of £26.0m, £1.4m higher than H1 2018’s figure of £24.6m
• The ETR increase is mainly due to a deferred tax charge of £6.2m in respect of the utilisation of our USA tax
losses in the period
32CRUDE STEEL PRODUCTION IS STRUCTURALLY GROWING
2.5
WORLD CRUDE STEEL PRODUCTION (MT)
CAGR
‘18 – ‘30
2.0 WORLD CAGR ‘18-’30: +1.3% Other
WORLD EXCL. CHINA CAGR ‘18-’30: +2.0% +2.9% emerging
markets1
1.5 +5.6% India
1.0
+0.5% China
0.5
Developed
+0.2%
markets2
0.0
'50 '54 '58 '62 '66 '70 '74 '78 '82 '86 '90 '94 '98 '02 '06 '10 '14 '18 '22 '26 '30
Sources: Historical data from World Steel Association. Forecasts are management estimates
Notes: 1. Eastern Europe, Middle East (incl. Turkey), Africa, Latin America and South East Asia 33
2. EU 28, USA, Canada and North AsiaGROWTH POTENTIAL FOR STEEL PER CAPITA
• Three heavily populated countries constitute considerable
Steel Production per capita potential for growth
1.6
1.4
• All have low steel production tonnes per capita vs. peers,
indicating expected growth in infrastructure and construction
1.2
development:
1.0
0.8 ― India
0.6
0.4 ― Brazil
0.2
0.0
― Mexico
South China Russia Turkey USA EU 28 Mexico Brazil India
Korea
Source: WSA for steel (2018) and World Bank for population (2018)
34GROWTH POTENTIAL FOR FLAT STEEL
80%
Proportion of Flat Steel by Region (2018)
70% Increased c.400bps
Since 2013
Proportion of Flat Steel Products (%)
60%
50%
40%
30%
20%
10%
0%
US EU28 South Korea Brazil China India
• Typical consumption of Flow Control products in flat steel is £1.5/T of steel vs £0.5/T of steel in long
Source: MEPS World Steel Outlook (Q1 2019)
35SUSTAINABILITY
REDUCING OUR CUSTOMERS’ REDUCING OUR OWN
ENVIRONMENTAL FOOTPRINT: ENVIRONMENTAL FOOTPRINT:
• Vesuvius delivers a wide range of solutions that help Change in fuel consumption across the Group in 2018
our customers improve the productivity of their
operations, reducing their environmental footprint in
the process
• Our products contribute to the reduction of our
customers’ energy usage through aiding thermal
optimisation, reject reduction and facilitation of
extended manufacturing sequences, meaning
less reheating
9.2% reduction
3.8% reduction
in global
• We enable our customers to produce higher quality in total fuel
greenhouse gas
steels and lighter, more complex castings which consumption(1)
emissions(2)
support improved fuel efficiency in their end products
Notes:
(1) Total reflects those fuels identified, not total consumption of all fuels in the Group as data for some minor forms of fuel are not currently collated.
(2) Kg of CO2e. 36HEALTH & SAFETY
• Health & Safety performance is linked to the Lost time injuries per million hours worked
remuneration of all senior managers
• Our objective is to identify, eliminate, reduce or
control all workplace risk
• Ongoing system of training, assessment and
improvement is in place to focus on achieving this
• 9,900 implemented safety improvement
Executive Safety Tours carried out in 2018
opportunities in 2018
China Europe
• Safety improvement plans in place at all sites
• Initiative to standardise repetitive activities 115 Executive
India NAFTA
Safety Tours
North Asia South America
South Asia
37PEOPLE AND COMMUNITY
PEOPLE ARE AT THE CENTRE VESUVIUS IN THE LOCAL COMMUNITY
OF OUR BUSINESS
• We have decided to focus our corporate social
• Our objective is to support and drive a high- responsibility activities on two key areas:
performance culture by truly engaged employees 1. Supporting educational opportunities for disadvantaged
young people in developing countries
• Our training programmes include:
2. Encouraging more women into scientific/ technical fields of
―Advance: First generation management development education
―Wings: Middle Management development programme
• Selected activities in the local community from 2018:
―Ascent: High potential and senior leadership
development programme • Mexico: Volunteering in a childrens’ home and
a home for the elderly
―Heat: Technical training in the products of Vesuvius
• Italy: Sponsor of the Aosta half marathon
• We also offer an international scholarship
programme to assist children of Vesuvius • France: Employees took part in ‘Pink October’
employees finance higher education Breast Cancer awareness
• China: Sponsor of the first Young Entrepreneur Form
of the Chinese foundry industry 38CURRENCY READY RECKONER
Jun-19 • Rule of thumb for impact of a movement in currency against
sterling (1 unit change)
Approximate
Trading profit Unit change in annual
profits (£m) ― Amounts shown are movements for each currency
USD 1 cent 0.5
― Works both for strengthening and weakening of currencies
EUR 1 cent 0.2
INR 1 rupee 0.2
RMB 0.1 RMB 0.4
JPY 1 Yen 0.1
BRL 0.01 reais 0.2
ZAR 1 rand 0.0
39For further information, please contact: Euan Drysdale, Group Head of Corporate Finance euan.drysdale@vesuvius.com Virginia Skroski, Investor Relations Manager virginia.skroski@vesuvius.com LEADING THE WORLD OF MOLTEN METAL FLOW ENGINEERING
You can also read