SHELF DRILLING PRESENTATION - DNB CONFERENCE | OSLO MARCH 2018
←
→
Page content transcription
If your browser does not render page correctly, please read the page content below

Shelf Drilling Presentation
DnB Conference | Oslo
March 2018
Disclaimer
 This presentation does not constitute or form part of, and should not be construed as, any offer, invitation or recommendation to purchase, sell or subscribe for any securities in
 any jurisdiction and neither the issue of the presentation nor anything contained herein shall form the basis of or be relied upon in connection with, or act as an inducement to
 enter into, any investment activity. This presentation does not purport to contain all of the information that may be required to evaluate any investment in the Company or any
 of its securities and should not be relied upon to form the basis of, or be relied on in connection with, any contract or commitment or investment decision whatsoever. This
 presentation is intended to present background information on the Company, its business and the industry in which it operates and is not intended to provide complete
 disclosure upon which an investment decision could be made. The merit and suitability of an investment in the Company should be independently evaluated and any person
 considering such an investment in the Company is advised to obtain independent advice as to the legal, tax, accounting, financial, credit and other related advice prior to making
 an investment. Any decision to purchase securities in any offering the Company may make in the future should be made solely on the basis of information contained in any
 prospectus or offering circular that may be published by the Company in final form in relation to any such proposed offering and which would supersede this presentation and
 information contained herein in its entirety.
 To the extent available, the industry and market data contained in this presentation has come from official or third party sources. Third party industry publications, studies and
 surveys generally state that the data contained therein have been obtained from sources believed to be reliable, but that there is no guarantee of the accuracy or completeness
 of such data. While the Company believes that each of these publications, studies and surveys has been prepared by a reputable source, the Company has not independently
 verified the data contained therein.
 In addition, certain of the industry and market data contained in this presentation come from the Company's own internal research and estimates based on the knowledge and
 experience of the Company's management in the market in which the Company operates. While the Company believes that such research and estimates are reasonable and
 reliable, they, and their underlying methodology and assumptions, have not been verified by any independent source for accuracy or completeness and are subject to change
 without notice.
 This presentation includes forward-looking statements. The words "expect", "anticipate", "intends", "plan", "estimate", "aim", "forecast", "project" and similar expressions (or
 their negative) identify certain of these forward-looking statements. These forward-looking statements are statements regarding the Company's intentions, beliefs or current
 expectations concerning, among other things, the Company's results of operations, financial condition, liquidity, prospects, growth, strategies and the industry in which the
 Company operates. The forward-looking statements in this presentation are based on numerous assumptions regarding the Company’s present and future business strategies and
 the environment in which the Company will operate in the future. Forward-looking statements involve inherent known and unknown risks, uncertainties and contingencies
 because they relate to events and depend on circumstances that may or may not occur in the future and may cause the actual results, performance or achievements of the
 Company to be materially different from those expressed or implied by such forward looking statements. Many of these risks and uncertainties relate to factors that are beyond
 the Company's ability to control or estimate precisely, such as future market conditions, currency fluctuations, the behavior of other market participants, the actions of regulators
 and other factors such as the Company's ability to continue to obtain financing to meet its liquidity needs, changes in the political, social and regulatory framework in which the
 Company operates or in economic or technological trends or conditions. Past performance should not be taken as an indication or guarantee of future results, and no
 representation or warranty, express or implied, is made regarding future performance.

Shelf Drilling Presentation (March 2018)                                                                                                                                             2
Introduction
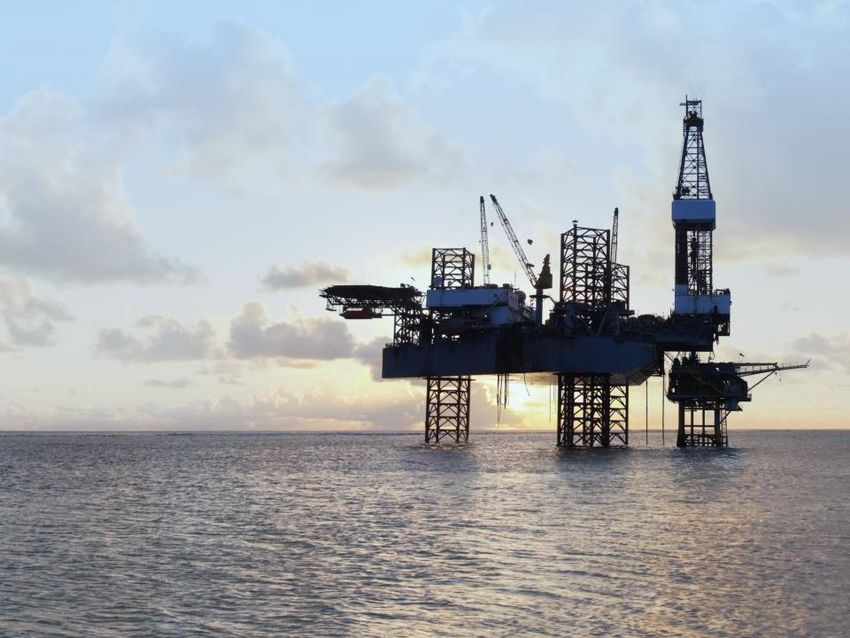
Shelf Drilling is the World’s Largest Jack-up Contractor
Company Overview Key Milestones
• International “pure-play” jack-up drilling Nov
2012 Shelf Drilling’s initial fleet acquisition
contractor
Dec
• Fit-for-purpose operations with sole focus on 2013 Operating independence
shallow water
May
10 rig-years contract with Chevron for 2 newbuilds
• Headquarters centrally located in Dubai 2014
• Top tier safety and operational performance Jun
Expansion in Middle East (4 to 10 operating rigs)
2015
• Robust full cycle financial performance
Dec
Seamless, on-time and on-budget SDC start-up
Fleet Size 2016
Jan
38 ILC jack-ups and 1 swamp barge 2017 Completed refinancing transaction
Apr
2017 Equity raise on NOTC to acquire 3 premium jack-ups
Jun
2017 Seamless, on-time and on-budget SDK start-up
Sep
2017 All recently acquired jack-ups under contract
Jan
2018 Completed refinancing transaction
Shelf Drilling Presentation (March 2018) 3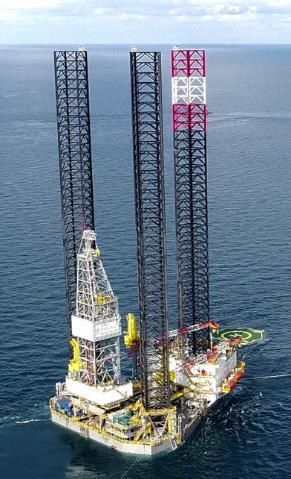
Introduction
Shelf Drilling is the Leading Contractor in Core Jack-up Markets
                               Global Jack-up Activity vs. Shelf Drilling's Geographical Fleet Distribution

                                                                                                        Shelf’s fleet has
                                                                   Shelf’s fleet has                  increased from 6 to
                                                                 increased from 4 to                      9 since 2012
                                                                12 in the Arabian Gulf
                                                                      since 20121
                                                                                                 #1
                                                                                                        #1
                                                                                      #1                         #4
                                                            Significant recent
                                                               increase in
                                                            tendering activity

                                                       Operating in the most active and promising markets

Color represents jack-up activity level                              High    Medium        Low

Number (#) represents Shelf Drilling’s operating position
Source: Rystad Energy RigCube
1 Arabian Gulf defined as Bahrain, Qatar, Saudi Arabia and the UAE

Shelf Drilling Presentation (March 2018)                                                                                    4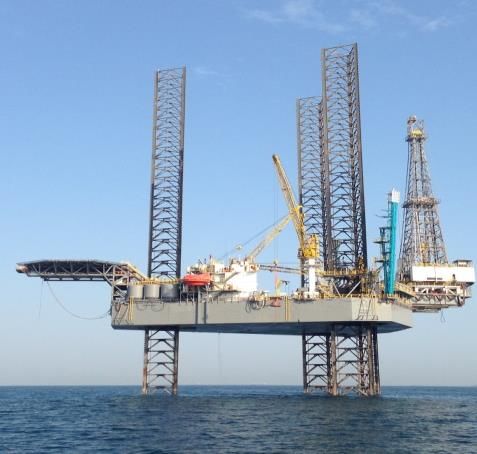
Industry Backdrop
Shelf Drilling’s Core Markets Provide Exposure to Short-Cycle, Low-Cost Oil
Supply
                                   Commentary                                                                                                              Cost of Supply¹
                                                                                                               Global liquids cost curve
 • Shallow water production represents ~65% of                                                                 Brent equivalent forward looking breakeven oil price, USD/bbl
   global offshore oil supply                                                                                 80

 • Full-cycle break-even oil prices are among the                                                             70
                                                                                                                                                                                         Oil sands
   lowest globally, with many shallow water
                                                                                                                                                                                                                 Russia
   projects economic at current commodity                                                                     60                                                   Extra Heavy Oil                              onshore
   prices
                                                                                                                                                                                              49        50          50
                                                                                                              50
                                                                                                                                              Shallow Deepwater
 • Shallow water developments typically are                                                                                                    Water
                                                                                                                                                                41
                                                                                                                                                                                   42
                                                                                                                          Shelf Drilling core RoW
   shorter cycle and lower cost relative to                                                                   40               markets
                                                                                                                                                     35 36 36
   deepwater developments
                                                                                                              30                                 28                                                North American
                                                                                                                                                                                                        shale
 • Historically, the jack-up market has recovered                                                                                                                   Ultra Onshore RoW
   before the floater market                                                                                  20
                                                                                                                               15
                                                                                                                                                                  deepwater

                                                                                                              10                              Shallow
                                                                                                                                               Water
                                                                                                                        Onshore Middle
                                                                                                                                             Middle East
                                                                                                                             East
                                                                                                                0
                                                                                                                    0        10         20        30         40         50        60          70        80      90        100   110

                                                                                                                                        Cumulative liquids production in 2022 (Million barrels per day)

               Shallow water activity increasing in 2017/18 driven by existing and new developments
Source: Rystad Energy RigCube, IHS Petrodata
¹ Breakevens calculated as of the current year; all historical cash flows are sunk; assumes 10% discount rate; Shelf Drilling core markets defined as Middle East, India and Southeast Asia

Shelf Drilling Presentation (March 2018)                                                                                                                                                                                          5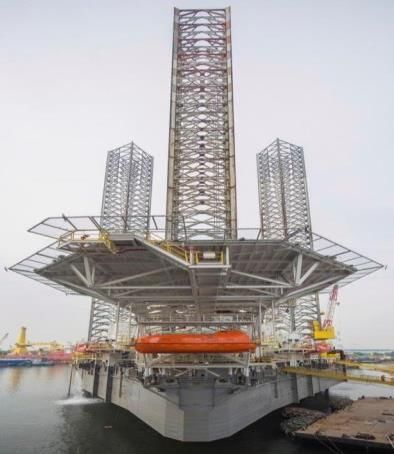
Industry Backdrop
Cycle Turning Off of Historic Lows
Oil Price # of Contracted Jackups
Million bbl/d
$160 500 25
Contracted JUs Shallow Water Production
$140
458 Peak (April 2014)
450
20
$120
400
$100 372 Average since 2006 15
$80 350
10
$60 306
300
Minimum since 2006 (Jan 2017)
$40
5
250
$20
$0 200 0
Jan-00
Jan-01
Jan-02
Jan-03
Jan-04
Jan-05
Jan-06
Jan-07
Jan-08
Jan-09
Jan-10
Jan-11
Jan-12
Jan-13
Jan-14
Jan-15
Jan-16
Jan-17
Jan-00
Jan-01
Jan-02
Jan-03
Jan-04
Jan-05
Jan-06
Jan-07
Jan-08
Jan-09
Jan-10
Jan-11
Jan-12
Jan-13
Jan-14
Jan-15
Jan-16
Jan-17
Jan-18
• Global shelf production has declined amid rising contracted jack-ups as fields mature
• Level of jackup activity at end of 2016 lowest since early 2000s – rig count steadily increasing through 2017
• Average rig demand of 372 units since mid-2000s (nearly 400 over last 5 years)
• In prior downturns, oil prices tend to bottom out long before rig count trough (6-12 months) – improving commodity price leading
indicator for rise in activity and utilization
Source: Rystad Energy RigCube
Shelf Drilling Presentation (March 2018) 6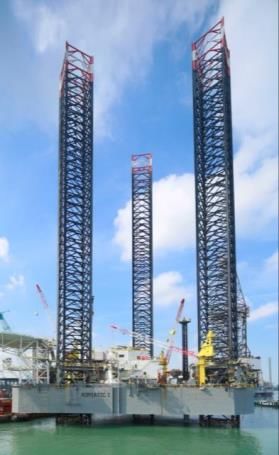
Shelf Drilling Overview
Shelf Drilling Overview
2017 Highlights

     Successfully completed refinancing transaction
     Reduced debt burden from $825MM to $533MM through issuance of new notes and preferred equity

     Concluded US$225MM equity issuance on Norwegian Over-the-Counter (OTC) list

     Acquired three premium jack-up rigs from Seadrill using proceeds from OTC equity issuance
     Total rig count increased to 38, plus one swamp barge

     Second newbuild rig – Shelf Drilling Krathong – on time delivery and contract commencement, and smooth
     transition into operations

     First contracts with Dubai Petroleum in UAE and Bahrain Petroleum Company / Schlumberger in Bahrain

     Secured contracts for all three recently acquired premium jackup rigs

Shelf Drilling Presentation (March 2018)                                                                      8
Shelf Drilling Overview
Unique Approach to Newbuild Design and Construction
  Contract award covering 10 rig-years for two highly customized, fit-for-purpose newbuild jack-ups

What we have done differently…                                       First newbuild – Shelf Drilling Chaophraya
                                                                    (SDC), started contract on December 1, 2016
• Newbuild program in conjunction with Chevron contract award
                                                                     Second newbuild – Shelf Drilling Krathong
     - Each rig backed by a five year contract with Chevron
                                                                       (SDK), started contract on June 1, 2017

• Less risk as compared to other newbuilds in the market
     - Collaborative effort between Chevron, Shelf Drilling and
       Lamprell personnel over a period of several months
     - Substantial cost savings relative to existing rig designs

• Uniquely designed for more efficient operations
     - High degree of customization to optimize well construction
       in the Gulf of Thailand

• Both rigs were delivered within budget and on time, and had
  smooth start-up for operations

                                                                                   SDK                   SDC

Shelf Drilling Presentation (March 2018)                                                                          9
Shelf Drilling Overview
Secured Contracts for Three Recently Acquired Premium Jack-ups
                                    Contract Details                                                                                        Timeline of Events

                                                                                                                1 May               Announced rig acquisitions from Seadrill
                                               Shelf Drilling Mentor 1 &
                                               Shelf Drilling Tenacious 1
                                                                                                               18 May               Concluded delivery of SDT and SDR

                                                                                                                 8 Sep              Secured contract for SDR with Chevron Nigeria

                                              • Two-year contract secured with
                                                Dubai Petroleum for each rig
                                                                                                                 8 Sep              Concluded delivery of SDM
                                              • Each contract includes two one-
                                                year options                                                                        Secured contracts for SDT and SDM with Dubai
                                                                                                                11 Sep
                                              • Start-up of operations in January                                                   Petroleum
                                                2018
                                              • Opportunity further strengthens                               Jan 2018              Contracts commenced for SDM and SDT
                                                our market leading position in the
                                                Middle East region
                                                                                                                  Mar
                                                                                                                  2018
                                                                                                                                     Contract commenced for SDR

                                              Shelf Drilling Resourceful                                 • Strategic acquisition opportunity that significantly enhanced
                                                                                                           fleet composition
                                                                                                              - Attractive price for 3 rigs that had been “top of the list” of
                                                                                                                acquisition targets for some time
                                                                                                              - Deal positioned us well to protect and expand leading
                                              10 months firm + six-month option
                                                                                                                market position in key markets
                                              with Chevron Nigeria 2
                                                                                                         • Secured contracts for all rigs within five months
  1. Currently in an unrestricted subsidiary, which will become part of the credit group and a guarantor within one year. 2. As signed in 2017.

Shelf Drilling Presentation (March 2018)                                                                                                                                            10
Shelf Drilling Overview
Differentiated Performance in Securing Contracts
Backlog Quality and Diversity Jack-up Backlog Years Added (2014-2017 YTD)¹
Shelf 73
Ensco 55
Others
3% Rowan 39
IOC’s NOC’s
45% 53% Seadrill 38
Noble 24
Source: Shelf Drilling management records as of September 2017 Paragon 21
Note: Customer logos include current and prior customers
• US$ 1.4 billion backlog (December 2017) Atwood 3
• 97% of backlog with NOCs and IOCs
• 28 contracted rigs with on average ~1.5 years of remaining Borr 1
contract term
Source: Rystad Energy RigCube
1 As of November 2017
Shelf Drilling Presentation (March 2018) 11Shelf Drilling Overview
Industry Leading Operating Cost Levels
• Lowest cost international operator as Industry Study of Cash Operating Costs per Jack-up rig (US$000/Day)1
compared to US-listed public company Avg peer operating cost Shelf operating cost
competitors
• High national content, standardization of 5.7
equipment, and centralized management are -37%
3.8
key enablers in maintaining low cost base 51.0
45.0
32.0 28.3
• Savings across all rig operating expense
categories in 2015 and 2016
Rig opex Corp G&A Total opex Total opex Corp G&A Rig opex
• Major investment in existing rig fleet from
2013 to 2015 positioned company / fleet well Actual Spending Comparison (US$000/Day)2
ahead of downturn Cap & Deferred Expenditures Overhead Operating Expenses
-20% -48%
• Reorganization of Dubai HQ and field office
locations contributed to 37% reduction in
G&A over two-year period
• Expect to sustain reduced levels in 2018 and
beyond
Actual 2014 Actual 2015 Actual 2016
Reduced costs across all regions to
streamline operations and adjust to current market
Source: Rystad Energy RigCube
1 Daily cost per active jack-up rig is a non-GAAP financial measure that reflects the operating and maintenance and general and administrative expenses per active jack-up rig. 2016A for Ensco, Rowan, Noble, Atwood, Paragon and
Seadrill (assuming floater opex markup of 2.9 compared to jack-ups); Shelf Drilling costs based on 35 rigs and 2016A data; data excludes depreciation, amortization, deferred costs, large impairment costs and the actual, or any
regional variation in, stacked or idle rig cost that we incur in our operations for Shelf Drilling and peers; data is based on assumed stacked and idle jack-up rig costs for Shelf and its peers
2 Per day figures reflect fleet average. Consolidated costs by category allocated evenly across marketable rig fleet of 34.6, 34.5 and 31.2 in 2014, 2015 and 2016, respectively
Shelf Drilling Presentation (March 2018) 12Shelf Drilling Overview
Superior Credit Profile Relative to Peers
Recently completed $600MM offering of 8.25% senior Total Debt / LTM Adjusted EBITDA
unsecured notes due 2025 the proceeds of which were
7.0x
used to fund a tender offer and redemption of existing
senior secured notes due 2018 and 2020 4.7x 5.0x
4.5x
3.8x
• Opportunistically addressed outstanding near- and medium- 3.1x
term maturities
• Extends debt maturity profile – no debt maturities before 2025 1
Peer 5 SHLF Peer 4 Peer 1 Peer 2 Peer 3
• Reduction in financing costs (~1.25% savings on coupon versus
existing 2020 notes)
• Simplifies capital structure with a single tranche of notes
Backlog / Total Debt
• Increases liquidity and financial flexibility (approximately
$300MM of pro forma liquidity) 1.5x
1.3x 1.3x
• Top tier credit profile
0.8x
- Debt / LTM Adjusted EBITDA of 3.8x versus peer average 0.7x
4.8x
0.3x
- Best-in-class backlog coverage on debt of 1.5x versus peer
average 0.9x
Note: SHLF shown pro forma for offering. Peers include DO, ESV, NE, RDC and RIG. SHLF Peer 4 Peer 5 Peer 3 Peer 2 Peer 1
Source: Company posted company material and peer filings.
1 Other than obligations under sale leaseback transactions
Shelf Drilling Presentation (March 2018) 13Shelf Drilling Overview
Track Record of Capital Discipline and Value Creation
• Acquired original 38-rig fleet at attractive valuation Illustrative Cost of Upgrades vs New Rig Acquisitions
level
• Initial focus for growth capital allocation (2013 and 2013-2014 2017
2014) on reactivation and upgrade of stacked rigs, 250
which provided meaningful incremental earnings Build or Acquire
and offered compelling project economics 225
New Rig
(US$ 200-250
million)
• Investment in two newbuilds underpinned by long- 200
term contract with Chevron
175
- Cost effective and customer-optimized design
predicated on delivering superior returns 150
• Near-term focus on rig acquisitions 125
Acquire New
- Opportunities exist to add quality rigs that align 100 Jackup
with our fit for purpose strategy (US$ 70 –120
75 million)
- Leverages Company's integration and execution Reactivate & Upgrade
competency (US$ 50-75 million)
50
Reactivate & Upgrade (US$ 35-50 million)
25
0
Value proposition in current environment –
Acquiring high quality jack-ups at meaningful discount to replacement cost
Shelf Drilling Presentation (March 2018) 14Shelf Drilling Overview
Differentiated Operating Platform
Demonstrated Backlog Generation
• Proven track record of securing contracts throughout the cycle and preserving best-in-class backlog
• US$ 1.4 billion revenue backlog, ~1.5 years per contracted rig, 97% with NOCs and IOCs
• Established long term relationship with all customers in our core markets
Top Tier Safety and Operational Performance
• Operational excellence in safety and uptime
• On-time, on-budget delivery and near perfect start-up of Newbuilds operations
• Quality of assets and fit-for-purpose fleet positioning strategy well suited for our markets
Low Cost Operator – Differentiating Advantage
• Lean, centralized management structure combined with high national content
• Industry leading cash operating costs per jack-up rig (37% below peers1)
Uniquely positioned to execute demonstrated growth strategy
1 2016A for Ensco, Rowan, Noble, Atwood, Paragon and Seadrill (assuming floater opex markup of 2.9 compared to jack-ups); Shelf costs based on 35 rigs and 2016A data; data excludes depreciation, amortization, deferred costs and
large impairment costs for Shelf and peers
Shelf Drilling Presentation (March 2018) 15Appendix
Appendix
Rig Intensity Example – Large fields in Middle East
                                    UAE has seen rig intensity rise to above 15 units per mmboe/d

* Based on data published through October 2017
Source: Rystad Energy UCube; Rystad Energy RigCube

Shelf Drilling Presentation (March 2018)                                                            17
Appendix
Global Jack-up Fleet Comparison
38 Contracted
2
36 Joint Ventures
1 Idle
8 Cold Stacked
7
Under construction &
28 uncontracted
2
26
5 24
22
8
11 7 4
15 15
4
14
28 7
5 2
23 12
8
4
12
6 11
10
7 8
5 6
3 2
Shelf Drilling ENSCO Rowan 2 Seadrill 3 Borr 4 Paragon Aban Offshore Maersk Drilling Noble
¹
Largest contracted fleet of jack-ups globally with 28 units
Source: ODS Petrodata as of 05 March 2018. 1. Does not include swamp barge. 2. 12 rigs managed by ARO, 7 owned by Rowan. 3. Includes 6 rigs owned by Sea-Mex, excludes rigs owned by NADL.
4. Excludes 2 Thailand jack-ups managed by Transocean.
Shelf Drilling Presentation (March 2018) 18Appendix
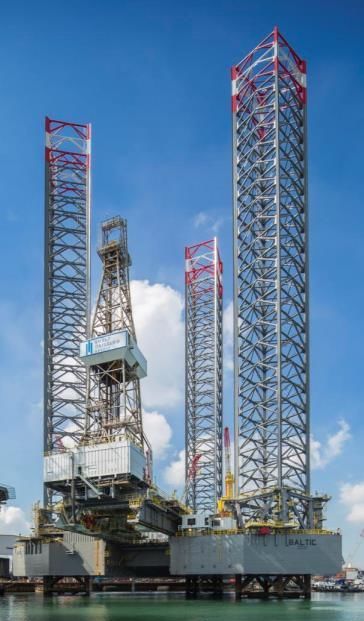
Major Upgrades & Reactivations
Baltic (MLT Super 300) Adriatic I (MLT116-C) Key Singapore (MLT116-C) High Island V (MLT82-SDC) High Island IX (MLT82-SDC)
• ~US$ 52 million capital • ~US$ 50 million capital • ~US$ 72 million capital • ~US$ 70 million capital • ~US$ 90 million capital
investment investment investment investment investment
• 375 ft water depth • 350 ft water depth • 350 ft water depth • 270 ft water depth • 250 ft water depth
• Static hook load capacity • Static hook load capacity • Static hook load capacity • Static hook load capacity • Static hook load capacity
1,300,000 lbs. 1,500,000 lbs. 1,500,000 lbs 1,000,000 lbs. 1,000,000 lbs.
• 3x2200 hp mud pump, • 3x1600 hp mud pump, • 3x1600 hp mud pump, • 2x1600 hp mud pump, • 3x1600 hp mud pump,
7,500 psi 7,500 psi 7,500 psi 5,000 psi 5,000 psi
• 3,000 HP rated drawworks • 3,000 HP rated drawworks • 3,000 HP rated drawworks • 2,000 HP rated drawworks • 2,000 HP rated drawworks
• Cantilever reach 60 ft x 24 ft • Cantilever reach 60 ft x 30 ft • Cantilever reach 55 ft x 30 ft • Cantilever reach 40 ft x 20 ft • Cantilever reach 40 ft x 20 ft
• Rebuilt accommodation for • Rebuilt accommodation for • Rebuilt accommodation for • Rebuilt accommodation for • Rebuilt accommodation for
120 persons 120 persons 120 persons 100 persons 100 persons
• 18-month contract in • Contracted from Q2 2018 • 36-month contract in Abu • Repowered with 4 x CAT • Repowered with 4 x CAT
Nigeria until April 2018 (with through FY 2019 with 2 Dhabi until September 2018, 3512-C main engines 3516-B main engines
additional 6-month option) customers in Nigeria plus options • 5-year contract with Saudi • Continuously contracted to
Aramco until October 2018 Saudi Aramco for 8 years
until Q2 2021, plus options
Shelf Drilling Presentation (March 2018) 19Appendix
Resilient Full-Cycle Financial Results and Cash Flow Generation
• Strong financial performance since company inception Revenue & Adjusted EBITDA (US$MM)1
US$ million % Margin
1,400 1,310 50%
1,169
- Disciplined approach to financial planning and capital 1,120 41% 1,030 42% 44%
40% 43%
investment
840 684 38%
537 36%
560 467 427 32%
371
290
- Significantly outperformed internal budget in 2013 280 184 26%
and 2014
0 20%
2013 2014 2015 2016 YTD 2017³
- 2015 and 2016 results stronger than initial forecasts Revenue Adjusted EBITDA Margin
due to expense and capex savings
Unlevered Discretionary Free Cash Flow2
US$ million % Margin
- Adjusted EBITDA margins1 consistently in 40% range 400 50%
320 293 40%
268 34%
30%
- Resilient cash flow generation through cycle 240 30%
160 13% 20%
23% 22%
203 145
80 10%
136
0 0%
2013 2014 2015 2016 YTD 2017³
Adjusted Free Cash Flow Margin (As % of Rev)
12013-2015 revenues are based on Adjusted Revenue; see slide 37 for important information regarding Adjusted Revenue and slide 36 for important information regarding Adjusted EBITDA and Adj usted EBITDA margin, each
a non-GAAP financial measure; 2 See slide 37 for important information regarding Unlevered Discretionary Free Cash Flow; 3 Nine months ended 9/30/2017;
Shelf Drilling Presentation (March 2018) 20Appendix
Shelf Drilling Legal Structure Summary
Private Equity Sponsors (62.1%) 1 NOTC Shareholders (33.8%) Management Shareholders (4.1%)
Shelf Drilling, Ltd. $167MM Preferred Shares 2
Shelf Drilling Midco, Ltd.
Shelf Drilling Intermediate, Ltd.
$160MM Revolving Credit Facility
(1st Lien)
Shelf Drilling Holdings, Ltd.
$600MM Senior Unsecured Notes
due 2025
$330MM sale
leaseback facility Non-Guarantor Guarantor EGP90 million unsecured
$75MM senior Subsidiaries 3 Subsidiaries 5 overdraft facility
secured credit facility SDA III 4
1. Lime Rock Partners: 20.7%; Castle Harlan: 20.7% ; CHAMP Private Equity: 20.7%
2. 50% owned by Castle Harlan and CHAMP Private Equity
3. Includes legal entities associated with operation of two newbuild rigs with Chevron in Thailand
4. Asset owning entity for two jackups contracted with DPE (SDT and SDM)
5. includes asset owning and operating entities 34 jack-ups and 1 swamp barge
Shelf Drilling Presentation (March 2018) 21You can also read