Results Briefing for the Year Ended March 31, 2021 - June 3, 2021
←
→
Page content transcription
If your browser does not render page correctly, please read the page content below
Research
                                                             Service
                                                             Technology

Results Briefing
for the Year Ended March 31, 2021
                                       June 3, 2021

                      Copyright Ⓒ2021 Ahresty Corporation. All Rights reserved.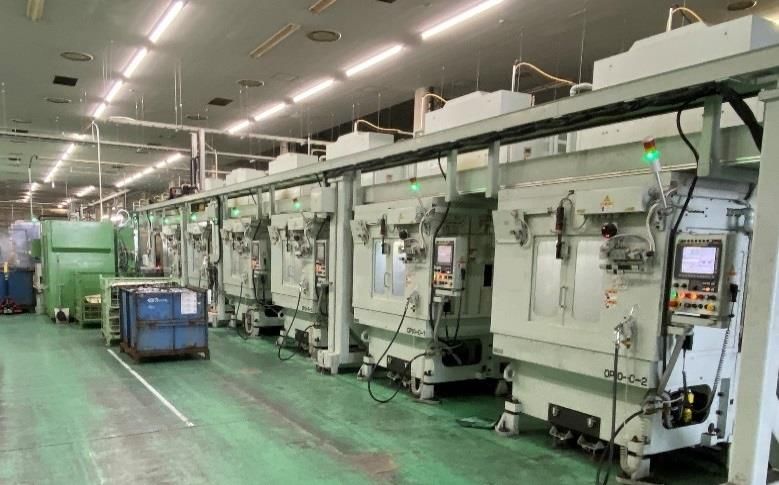
Results of Year ended March 2021 and
  Released Forecasts for Year ending
                          March 2022

             1
                     Copyright Ⓒ2021 Ahresty Corporation. All Rights reserved.
Key Results for the Fiscal Year Ended March 2021
(Million yen)
Year ended Year ended March 2021
March 2020 Released
Full year 1Q 2Q 3Q 4Q Full year
figures (Feb. 8)
Net sales 120,577 15,524 21,312 27,670 28,467 92,973 92,300
Operating
income
764 (3,020) (782) 1,092 156 (2,554) (2,600)
Recurring
income
406 (2,589) (561) 1,004 52 (2,094) (2,200)
Net income (685) (3,190) (788) 919 216 (2,843) (2,900)
Sales: Production recovered from the substantial decline due to COVID-19 after bottoming out in 1Q. Net sales in 4Q exceeded the level of 3Q due to the
booming aluminum market conditions while the sales volume decreased as some plants were affected by the production reduction of car manufacturers
chiefly due to a shortage of semiconductors.
Operating/Recurring income: Income stayed in the black after 3Q due to a sales recovery and improved earnings as a result of efforts to reduce costs and
improve productivity.
In 4Q, a decrease in sales volume due to a shortage of semiconductors and an increase in procurement costs due to a rise in aluminum prices affected
profits.
Net income: Returned to the black in 3Q.
2
Copyright Ⓒ2021 Ahresty Corporation. All Rights reserved.
Die Casting Business
(Million yen)
Year ended Year ended March 2021
March 2020 Released
Full year 1Q 2Q 3Q 4Q Full year
figures (Feb. 8)
Net sales 59,500 7,232 10,972 13,760 13,620 45,584 45,100
Japan
Segment
income/loss (444) (2,069) (650) 381 (153) (2,491) (2,600)
Net sales 30,633 4,742 3,868 6,262 6,756 21,628 21,500
North
America Segment
income/loss 635 (156) (167) 449 (32) 94 250
Net sales 23,846 2,257 5,346 5,738 6,590 19,931 20,000
Asia
Segment
income/loss 3 (995) 36 132 229 (598) (550)
* The Mexico Plant in the North America segment and two plants in China in the Asia segment settle their accounts in December.
Overseas sales ratio in the Die Casting Business:
Year ended March 2020: 47.8% ⇒ Year ended March 2021: 47.7%
* An explanation of the factors behind the changes in segment results begins on the next page.
3
Copyright Ⓒ2021 Ahresty Corporation. All Rights reserved.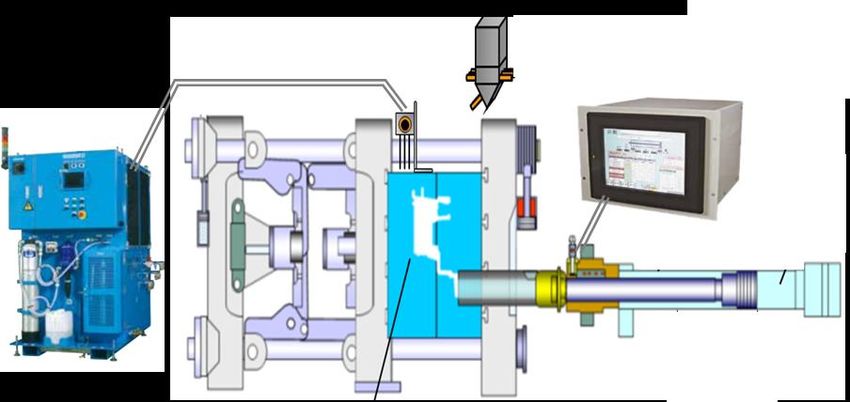
Die Casting in Japan
Changes in sales and segment income in Die Casting Business Factors behind change in sales (Million yen)
in Japan (Million yen)
20,000 2,000 59,500
Sales
Segment income/loss (1,213)
14,579 1,000 2,717
15,000 13,760 13,620 45,584
(13,689) (1,731)
10,972 381 0
10,000 (102) (153)
7,232 (650) (1,000)
5,000 FY19 Effect of Decrease in Cost Others FY20
(2,000) metal prices sales volume reduction,
product mix
(2,069)
0 (3,000) Factors behind change in segment income (Million yen)
18Q4 19Q1 19Q2 19Q3 19Q4 20Q1 20Q2 20Q3 20Q4
(444)
Sales: Decreased ¥13,910 million (down 23.4% year on year) 558
Sales volume recovered to the level of the previous year in 3Q but 3,370
(2,491)
decreased 11% in 4Q due to a shortage of semiconductors.
Segment income: Decreased ¥2,040 million (loss increased from previous
year)
(5,482)
4Q recorded a loss due to a decrease in sales volume. (493)
For the full year, the negative impact of the sales decrease on profit
performance was eased by promoting leaner production systems and FY19 Decrease in Increase in Decrease in Others FY20
other efforts to improve profitability. sales volume depreciation production
costs
4
Copyright Ⓒ2021 Ahresty Corporation. All Rights reserved.
Die Casting in North America
Changes in sales and segment income in Die Casting Business Factors behind change in sales (Million yen)
in North America (Million yen)
12,000 2,000
Sales 30,633
10,000 1,500
Segment income/loss (765)
8,000 1,000 222 21,628
7,016
6,635 6,262 6,756 (7,607) (564) (291)
6,000 449 500
58 99 4,742
3,868
4,000 0
94
(156) (167) FY19 Effect of Decrease Cost Effect of Others FY20
2,000 (500)
metal in sales reduction, exchange
prices volume product mix rates
0 (1,000)
18Q4 19Q1 19Q2 19Q3 19Q4 20Q1 20Q2 20Q3 20Q4
Factors behind change in segment income (Million yen)
Sales: Decreased ¥9,000 million (down 29.4% year on year)
The U.S. recovered in 2nd half from operation suspension in 1Q. In 4Q, 635
affected by the shortage of semiconductors, sales volume declined for some 2,830 158 94
customers.
Mexico recovered from lockdown in 2Q (April to June). 2nd half sales volume
was about the same level as in the previous year. Effect of PTU 124
Segment income: Decreased ¥540 million (down 85.1% year on year)
In the U.S., despite efforts to improve profitability by reducing labor costs, 485
etc., the decrease in sales volume in 1st half affected income.
In Mexico, income recovered along with the recovery in sales. A surplus was
(4,014)
recorded on a full-year basis. FY19 Decrease in Decrease in Decrease in Others FY20
For the entire segment, income declined from the previous year but sales volume depreciation production
maintained a surplus for the full year. costs
Fiscal year end: March in U.S.; December in Mexico
Exchange rate (FY19 FY20): U.S. dollar: ¥109.13 105.68; Mexican peso: ¥109.39 106.68
5
Copyright Ⓒ2021 Ahresty Corporation. All Rights reserved.
Die Casting in Asia
Changes in sales and segment income in Die Casting Business Factors behind change in sales (Million yen)
in Asia (Million yen)
10,000 1,500 23,846 177
Sales 19,931
Segment income/loss 1,000 (2,613) (528)
8,000 (816) (135)
6,306 5,795 5,738 6,590 500
222 5,346 229
6,000 101 132
36
0
4,000
2,257 (500) FY19 Effect of Decrease Cost Effect of Others FY20
metal in sales reduction, exchange
2,000 (1,000) prices volume product mix rates
(995)
0 (1,500) Factors behind change in segment income (Million yen)
18Q4 19Q1 19Q2 19Q3 19Q4 20Q1 20Q2 20Q3 20Q4
3
Sales: Decreased ¥3,910 million (down 16.4% year on year)
Related to dies, etc.
In China, sales volume in 2nd half exceeded the level of the previous 511
year, and recovered to nearly 90% of the previous year on a full-year
basis.
In India, sales volume increased from 1Q under a lockdown but is still
on its way to recovery with sales volume 17% lower year on year in
2nd half. (307)
(598)
Segment income: Decreased ¥600 million (down year on year) (799) (6)
China has posted profits since 2Q due to sales increase and FY19 Decrease in Increase in Decrease in Others FY20
improvement in productivity. sales volume depreciation production
costs
Fiscal year end: December in China; March in India
Exchange rate (FY19 FY20): Chinese yuan: ¥ 15.85 15.44; Indian rupee: ¥ 1.54 1.43 6
Copyright Ⓒ2021 Ahresty Corporation. All Rights reserved.
Aluminum Business and Proprietary Products Business
(Million yen)
Year ended Year ended March 2021
March 2020 Released
Full year 1Q 2Q 3Q 4Q Full year
figures (Feb. 8)
Net sales 3,993 646 748 1,018 1,071 3,483 3,500
Aluminum
Business Segment
income/loss 169 (41) 0 36 38 33 0
Proprietary Net sales 2,603 644 379 891 431 2,345 2,200
Products
Business Segment
income/loss 277 109 40 126 45 320 250
Aluminum Business
Sales: Sales recovered from the impact of COVID-19, reaching the same level as the previous year in 2nd half.
Segment income: Income declined in 1st half due to a significant decrease in sales but returned to the black in 3Q.
Proprietary Products Business
Sales: Sales decreased in 4Q due to a time lag in recording. For full year, sales exceeded the released forecast despite a year-on-year fall in orders for large
projects for clean rooms, etc.
Segment income: Achieved a greater profit than the previous year as a result of cost reduction efforts.
7
Copyright Ⓒ2021 Ahresty Corporation. All Rights reserved.
Improvement in Profitability in FY2020 on a Full-year Basis
       Due to a switch to leaner production systems under the Medium-term Management Plan from FY2019, the break-
       even point has fallen.
       For the full year of FY2020, in addition to the reduction of fixed costs, higher productivity improved the variable cost
       rate.

                       Changes in break-even point from FY2019 to FY2020
                                                                           Break-even point: Fell
                                                                           Though partly affected by the decrease in sales, the break-even point has fallen
                         FY2019 result                                     (improved) due to improved productivity and reduced fixed costs.
Profits and costs

                        FY2020 result     Break-even
                                             point       FY19
                                                                           Variable cost rate: Improved 3 percentage points
                                                                           • Productivity improved due to the stabilization of injection and utility operations.
                                                                           • Incorporated inspection in casting processes, promoted automation and other
                                                                             measures
                                                                           • Reduced outsourcing cost by incorporating finishing operations in in-house
                                         FY20                                processes

                    Further efforts to                                     Fixed costs: Reduced by approx. 5,700 million yen
                     lower the BEP                                         (of which 1,100 million is associated with COVID-19)
                                                                           • Reduced labor costs by revising the production system
                                                                           • Lowered depreciation and amortization by the reduction of investments
                                                                           • Reduced travel expenses by introducing teleworking, etc.

                                          Added value

                                                                                            8
                                                                                                                                  Copyright Ⓒ2021 Ahresty Corporation. All Rights reserved.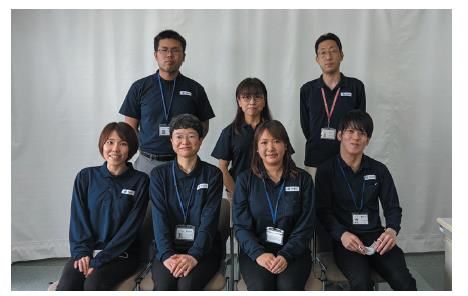
Financial Performance in the Year Ended March 2021
In FY2020, with a decrease in operating CF, reduced investment CF to prevent outflow.
Cash and deposits on hand increased and interest-bearing debt reached ¥45.9 billion (net interest-bearing debt
increased ¥4.1 billion from previous year to ¥33.6 billion)
Equity ratio was 41.9%.
   (Billion yen)                                 Operating cash flow       (Billion yen)                          Cash and deposits
                                                                                                                  Net interest-bearing debt    (%)
  25.0                                           Free cash flow            50.0                                   Equity ratio                  50.0
                      21.7                                                                                                              45.9
                                                                                     42.4
  20.0                                                                                                                                           45.0
            18.0                                                           40.0
                                16.9      16.0       16.4                                                                    33.6              41.9
                                                                                              32.8       31.5      30.7                          40.0
  15.0
                                                                           30.0
  10.0                                                                                                                                           35.0
                                                                  7.9
                                                                           20.0
   5.0                                                                                                                                           30.0

                                                                           10.0
   0.0                                                             (3.6)                                                                         25.0

  (5.0)                                                                     0.0                                                                  20.0
           2015       2016      2017      2018       2019         2020               2015      2016      2017      2018      2019       2020

          * Free cash flow (FCF) = operating CF - investment CF                     * Net interest-bearing debt = interest-bearing debt - cash and deposits

                                                                           9
                                                                                                            Copyright Ⓒ2021 Ahresty Corporation. All Rights reserved.
Full-year Plan for Year Ending March 2022
(Million yen)
Year ending March 2022 (plan)
Year ended March 2021
Full year 1st half 2nd half
Net sales 92,973 110,000 - 52,300 57,700
Operating income (2,554) 1,800 1.6% (750) 2,550
Recurring income (2,094) 1,600 1.5% (850) 2,450
Net income (2,843) 600 0.5% (1,000) 1,600
Factors behind change in sales (Million yen) Factors behind change in operating income (Million yen)
Effect of PTU:
80 Approx. 200
16,400 110,000 2,200
(300)
5,300 (4,400)
92,973 4,200 100 (600) 1,800
(1,500)
Effect of revisions to accounting
standards (Japan): Decrease of
approx. 4,300
(2,554)
2020 Increase in Decrease in Decrease in Transfer of Others 2021
2020 Effect of Increase in Cost Effect of Others 2021 sales volume depreciation production extraordinary
metal sales reduction, exchange costs losses for
prices volume product mix rates FY2020
Actual foreign exchange rates (full-year average): USD: ¥105.68; Mexican peso: ¥106.68; Chinese yuan: ¥15.44; Indian rupee: ¥ 1.43 Exchange rate assumptions in plan: USD: ¥105.00; Chinese yuan: ¥15.0; Indian rupee: ¥ 1.45
10
Copyright Ⓒ2021 Ahresty Corporation. All Rights reserved.External Factors for Full-year Plan for Year Ending March 2022
Decrease in car production due to shortage of
semiconductors
Rise in aluminum prices
[Factors] [Impacts]
Booming demand for semiconductors for 5G smartphones,
game machines, personal computers, and data centers Soaring aluminum prices (due to automobile demand in
Sharp rise in automobile demand in China after their early China, etc.)
recovery from COVID-19 Selling prices reflect demand every three months,
Impact of fires at semiconductor plants affecting profits in the short term.
[Aluminum market trends]
[Impacts] (USD/t) LME aluminum
2,400
Reduction in automobile production
2,200
2,000
G l o b a l s a l e s we i g h t o f A h r e s t y
1,800
1,600
1,400
1,200
1,000
19/1 3 5 7 9 11 20/1 3 5 7 9 11 21/1 3
FY2019 1H FY2019 2H FY2020 1H FY2020 2H FY2021 1H (Plan) FY2021 2H (Plan) (Year, month)
Impacts of the shortage of semiconductors and the rise in aluminum prices are incorporated in the 1st half plan.
11
Copyright Ⓒ2021 Ahresty Corporation. All Rights reserved.Trends in Capital Investment, Depreciation and Amortization
FY2020 result and FY2021 plan
Amount of capital investment: FY2020 result was ¥7.5 billion in comparison to ¥11.9 billion in plan.
For FY2021, ¥12.8 billion is planned (60% in capacity increase, of which 30% is for products for electric vehicles).
Investments: Continued efficient investments by making effective use of internal equipment. Investments will be
similarly controlled in FY2021 plan.
Depreciation and amortization: FY2021 plan is ¥13.1 billion (the same level as previous year).
Amount of capital investment (Billion yen) Amount of depreciation and amortization (Billion yen)
20.0 20.0 Other than dies
Other than dies
Dies
16.0
14.9
15.0 13.8 15.0 14.3
12.8 12.9 13.1
11.0 10.5
10.4
10.0 10.0 9.8 9.6
7.5 9.4 10.1
5.0 5.0
5.1 5.6 4.7 3.5 3.0
0.0 0.0
2017 2018 2019 2020 2021 2017 2018 2019 2020 2021
* Starting from FY2021, due to a change in the method of (Plan) * Starting from FY2021, due to a change in the method of (Plan)
asset recording for dies, the amount of capital investment asset recording for dies, amortization of some dies is not
excludes the amount for dies. included.
12
Copyright Ⓒ2021 Ahresty Corporation. All Rights reserved.Global Sales in Weight
Sales weight is on a recovery trend. FY2022 is expected to exceed the level of FY2019,
including new orders received.
Global
FY2018 FY2019 FY2020 FY2021 (Plan) FY2022 (Plan) FY2023 (Plan)
13
Copyright Ⓒ2021 Ahresty Corporation. All Rights reserved.Dividends
We will work to ensure a sustainable return of profits, taking into consideration medium- and long-term
corporate growth and the payout ratio.
In FY2020, resumed year-end dividend payment of 5 yen in view of the recovery in performance in the 2nd half.
For FY2021, annual dividend of 10 yen is planned.
Year ending
Year ended
Dividend per share March 2022
March 2021
Forecast
Structure
enhancement
(Annual total) 5 10 Improving productivity (OPCC)
Promoting leaner production systems
Creating cash
Interim dividend 0 5 flows
Business
strategies Return to
Growth in electrification market
Year-end dividend 5 5 shareholders
Dividends, stock
Net income per share buybacks, etc.
(111.06) 23.44
(consolidated) Efficient
investments, etc. Managing cash
Effective use of existing equipment flows
Phased investment, appropriate
Dividend payout ratio inventory levels
- 42.7%
(consolidated)
14
Copyright Ⓒ2021 Ahresty Corporation. All Rights reserved.Our Efforts in the Medium-Term
Management Plan
15
Copyright Ⓒ2021 Ahresty Corporation. All Rights reserved.Implement business strategies with an eye
on the future automotive market
Enhance earnings strength by improving
productivity and quality
Develop an environment that underpins sustainable
corporate growth
16
Copyright Ⓒ2021 Ahresty Corporation. All Rights reserved.Models with our products
ICE LEVORG (SUBARU) 2 parts for engines
ICE N-BOX, N-ONE, N-WGN (HONDA) Transmission parts
HEV YARIS, YARIS CROSS (TOYOTA) 2 parts for engines
HEV VEZEL (HONDA) 9 parts for transmissions/electric vehicles
HEV FIT (HONDA) 7 parts for transmissions/electric vehicles
PHEV ECLIPSE CROSS (MITSUBISHI) 2 parts for engines, etc.
PHEV RAV4 PHV (TOYOTA) 2 parts for electric vehicles
EV MUSTANG MACH-E (FORD) 1 part for electric vehicles
FCV CLARITY (HONDA) 2 parts for electric vehicles
FCV MIRAI (TOYOTA) Parts for electric vehicles/FC systems
Toyota YARIS, the 2021 European Car of the Year
17
Copyright Ⓒ2021 Ahresty Corporation. All Rights reserved.Responding to Customer Needs by Taking Advantage of
Multi-location Operation
Expanding the “product
axis”
Obtain orders for parts for electric
vehicles in multiple locations by
leveraging existing strong points
Parts for HEVs
and EVs Expand the market by
leveraging our strong points
• Experience of mass production of
European OEM products requiring high
[Advantages, evaluation points] precision (Guangzhou)
• Proposing and receiving orders for the
After development and market launch in Japan, the same products as Guangzhou (Mexico)
same products of the same quality can be launched • Promoting localization of development
smoothly at global sites.
Parts for MHEVs Expanding the “customer
Establishing the position as a global partner of foreign customers axis”
18
Copyright Ⓒ2021 Ahresty Corporation. All Rights reserved.Changes in Customer Portfolio due to Adaptation to
Electric Vehicles
Reinforcement of customer base × Parts strategy (adaptation to electric vehicles)
resulting in changes in customer portfolio
• Play a role in the strategy as a partner for existing customers (reinforcement of customer base)
• Promote our sales activities to achieve growth in tandem with our customers’ adaptation to electric vehicles
Other Company Other Company Other Company
Company A A
E
H Company Company
Company H G
G Company Company
G F
Company
Company FY2020 FY2022 B FY2025
Company Company Company
F (Result) B F (Plan) H
(Forecast) Company
B
Company Company
Company D
E
D Company
Company C Company
Company Company Company
C A
D E C
* The pie charts show global customer shares in net sales.
* Electric vehicles: EVs, HEVs, PHEVs and FCVs
19
Copyright Ⓒ2021 Ahresty Corporation. All Rights reserved.Changes in Product Portfolio in the Future
Share of parts for electric vehicles in net sales Products planned to be launched (except successor
models)
FY2020: 11% FY2025: approx. 30% For FY2022, 13 products of a total of 19 products are
for electric vehicles.
FY2020 FY2022 FY2025
(Result) (Plan) (Forecast)
FY2020 FY2021 FY2022
Japan
For electric For electric For electric
vehicles: 11% vehicles: 17% vehicles: 30%
North America
Asia
Total
* is for electric vehicles and is for ICEs (products for both are counted as for electric vehicles)
* Electric vehicles: EVs, HEVs, PHEVs and FCVs
20
Copyright Ⓒ2021 Ahresty Corporation. All Rights reserved.Enhancing Non-automotive Fields
Proprietary Products Business (MOVAFLOR)
Expand sales in China and other Asian markets while maintaining the share in Japan
Major FY2020 results in Japan: Approx. 60,000 sheets/20,000 m2 for a major semiconductor manufacturer, etc.
In FY2020, installed approx. 50,000 sheets/17,000 m2 in China, one of the largest scale orders received in China.
To expand sales channels, developed two new high-strength, high-performance models for clean rooms and data
centers in consideration of Chinese market standards.
Sales began in the Chinese market in April 2021.
No. 1 share for clean rooms in Japan! (50.2%)
Kinki Hokkaido
151,790 929
Tohoku
49,078
Chubu
Chugoku 45,357
Kyushu 28,098
11,037 * 500 m2 or more per contract
(From April 2013 to March 2021)
Kanto
Shikoku Tokyo 62,253
2,430 34,371
21
Copyright Ⓒ2021 Ahresty Corporation. All Rights reserved.Implement business strategies with an eye
on the future automotive market
Enhance earnings strength by improving
productivity and quality
Develop an environment that underpins sustainable
corporate growth
22
Copyright Ⓒ2021 Ahresty Corporation. All Rights reserved.Status of Promoting Leaner Production Systems
(Persons) (Persons)
Earnings per hour 4,000 Changes in personnel 8,000
(Index) Non-production personnel
130 3,500 (left scale) 7,500
Total (right scale)
120 3,000 7,000
110 2,500 6,500
100 2,000 6,000
90 1,500 5,500
80 1,000 5,000
70 500 4,500
60
0 4,000
19/7-9 19/10-12 20/1-3 20/4-6 20/7-9 20/10-12 21/1-3
17/3 17/9 18/3 18/9 19/3 19/9 20/3 20/9 21/3
As a result of promoting leaner production systems, earnings per hour In non-production departments in plants, personnel decreased through
improved from the previous year. transfer, efforts to improve efficiency, etc.
Affected by a decrease in sales volume at some plants from Jan. to • Integration of functions of non-production operations among plants
March 2021 • Use of web conferencing and revision of work to improve efficiency
* Earnings per hour = Net sales less direct costs (raw material costs, etc.) / Total hours worked by production personnel at plants
23
Copyright Ⓒ2021 Ahresty Corporation. All Rights reserved.Enhance Earnings Strength (lean production systems)
Improve earnings per hour to enhance profitability
Increase the number of production equipment units per operator in charge by work improvement and layout change.
Reduce intermediate inventory by 40 to 50% by shortening work flows for casting, finishing and machining.
Encourage competition over Kaizen of “karakuri” mechanisms to enhance the creativity of the shop floor
Review operations in non-production departments and introduce IT to improve efficiency and reduce manpower
24
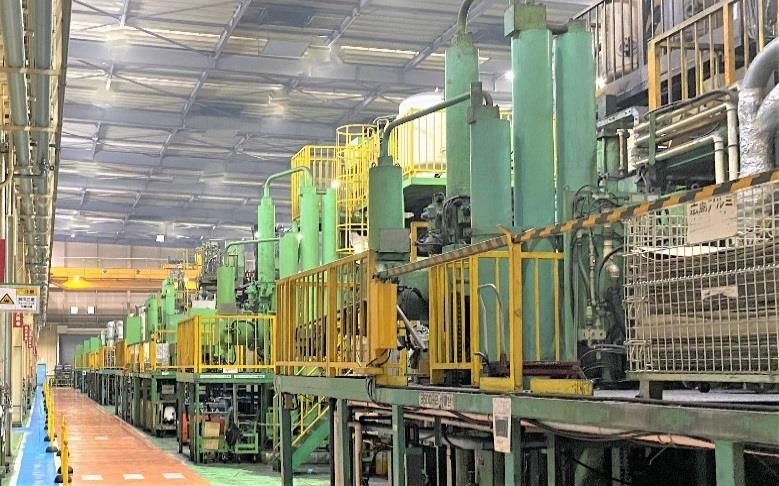
Copyright Ⓒ2021 Ahresty Corporation. All Rights reserved.Enhance Earnings Strength (production technologies)
Continuously improve quality and productivity by utilizing measuring instruments produced within
the Ahresty Group Setting optimal manufacturing conditions by
Manufacturing using the statistical QC method
conditions Quality data
Monitoring of casting
Measuring and Reading product ID conditions Allocation
Experiment
order
recording of Traceability system
manufacturing Quality of cast parts
parameters Data record
Stamping product ID
OPCC (Optimal Process Condition Control)
Management of optimal manufacturing Element
conditions for good products Group 1 Group 2 Group 3
Injection monitor
(Injection management
equipment) OPCC improvement effects - Improvement of
post-process defect rates
Post-process defects:
Defects that occur due to
errors in processing such
as porosity or leakage
(98.1%)
Sep. Oct. Nov. Dec. Jan. Feb. Mar. Apr. May Jun. Jul.
Jet Cool System
(Local cooling system)
25
Copyright Ⓒ2021 Ahresty Corporation. All Rights reserved.Feedback from Customers
Major awards in FY2020
SUBARU Corporation “Quality Production Cooperation Award” “Excellent Quality
Award”
Toyota Motor Corporation “Letter of Appreciation for Quality Control Activities”
Nissan Motor Co., Ltd. “Appreciation for Superior Quality”
Toyota Kirloskar Motor India
Awarded in three segments: • ZERO Defects • Quality • Delivery
Suzuki Motor Corporation “Overseas Contribution Award” for the 3rd consecutive
year
JATCO Mexico, S.A. de C.V. “Best Performance Award” for the 3rd consecutive
year
Isuzu Motors Limited “Quality Excellence Award”
Mitsubishi Motors Corporation “Cost Excellence Award”
Yamada Manufacturing Co., Ltd. “Excellence Appreciation Award”
26
Copyright Ⓒ2021 Ahresty Corporation. All Rights reserved.Enhance Earnings Strength
(evolution of production technologies)
Use of IoT technologies at production sites
Design and
Visualize data in manufacturing processes to clarify manufacturing Casting Deburring Machining
Assembly
inspection
Shipping
of dies
problems and solve them, thereby contributing to
improvement in productivity and quality, and reduction Safety and work education
of costs
Designing dies Process control Collecting sensing data Quality inspection
Production preparation Reducing suspension loss Linking manufacturing Introducing robots and AI to
using 3D simulation by visualizing operation conditions and quality to reduce variations in quality
status reduce the defect rate and reduce manpower
Fluidity analysis Operation monitor Injection monitor Automatic appearance inspection
27
Copyright Ⓒ2021 Ahresty Corporation. All Rights reserved.Technology Development for the Future
Ahresty’s “technology roadmap”
Contributing to weight reduction and
Themes for creating demand performance improvement of vehicles
Benchmark
Weight reduction technology
Customer
demand
Alloy development
Heat treatment elimination technology Thermal management materials
Technology roadmap
Bonding technology
Engine and
transmission
Body and suspension-related parts
parts Parts for electric vehicles
information
Themes for improving productivity Improving price competitiveness
Industry
OPCC Measuring technology Use of AI
Technology to improve productivity Technology to reduce man-hours for processing
CAE technology
Environmental
regulations Technology to reduce die costs
Alloy recycling technology Energy conservation technology Automation technology
28
Copyright Ⓒ2021 Ahresty Corporation. All Rights reserved.Implement business strategies with an eye
on the future automotive market
Enhance earnings strength by improving
productivity and quality
Develop an environment that underpins sustainable
corporate growth
29
Copyright Ⓒ2021 Ahresty Corporation. All Rights reserved.Development of Human Resources Prepared for the Era
of Transformation
Identify desirable personalities and abilities, and formulate a long-term development plan (roadmap)
for strategic hiring and training
2018 2019 2040
Human resources portfolio for the future
Fields (techniques, skills), capacity, number of persons
• Changes in external
Human resources roadmap environment
Human resources
portfolio in the past Strategic hiring and training • Expansion of
Fields (techniques, skills),
capacity, number of persons
business scale
• Changes in business
Regular recruitment, models
promotion, education
Headquarters roadmap (10 plans) + Roadmap formulated/operated by each company
E.g.: Roadmap for next-generation managers and global skilled workers
E.g.: Technology seminars focusing specially on electrification-related themes, such as CASE and electric vehicles
In FY2020, 258 people (129 in Japan and 129 overseas) participated in the seminars.
30
Copyright Ⓒ2021 Ahresty Corporation. All Rights reserved.Creating a Comfortable Workplace
Establishing a safe environment with a lighter workload
Industrial accidents
(Cases) (Rate: %)
60 6.0
Number of accidents involving lost working
time + those not involving lost working time at
Improving operations with a heavy workload 50 Ahresty
Ratio of accidents involving lost working time
5.0
FY2020: 264 cases and those that did not at Ahresty
40 4.0
Ratio of accidents involving lost working time
and those that did not in the aluminum
Improving the sensory temperature in
industry
30 3.0
summer and winter
20 2.0
• Below 28°C in summer, 10°C or above in winter
10 1.0
Improving noise 0 0.0
• Achieving improvement after conducting 2011 2012 2013 2014 2015 2016 2017 2018 2019 2020
improvement simulation based on analysis of noise
* Rate = Number of accidents × 1,000,000 / Total working hours
waveform data
E.g.: Noise of hammering, noise of air blow * Source: Japan Aluminium Association “Cases of Industrial Accidents”
“Results of Statistical Survey on Industrial Accidents for December 2020”
31
Copyright Ⓒ2021 Ahresty Corporation. All Rights reserved.ESG/SDGs
32
Copyright Ⓒ2021 Ahresty Corporation. All Rights reserved.Actions to Improve Corporate Governance
Replace the chairperson of the Nomination and Compensation Committee
with an Independent Director
Improving transparency and objectivity in appointing directors and deciding their compensations
History of corporate governance reforms
Discuss “requirements for directors” at the Nomination and
2021
Compensation Committee Replaced the chairperson of the
Confirming sufficiency of specialized fields held by the Board of Directors by Nomination and Compensation
using the skill matrix Committee with an Independent Director
Continue to conduct effectiveness evaluation of the Board of Directors 2019
Since the introduction in 2018 (questionnaire survey), confirming the tasks and the status of Nomination and Compensation
Committee started working
improvement
Corporate Governance
Code revised|2018 2018
Restricted stock compensation plan introduced
Evaluation of the effectiveness of the Board of
Directors (questionnaire survey) introduced
Corporate Governance
Code formulated|2015 2016
Enhancement of governance in line with the Corporate
Stewardship Code
Governance Code
formulated|2014
2015
Became a company with an Audit and
Supervisory Committee
33
Copyright Ⓒ2021 Ahresty Corporation. All Rights reserved.Promoting Diversity & Inclusion
Promote the establishment of an environment in which employees feel comfortable taking
maternity and childcare leave
Percentage of female employees taking maternity leave before
and after childbirth and childcare leave: 100%
Male employees are also encouraged to take childcare leave.
Create a workplace in which diverse people work
Established Ahresty Inclusive Service Corporation, a shared service
company in charge of personnel and labor affairs, such as salary
calculation, retirement benefits, and corporate pension (October 1, 2020)
All staff members, including six handicapped employees, play active
roles appropriate for their respective aptitudes.
* They took off their masks for a short time only for the photo-taking.
34
Copyright Ⓒ2021 Ahresty Corporation. All Rights reserved.Efforts to Achieve SDGs
KPIs for priority tasks
Vision for 2030
Increase the share of parts for electric vehicles in 2030 Indicators for measured values (KPIs)
Providing parts for electric vehicles (EVs, HEVs,
PHEVs, and FCVs)
Improve the energy
Contributing to
consumption efficiency of Among them, providing parts for ZEVs (EVs and
electrification and
vehicles by providing aluminum FCVs)
weight reduction
die-cast products
Providing body and suspension-related parts
Vision for 2030
Improve energy efficiency in production processes Indicators for measured values (KPIs)
Reduction of Promoting energy conservation measures
energy
Reduce the use of fossil fuels by consumption Promoting improvements in productivity
improving energy efficiency, etc.
Use of renewable energy and energy that generates
Energy conversion
less CO2
35
Copyright Ⓒ2021 Ahresty Corporation. All Rights reserved.Environment and Aluminum Die Casting Business
Emits little CO2 during production Light
CO2 emissions per 1 kg of material
Approx. one-third the weight of iron (about a half in
terms of products)
By reducing weight, the energy consumption
Approx. 3% efficiency of vehicles can be improved, contributing
to the reduction of CO2 emissions
About
1/7
Steel Aluminum new Aluminum
Recyclable multiple times
ingot recycling
Over 90% of raw materials for die casting are
recycled metals
We brighten our planet’s future with our lightweight technology.
* The graph was prepared by Ahresty based on data of the Japan Aluminium Association, etc.
36
Copyright Ⓒ2021 Ahresty Corporation. All Rights reserved.2040 Vision
37
Copyright Ⓒ2021 Ahresty Corporation. All Rights reserved.Vision 2040
Winning absolute Vision 2040 “Our Goal”
customers’ trust 2025
We brighten
our planet’s
CASE future with our
lightweight
Globalization technology,
Beyond your ensure your
expectations satisfaction
with Ahresty,
Diversity 2040
and develop
pioneering
technology
SDGs through
ESG continuous
research.
Global environment 22-24 Medium-Term
Carbon-neutral New 10-year Long-term Business Plan Management Plan
38
Copyright Ⓒ2021 Ahresty Corporation. All Rights reserved.Contact for inquiries about this document and the Company’s IR:
Management Planning Section, Management Planning Department, Ahresty Corporation
Phone: +81-3-6369-8664
E-mail: ahresty_MP0_IR@ahresty.com
URL: https://www.ahresty.co.jp
This document and what has been said in the results briefing include forecasts that the Company has made based on data available when the document was prepared. Actual results could be different from the forecasts for a
range of reasons.
Copyright Ⓒ2021 Ahresty Corporation. All Rights reserved.You can also read