FY17 Results - DIA Corporate
←
→
Page content transcription
If your browser does not render page correctly, please read the page content below
FY17 Results
Legal disclaimer
        This document does not constitute or form part of any purchase, sales or Exchange offer, nor is it an invitation to draw up a purchase sales or exchange offer, or advice on any stock
 issued by Distribuidora Internacional de Alimentación, S.A. (“DIA” or the “Company”). Nor shall this document or any part of it form part of any offer for sale or solicitation of any offer to buy
 any securities the basis of or be relied on in connection with any contract or commitment to purchase shares.
        DIA cautions that this document contains forward-looking statements and information relating to DIA and include, without limitation, estimates, projections or forecast relating to
 possible future trends and performance of DIA that are based on the beliefs of its management as well as assumptions made and information currently available to the Company.
        Such statements reflect the current views of the Company with respect to future events and are subject to risks, uncertainties and assumptions about the Company and its
 subsidiaries, including, among other things. In light of these risks, uncertainties and assumptions, the events or circumstances referred to in the forward-looking statements may not occur.
 None of the future projections, expectations, estimates, guidance or prospects in this presentation should be taken as forecasts or promises nor should they be taken as implying any
 indication, assurance or guarantee that the assumptions on which such future projections, expectations, estimates, guidance or prospects have been prepared are correct or exhaustive or,
 in the case of the assumptions, fully stated in the presentation.
        These forward looking statements speak only as of the date on which they are made and the information, knowledge and views available on the date on which they are made; such
 knowledge, information and views may change at any time. Forward-looking statements may be identified by words such as “expects”, “anticipates”, “forecasts”, “estimates” and similar
 expressions. Current and future analysts, brokers and investors must operate only on the basis of their own judgment taking into account this disclaimer, as to the merits or the suitability
 of the securities for its purpose and only on such information as is contained in such public information having taken all such professional or other advice as its considers necessary or
 appropriate in the circumstances and not reliance on the information contained in the presentation. In making this presentation available, DIA gives no advice and makes no
 recommendation to buy, shell or otherwise deal in shares in DIA or in any other securities or investments whatsoever.
        These analysts, brokers and investors must bear in mind that these estimates, projections and forecasts do not imply any guarantee of DIA´s future performance and results, price,
 margins, exchange rates, or other events, which are subject to risks, uncertainties and other factors beyond DIA´s control, such that the future results and the real performance could differ
 substantially from these forecasts, projections and estimates.
        The risks and uncertainties which could affect the information provided and very difficult to anticipate and predict. DIA does not assume the obligation of publicly reviewing or
 updating these statements in case unforeseen changes or events occur which could affect these statements. DIA provides information on these and other factors which could affect the
 business and the results in the documents it presents to the CNMV (Comisión Nacional de Mercado de Valores) in Spain.
 Accordingly, these estimates, projections and forecast must not be taken as a guarantee of future results, and the directors or managers are not responsible for any possible deviation
 which could arise in terms of the different factors which influence the future performance of the company.
        None of the Company nor any of its employees, officers, directors, advisers, representatives, agents or affiliates shall have any liability whatsoever (in negligence or otherwise,
 whether direct or indirect, in contract, tort or otherwise) for any loss howsoever arising from any use of this document or its contents or otherwise arising in connection with this document.
        Certain information contained in this presentation is based on management accounts and estimates of the Company and has not been audited or reviewed by the Company’s
 auditors. Recipients should not place undue reliance on this information.
        This presentation includes certain non-IFRS financial measures or expressions (Gross Sales Under Banner, comparable growth of Gross Sales Under Banner, adjusted EBITDA,
 adjusted EBIT, etc.) which have not been subject to a financial audit for any period.
        The information contained in this presentation does not constitute investment, legal, accounting, regulatory, taxation or other advice and the information does not take into account
 your investment objectives or legal, accounting, regulatory, taxation or financial situation or particular needs. You are solely responsible for forming your own opinions and conclusions on
 such matters and the market and for making your own independent assessment of the information. You are solely responsible for seeking independent professional advice in relation to the
 information contained herein and any action taken on the basis of the information contained herein. No responsibility or liability is accepted by any person for any of the information or for
 any action taken by you or any of your officers, employees, agents or associates on the basis of such information.
                                                                                                                                                                                               /2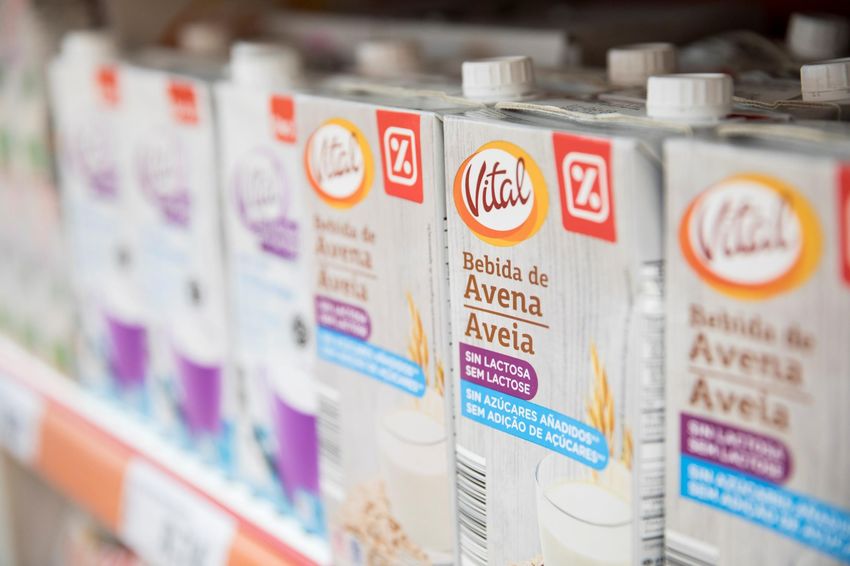
Agenda

   Highlights                       4

   Financial review             9

   Business review         24

   Appendix           43

                                        /3
01
Highlights

             /4
Full year 2017 highlights
                       +1.5%
                  Gross Sales
                 Under Banner1
                                   Achieved sales recovery in Q4 2017 and positive
                       +3.4%       LFL at year-end in every segment
                        LFL1,2

                                   Results affected by higher investments to
              EUR569m              secure Dia Spain’s strategic price leadership in a
                  Adj. EBITDA
                 -8.9% vs 20161    highly competitive environment

               EUR207m
                        CFO        Cash generation remained strong with stable net
                       1.6X        debt and a sound financial position
                  Net debt/ adj.
                    EBITDA
1 Ex-FX
2 Ex-calendar effect                                                                    /5
LFL1 growth in both segments in Q4 2017

                              0.8%
                                      1.2%            1.1%
  Iberia

                                              -1.5%

                                      10.7%
                              10.1%
                                                      8.3%
                                              6.1%
  Emerging
  Markets

                               Q1      Q2      Q3      Q4

1 Ex-FX and calendar effect                                  /6
Performance reflects the effort to face the difficult context
                    October Outlook               2017 results1
                    ▪ Low-single-digit increase   ▪ +1.5% increase
     Gross Sales                                  ▪ 3.4% LFL, strong recovery in
     Under Banner                                   Q4 2017

                    ▪ Mid-single-digit decrease   ▪ Adjusted EBITDA -8.9% vs 2016
     Adjusted                                     ▪ Targets achieved in all formats
     EBITDA                                         except for Dia Spain

                    ▪ EUR300m                     ▪ EUR302m
     Capex

                    ▪ Increase in CFO             ▪ EUR207m CFO below 2016 levels
     CFO

1 Ex-FX                                                                               /7
Actions taken in 2017 set a strong foundation for 2018

       ▪    Strengthened price advantage in Iberia with good traction for 2018
       ▪    Optimized space from last acquisitions and developed upgraded concepts for
            our 3 formats; Dia, Clarel and La Plaza
       ▪    Prepared ground to resume growth in Iberia, organically and inorganically
       ▪    Reached 10% online market share1, consolidating our position as one of the
            market leaders
       ▪    Continued expansion in Emerging Markets with simultaneous gains of
            market share and margin

1 December 2017, Spain
SOURCE: Nielsen                                                                          /8
02
Financial
   review

            /9
DIA FY 2017 summary
EURm
                                                                          Change
              Business performance             2016     2017     Change   (ex-FX)
              Gross Sales Under Banner         10,314   10,334   +0.2%    +1.5%
              ▪ LFL1 2                         8.7%     3.4%
              ▪ Space contribution to sales2   1.5%     -1.4%
              Adjusted EBITDA                  627.9    568.6    -9.4%    -8.9%
              Adjusted EBIT                    401.2    336.6    -16.1%   -15.2%
              Underlying EPS (EUR)             0.44     0.35     -19.0%   -19.0%

                                                                          Change
              IFRS measures                    2016     2017     Change   (ex-FX)
              Net Sales                        8,669    8,621    -0.6%    +0.6%
              Operating income (EBIT)          309.5    247.1    -20.2%   -19.5%
              Basic EPS (EUR)                  0.28     0.18     -36.9%   -38.2%

1 Ex-calendar effect
2 Ex-FX                                                                             / 10
In Iberia, we are undergoing a transition in a challenging
context
EURm
2017 Margin investment to secure
price leadership strategy
Gross Sales Under Banner 6,590 in a highly competitive
environment
LFL1 +0.3% Efficiency improvement
through digitization
Space contribution to sales1 -3.0%
Footprint optimization and
remodeling after last years’
Adjusted EBITDA acquisitions
426
Controlled Capex and
Adjusted EBITDA margin expansion in preparation
7.7%
for 2018-19 format renewal
1 Ex-calendar effect / 11In Spain, we secured our strategic price leadership and
recovered LFL growth
Price competitiveness variation
Investment to
recover 230 bps
+120 bps in price
competitiveness
230 bps
LFL improvement
of +2.6 p.p. in
-110 bps Q4 2017 achieving
positive LFL in 2017
H1 2017 vs H1 2016 H2 2017 vs H2 2016
Note: Dia banner competitiveness measured as a price difference vs key competitor
/ 122017 saw space contraction due to a revision of acquired
space
Acquisitions
Organic
Store selling area evolution in Iberia
000’s sqm 389
167 Review of
Openings 317 110 space
44 65 71 45 34 acquired
72 57 completed
in 2017
-20 -31 -20 -34 (affecting
-54
Closures1 -113 -106 ~30% of
stores)
2011 2012 2013 2014 2015 2016 2017
Ready to
resume
Space CAGR 2.5% 5.0% organic net
2010-13 2013-17 growth in
2018
1 Also includes sales area modification
NOTE: Excludes Clarel / 13We are improving stores’ value proposition through
ambitious remodeling plans
New light modular remodellings
Dia and La Plaza store remodellings in Iberia
Lean Capex with Stores accounting
880
for ~50% sales1
modular
remodelled during
remodelings H1 2018
410
Double-
digit NPS 322
291
Growing market increase 210
470
of value food 90
solutions 120
Single-digit H1 H2 H1 H2
sales
improvement 2017 2018E
1 Dia and La Plaza sales in Spain / 14We continue to work on efficiency in our Iberian
operations beyond space contraction
Alliances and
supplier
-6.6% -6.5% negotiations
contributed to
Total labor cost Total other
reduction vs 2016 operating costs
capture ~50bps
reduction vs 2016 in 2017 (+50 bps
expected in 2018)
/ 15In Emerging Markets, we continued our successful
performance
EURm
2017
Gross Sales Under Banner 3,745 Achieved significant LFL
growth despite deflation in
Brazil
LFL1 +8.6%
Continued market share
gains (0.4 p.p. in Argentina
Space contribution to sales1 +2.4% and 0.6 p.p. in Brazil)
Sustained EBITDA margin
Adjusted EBITDA 142 improvement (+45 bps in
2017)
Adjusted EBITDA margin 4.6%
1 Ex-FX and calendar effect / 16Space expansion continued despite the macro context
Argentina
Brazil
Footprint evolution
000’s sqm 720 741
651
591 251
239 Footprint expansion
231 in Emerging Markets
204
to recover
double-digit sales
growth
481 490
387 420
On track to reach
objective of 2,600
2014 2015 2016 2017 stores in 2020
# of 724 846 872 930
stores 799 929 1,050 1,115
/ 17We steadily improved market shares and adjusted
EBITDA margin in Argentina and Brazil
%
12.6 13.7 14.1
8.8
Market 7.8
6.9 7.2
share
5.5
4.6
3.8 4.1
Adjusted
EBITDA 3.0
margin
2011 2015 2016 2017
Source: Nielsen for market share (food retail organized maket) / 18Cash flow generation in 2017 remained strong
EURm
Adj. EBITDA
569 Capex1
Cash From Operations2
Other
Cash items
302 207
60
1 Adjusted by discontinuation of DIA China; 2 Defined as adjusted EBITDA less ‘Other cash items’ less Capex on an organic basis / 19More than EUR1bn returned to shareholders since listing
ROI Dividend proposal Total remuneration
to shareholders since
18.1% EUR0.18 listing
vs. sector’s 11.9%1 50.7% dividend payout
vs sector’s 49.5%1 EUR1,045m
2016 2016
19.4% EUR0.21
1 2016 data, Carrefour, Casino, Jeronimo Martins, Metro, Morrison, Sainsbury, Sonae, & Tesco
ROI formula: Adj. operating income (EBITDAR) / Avg. invested capital
Avg. invested capital = Avg total assets exc cash + Avg D&A - Avg account payables – Avg accrued liabilities + x5 Rent adjustment / 20Sound balance sheet with comfortable leverage ratios
EURm Net debt
1,132 878 891
Stable net debt and
leverage ratios support
investment grade
2015 2016 2017
Stable net debt leverage ratios Liquidity available in
1.8x excess of
1.4x 1.6x1
EUR1.1bn3
3.5x 3.4x 3.6x2
Avg. debt maturity of
3.7 years
2.5x 2.0x 2.2x2
1.26% average cost
2015 2016 2017
of funding in euros
(12 bps down vs 2016)
1 DIA Adj. EBITDA/Net debt; 2 Company estimate according to specific credit rating methodology; Moody’s Baa3; stable outlook; S&P BBB- and stable outlook; 3 As of 31/12/2017 / 212018 financial outlook
Iberia Group objectives
▪ Top-line growth with positive ▪ Continued efficiency
LFL throughout the year improvement
▪ Adjusted EBITDA growth in ▪ CFO double-digit growth
Iberia
▪ Capex aligned with 3.5-4%
Emerging Markets over net sales long-term
guidance with growing weight
▪ Expansion acceleration of Emerging Markets
/ 22Long-term view aligned with DIA’s track record
Long-term vision Targets
▪ Become undisputed #2 food retailer: ▪ > 5% annual growth in
Gross Sales Under Banner
– Strengthen leadership in proximity
discount ▪ Capex 3.5-4.0% over
Iberia – Participate actively in market net sales
consolidation
– Lead food retail e-commerce space ▪ ROI significantly above
sector average
▪ Leverage comfortably within
▪ Become top 3 in each of our markets: investment grade thresholds
Emerging
Markets
– Clearly lead proximity discount
▪ 40-50% pay-out over
– Sustain growth trajectory underlying net profit
/ 2303 Business review
Since listing, we focused on developing our proximity
model in selected geographies

    We have made a number of bold moves…                                         … creating growth opportunities for the future
                                  Divestments                                                                     Adj. EBITDA margin

                                                                                                                        ~8%
                                                                                   Growth
2010      2011         2012        2013        2014   2015      2016      2017     opportunities in
                                                                                                                        ~5%
                                                                                   3 profitable
                                                                                   formats in Iberia
                                                                                                                        ~8%
                                   Acquisitions

                                                                                   2 growing and
          DIA Group                                          CAGR 10-172           profitable
          # Stores                                                 8.5%                                                 4.6%
                                                                                   operations in
          Gross Sales Under Banner                                11.7%            Latam
          Adjusted EBITDA                                              9.1%
1 Proforma data excluding Turkey, France and China
2 Ex-FX                                                                                                                        / 25
Creating a customer-centric value proposition based
on four key dimensions
P rice P artners
Customer at the
center
P roximity
T alent &
echnology
/ 26Customer satisfaction continues to be at the
center of our strategy
Spain example Real-time
tracking of customer
>30,000
satisfaction for each
monthly
store and
surveys
section
received since
May 2017
Every
DIA employee +2.5 NPS
variable
compensation
points
increase in
linked to NPS H2 2017
/ 27Introducing new elements in our value proposition
We already have positive results from new upgraded stores
▪ New services
New sections +20 NPS
▪ Modern layout to increase sales area sale points
contribution increase
▪ More customer needs and of 15-20%
consumption moments
▪ Extended opening hours EUR50-150k >20% of ROI
▪ Best value-for-money proposition Capex of new
unchanged per store remodelings
/ 28Getting closer to our customers at anytime of the day
/ 29New customer needs addressed with the best prices
New value-added products with focus
on health and food-to-go products
/ 30We are leading the way into “digital grocery”
Unique platform to engage with
customers
Increase in
engagement
Club Dia Player A Player B 47 online
with customer
NPS in
Coupon and increased
Spain
tracking1 sales growth
(+10 points)
(+25% store
Sales tracking visits)
Online sales > 800k users
#1 +35%
Store location downloaded coupon
grocery app utilization
Targeted NPS in Spain for app
surveys
users
3.9 3.5 3.5
SOURCE: Google store / 31Outstanding online sales evolution
Online sales evolution
>10% market
EURm
57.6 share 2.4x
in online sales vs
sales1, above 2016
offline share
24.0 Expanded >60% of the
capabilities Spanish
with 3h population
8.8 delivery covered with
slots e-commerce
2015 2016 2017 offer
1 December 2017, Spain
SOURCE: Nielsen / 32Our #1 loyalty program yields higher spending
and improved customer knowledge
Club DIA value proposition continuously improving… … with more projects underway
Customized offer by store
>20 million total active
members
#1
1.8x avg ticket vs Fully personalized
Loyalty program
in food retail
non-Club members promotions
>75% of sales made
through loyalty program JVs and partnerships to
offer new services
(e.g. consumer finance)
/ 33Launch of a consumer finance offer with CaixaBank1
#1 loyalty program and biggest store
network in Spain
Large customer base
Rich knowledge of loyalty clients Integrated financial
offer including:
#1 retail bank in Spain ▪ Credit cards
Leading consumer finance ▪ Consumer finance
capabilities and market knowledge
Strong solvency and experience in
strategic alliances
1 CaixaBank Consumer Finance to acquire 50% of Finandia / 34We keep developing our health and food
solutions Private Brands
Strengthening our Delicious and Vital brand Developing new food solutions
▪ >250 Delicious
products available ▪ New value-added
in >3,500 stores products (coffee,
juice, chicken,
food-to-go, etc.)
▪ New categories in
healthy Vital Brand
(~20 new Vital SKUs) ▪ Increase in sales of food solutions
(e.g. +50% bread sales with “Hornada del DIA”)
/ 35Franchisees’ satisfaction continues to improve
General
satisfaction >10% of
Clarel stores
improved for
franchised
3rd consecutive
year in Iberia
(+20 bps) +85
+50 bps franchisees
satisfaction with added in total
profitability to Dia (~60% of
in Iberia stores)
/ 36We engaged with new partners to improve our
value proposition
Online sales Consumer finance
Sourcing
Other in-store services
/ 37, our vehicle to develop start-up partnerships
Knowledge Providing
sharing customer
between intelligence
employees solutions
Food dynamic Artificial intelli-
pricing engine gence to build the
world´s best
cooking assistant
Main technology applied: Mobility Internet of things Artificial Intelligence (AI) Big Data & Analystics
/ 38We have reorganized around our multi-format
business model in Spain
New Organized around formats to
businesses focus on customer needs and
operations
Specific format strategies with a
Technology global coordination to deliver
synergies
Supply chain
Finance
Increased agility to deploy new
Human Resources
concepts
Procurement
/ 39Working on new efficiency measures to improve
operations
2.5x Real-time data from all stores
technology & New POS
innovation software Self check-out development
budget vs. Efficiency Improved demand and stock
2014 improvement management
driven by
digitization and
innovation
Back office
digitization 10% reduction in central costs
Agile
methodology
rolled-out
across
organization Innovation
/ 40In summary…
2017 2018
▪ In 2017, we focused on sustaining our ▪ We will recover growth in Iberia, with:
price leadership in Dia Spain, eroding – Positive LFL
operating margins – Improved space contribution to sales
growth
▪ However, all other banners and segments
continue their strong upward trajectory
– Continued efficiency improvement
– Growth in adjusted EBITDA
▪ 2017 was a transition year in space
growth, focused on footprint adjustment
▪ We will continue expansion in Emerging
Markets:
▪ We continued to work on our customer- – LFL sales growth and expansion
centred strategy, bringing: acceleration
– Quality at the best price ▪ We will generate double-digit growth of
– Evolving the proximity concept CFO and maintain an efficient use of
capex (3.5-4% of net sales)
– Strengthening the relationship with
franchises and business partners
/ 41A strong and diverse Board of Directors
UPDATES
Mrs. Ana María Llopis Mr. Richard Golding Mr. Mariano Martín Mr. Julian Díaz Mr. Antonio Urcelay
1 Request by Letterone to appoint
two board members to be
submitted to AGM:
- Mr. Stephan Ducharme
Mr. Juan María Nin Mrs. Angela Spindler Mr. Borja de la Cierva Mrs. María Garaña Mr. Ricardo Currás - Mr. Karl-Heinz Holland
Audit
Borja de La Cierva (Chairman)
Julián Díaz (Member)
2 New Board Committee
and
Compliance Juan María Nin (Member) Richard Golding (Chairman)
María Garaña (Member) Strategy Borja de La Cierva (Member)
Mariano Martín (Member)
Nominations
Antonio Urcelay (Member)
Mariano Martín (Chairman)
and
Remunerations Antonio Urcelay (Member)
Angela Spindler (Member)
/ 4204 Appendix
Gross Sales Under Banner & adjusted EBITDA by segment
EURm                                                                           Emerging1

                 Gross Sales Under Banner            Adjusted EBITDA           Iberia

                                            10,334                     568.6

                                                           471.1       25%
                              7,810          36%
                                                            12%

                               28%

                                                            88%        75%
                                             64%
                               72%

                            2011            2017            2011       2017

1 Only includes Brazil and Argentina
                                                                                        / 44
Gross Sales Under Banner growth contribution by segment
EURm
Change -2.2% +3.7% -1.3% +0.2%
-134 10,334
10,314
+379
-225
2016 Iberia LatAm FX 2017
/ 45Gross Sales Under Banner growth breakdown
EURm
Change 3.4% -1.4% -1.8% +0.2%
-144
+351
10,314 -187 10,334
2016 LFL Space FX & Calendar 2017
effect
/ 46EBITDA margin evolution in Iberia
8.8%
Structural investment 7.7%
Seasonal investment
adj. EBITDA Price Customer Sourcing Efficiency adj. EBITDA
margin 2016 Investment service programs margin 2017
and mix
/ 47EBITDA margin evolution in Emerging Markets
4.6%
4.1%
adj. EBITDA Price Customer Sourcing Efficiency FX mix adj. EBITDA
margin 2016 investment service programs margin 2017
and mix
/ 48DIA Iberia 2017 P&L Summary
EURm
Business performance Q4 2016 Q4 2017 Change
Gross Sales Under Banner 1,712 1,661 -2.9%
▪ LFL1,2 +1.1% +1.1%
▪ Space2 -2.0% -2.8%
Adjusted EBITDA 147.1 85.3 -42.0%
Adjusted EBIT 104.6 43.2 -58.6%
Business performance 2016 2017 Change
Gross Sales Under Banner 6,815 6,590 -3.3%
▪ LFL1,2 +1.0% +0.3%
▪ Space2 +0.3% -3.0%
Adjusted EBITDA 507.7 426.3 -16.0%
Adjusted EBIT 329.3 255.8 -22.3%
1 Ex-calendar effect
2 Ex-FX
/ 49DIA Emerging Markets 2017 P&L Summary
EURm
Change
Business performance Q4 2016 Q4 2017 Change (ex. Fx)
Gross Sales Under Banner 980 939 -4.2% +10.0%
▪ LFL1,2 +18.1% +8.3%
▪ Space2 +5.4% +2.6%
Adjusted EBITDA 49.2 51.6 +4.9% +15.9%
Adjusted EBIT 35.5 36.2 +2.1% +12.2%
Change
Business performance 2016 2017 Change (ex. Fx)
Gross Sales Under Banner 3,499 3,745 +7.0% +10.8%
▪ LFL1,2 +19.1% +8.6%
▪ Space2 +6.9% +2.4%
Adjusted EBITDA 120.2 142.3 +18.4% +21.4%
Adjusted EBIT 71.8 80.8 +12.5% +17.4%
1 Ex-calendar effect
2 Ex-FX
/ 50Business review: Iberia
EURm
Change
SPAIN 2014 2015 2016 2017 17-16
# stores 4,781 4,941 4,875 4,713 -162
# franchised stores 1,646 1,954 2,147 2,170 23
Total store selling area (sqm) 1,829,400 1,939,900 1,876,400 1,802,300 -3.9%
Gross Sales Under Banner 5,219 5,915 5,967 5,737 -3.8%
Net Sales 4,497 5,077 5,065 4,827 -4.7%
Change
PORTUGAL 2014 2015 2016 2017 17-16
# stores 634 621 623 630 7
# franchised stores 288 260 256 297 41
Total store selling area (sqm) 225,500 219,300 220,400 224,900 2.0%
Gross Sales Under Banner 876 823 848 853 0.6%
Net Sales 725 678 682 678 -0.5%
/ 51Business review: Emerging Markets
EURm
Change Change
ARGENTINA 2014 2015 2016 2017 17-16 17-16 (ex-FX)
# stores 724 846 872 930 58
# franchised stores 486 584 576 627 51
Total store selling area (sqm) 204,100 230,800 238,700 251,300 5.3%
Gross Sales Under Banner 1,374 1,922 1,643 1,748 6.4% 21.5%
Net Sales 1,096 1,532 1,311 1,392 6.2% 21.2%
Change Change
BRAZIL 2014 2015 2016 2017 17-16 17-16 (ex-FX)
# stores 799 929 1,050 1,115 65
# franchised stores 495 621 671 691 20
Total store selling area (sqm) 386,900 420,400 480,800 489,600 1.8%
Gross Sales Under Banner 1,730 1,645 1,856 1,997 7.6% 1.4%
Net Sales 1,524 1,436 1,612 1,723 6.9% 0.8%
/ 52Trade working capital breakdown
EURm
Change
31 Dec 20163 31 Dec 2017 Change (ex. Fx)
Inventories (A) 658.0 569.6 -13.4% -6.1%
Trade & other receivables (B) 164.9 221.9 34.5% 43.8%
With franchisees 101.2 122.7 21.2%
With suppliers & other 63.7 99.2 55.6%
Trade & other payables (C) 1,815.1 1,710.8 -5.7% 0.6%
TRADE WORKING CAPITAL1,2 -992.2 -919.3 -7.3% -2.1%
1 Trade working capital defined as A+B-C
2 Non-recourse factoring from receivables from our suppliers amounted to EUR99.6m
3 Figures adjusted by the discontinuation of DIA China. / 53Trade working capital evolution
Inventories
Net # days evolution -38 -54 -49 Trade & other receivables
Trade & other payables
35 31
9 12
-98 -92
2016 2017
/ 54Cash from operations review
EURm
Total
2016 2017 2016-17
Adjusted EBITDA 627.91 568.6 1,196.5
Organic Capex 340.22 301.8 642.0
Other cash items 52.33 59.8 112.1
CFO 235.4 207.0 442.4
CFO (at constant 2015 FX) 239.5 210.2 449.7
1 EUR2.8m DIA China discontinuation
2 EUR5.2m DIA China discontinuation
3 EUR20.7m DIA China discontinuation & cash capital gains / 55EUR1,045m distributed since listing
Dividend evolution (EUR per share)
0.21
0.20
0.18 0.18
0.16
0.13
0.11
2011 2012 2013 2014 2015 2016 2017
proposal
/ 56Credit rating maintained, diverse funding sources
EURm
Debt maturity Financial leverage
Bilaterals Bond 2019
Net debt/ adj. EBITDA
RCF 2014 Bond 2021
RCF 2015 Bond 2023 1.1x 0.9x 1.8x 1.4x 1.6x
321
15 300 300 300 1,132
240
878 891
15
176 651
306 533
101 225
75
2018 2019 2020 2021 2022 2023 2013 2014 2015 2016 2017
/ 57400
EURm 100-200
Further
footprint
20171 Change2 optimization
expected in
Gross sales under banner 5,238 -3.5% 2018
Stores (#) 3,534 -116
franchises 62%
Sales density (EURk/m2) 3.3
-0.5%
Adjusted EBITDA margin ~8% 613 in 2017 LFL in 2017
remodelings
focusing on
Plug&Play
1 Excluding Cada Dia, except in franchise %
2 Change vs 2016 modules
Note: LFL excluding calendar effect / 58Evolution of food stores acquired in Spain
Supermarket stores acquired as of 31/12/2017
To
13 84 97
6 - 6
92 160 290
35 171 206 Closures
147 452 599 Total stores acquired
/ 59Growing penetration of franchised stores
% over total Dia and Cada Dia/Mais Perto stores
61.1% 62.3% 62.4%
54.4%
48.3%
41.8%
2012 2013 2014 2015 2016 2017
Reported data
/ 60La Plaza highlights 150 new
2017 Change1 remodellings
in 2018
Gross sales under banner 813 -6.2%
Stores (#) 306 -49
Sales density (EURk/m2) 3.4
>10 new
openings
Adjusted EBITDA margin >5%
in 2018
+6.8%
LFL in
2017
1 Change vs 2016
Note: LFL excluding calendar effect / 61Clarel Iberia highlights 600
2017 Change1
+1.3%
LFL in
Gross sales under banner 358 +2,6%
2017
Stores (#) 1,251 +18
franchises 11.7% 360
remodellings in
Sales density (EURk/m2) 1.7 2018 including
additional
Adjusted EBITDA margin ~8% >50 new services
stores in
1 Change vs 2016
2018
Note: LFL excluding calendar effect / 62E-commerce for Group DIA sales share and evolution
E-commerce market share1 Online sales evolution
EURm
10% 57.6
8%
24.0
8.8
DIA online DIA offline 2015 2016 2017
1 December 2017, Spain
SOURCE: Nielsen / 63Food inflation in Emerging Markets
National Food Inflation in Brazil National Food Inflation in Argentina
16.7% 39.2% 39.1%
11.9%
29.9%
4.6%
26.1%
1.0%
22.2% 21.7%
-4.5% -5.1%
SOURCE: IBGE (Instituto Brasileiro de Geografia e Estatística) & INDEC (Instituto Nacional de Estadística y Censos Average on monthly data of the quarters / 64Currency performance
%
EUR/ARP
28.2 EUR/BRL
18.6
16.4
8.0 6.5
-2.5
-4.8 -4.8
-7.6 -7.4
-12.2
-17.4 -17.8 -19.7
-25.1
-34.1
-38.5 -38.1 -38.4 -37.4
Q1 2016 Q2 2016 Q3 2016 Q4 2016 FY 2016 Q1 2017 Q2 2017 Q3 2017 Q4 2017 FY 2017
SOURCE: Bloomberg average currency rates (a negative change in exchange rates implies a depreciation versus the Euro) / 65You can also read