FY 2020 RESULTS February 19th, 2021 - Seeking Alpha
←
→
Page content transcription
If your browser does not render page correctly, please read the page content below

FY 2020 RESULTS

   February 19th, 2021

                         I 1 I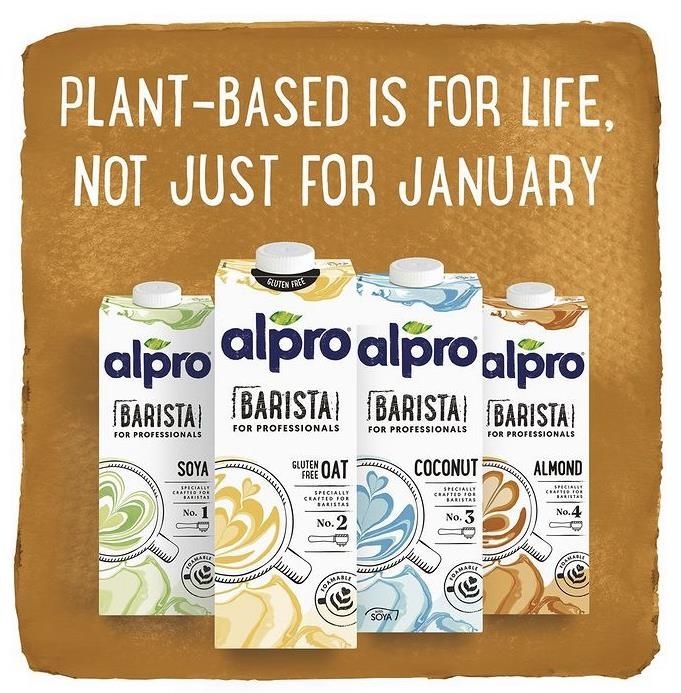
Disclaimer

• This presentation contains certain forward-looking statements concerning Danone. In some cases, you can identify these forward-
  looking statements by forward-looking words, such as “estimate”, “expect”, “anticipate”, “project”, “plan”, “intend”, “objective”,
  “believe”, “forecast”, “guidance”, “outlook”, “foresee”, “likely”, “may”, “should”, “goal”, “target”, “might”, “will”, “could”,
  “predict”, “continue”, “convinced” and “confident,” the negative or plural of these words and other comparable terminology.
  Forward looking statements in this document include, but are not limited to, predictions of future activities, operations, direction,
  performance and results of Danone.

• Although Danone believes its expectations are based on reasonable assumptions, these forward-looking statements are subject to
  numerous risks and uncertainties, which could cause actual results to differ materially from those anticipated in these forward-
  looking statements. For a description of these risks and uncertainties, please refer to the “Risk Factor” section of Danone’s Universal
  Registration Document (the current version of which is available on www.danone.com).

• Subject to regulatory requirements, Danone does not undertake to publicly update or revise any of these forward-looking
  statements. This document does not constitute an offer to sell, or a solicitation of an offer to buy Danone securities.

• All references in this presentation to Like-for-like (LFL) changes, recurring operating income, recurring operating margin, recurring
  net income, recurring income tax, recurring EPS and free cash flow correspond to financial indicators not defined in IFRS. Please
  refer to the FY 2020 results press release issued on February 19, 2021 for further details on IAS29 (Financial reporting in
  hyperinflationary economies), the definitions and reconciliation with financial statements of financial indicators not defined in IFRS.
  Finally, the calculation of ROIC and Net Debt/Ebitda is detailed in the annual registration document.

• Due to rounding, the sum of values presented in this presentation may differ from totals as reported. Such differences are not
  material.

                                                                                                                                    I 2 I
CEO Introduction
What you will hear from us today…

 A brief history

 Contrasted performance in 2020, after 5 years of consistent and competitive delivery

 Danone’s reinvention is underway, around 4 pillars

 Strengthened governance

                                                                                        I 3 I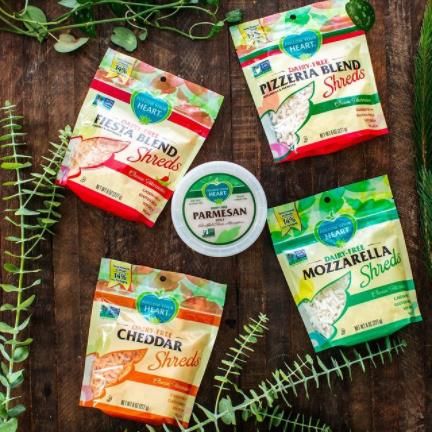
A brief history

Contrasted performance in 2020, after 5 years of consistent and competitive delivery

Danone’s reinvention is underway, around 4 pillars

Strengthened governance

                                                                                       I 4 I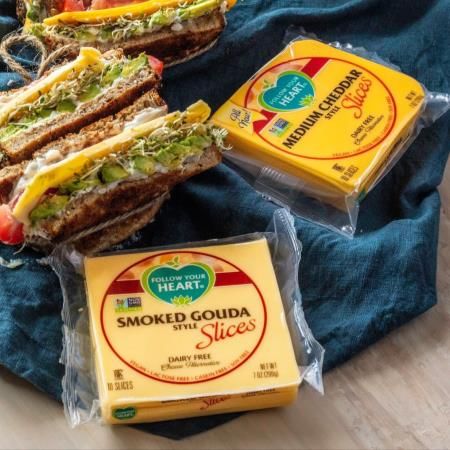
5 years of consistent and competitive delivery
Sales growth, margin and EPS delivery ahead of larger panel up to 2019

                       Like-for-like sales growth                                                                Recurring operating margin and EPS
                        Essential Dairy
  Total Company                                Specialized Nutrition                Waters                         Recurring operating margin                   Recurring EPS
                       and Plant-based

                                                 +6.9%

                                                                                                                        +260bps                               ~ 8%

                                                                                                                                   +210bps
                                                                              +4.3%
                                                            +3.6%                                                                                                        ~ 5%
  +3.1%                                                                                  +3.1%

           +2.0%

                       +0.6%
                                -6.8%

  Danone    Avg.       Danone                    Danone      Top              Danone      Top                            Danone      Avg.                     Danone     Avg.
           Peers (1)                                        global                       global                                     Peers (1)                           Peers (1)
                                Top                       competitor                   competitor
                               global
                             competitor (2)

                             Note: LFL sales growth and recurring EPS comparisons made between 2015 and 2019; recurring operating margin comparison between 2014 and 2019
                             (1) Panel of 8 leading global food and beverage companies, used to determine the performance conditions for long-term incentives; (2) Reported growth   I 5 I
5 years of consistent and competitive delivery
Improving sales growth and earnings in line with key peers

            Recurring EPS                                      Life-for-like sales growth                                     Recurring operating margin

          2015-2019 average growth                                    2015-2019 average growth                                               2014-2019 evolution

                        +9.8%
 +8.1%                                                                    +3.3%         +3.4%                                                                          +610bps
                                     +7.4%                  +3.1%
                                                                                                                                                         +464bps
            +5.3%                                                                                     +2.1%
                                                                                                                             +260bps
                                                                                                                                           +129bps

 Danone      Peer #1    Peer #2      Peer #3               Danone         Peer #1       Peer #2       Peer #3                 Danone         Peer #1       Peer #2       Peer #3

                              Note: LFL sales growth and recurring EPS comparisons made between 2015 and 2019; recurring operating margin comparison between 2014 and 2019    I 6 I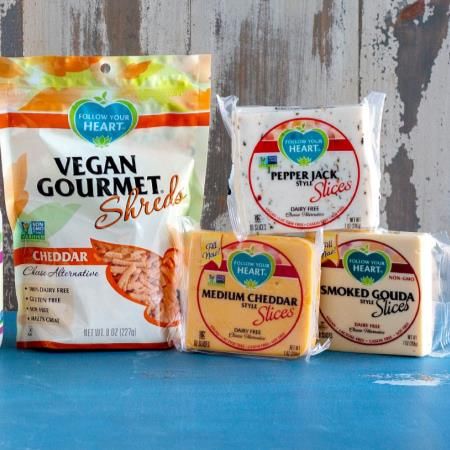
A brief history

Contrasted performance in 2020, after 5 years of consistent and competitive delivery

Danone’s reinvention is underway, around 4 pillars

Strengthened governance

                                                                                       I 7 I
2020 made our frame of action more relevant than ever
We bring Health through food to as many people as possible

                                         Healthier       Local   Leader

                                        Sustainable      Agile   Purpose

                                                                           I 8 I
Committed to sustainable value creation
Through our business, brand and trust model

     Focus on profitable                                     Recognized superior                                                                Fostering inclusion and
     sustainable growth                                   environmental performance                                                                  engagement

        +15%                                                             AAA                                                                                 91%
                                               CDP ranking for the 2nd year in a row                                                       of employees recommend
  Plant-Based 2020 like-for-                       One of only 10 companies                                                                   Danone as a GPTW(2)
      like sales growth                             The only food company                                                                   +11bps vs FMCG norm(3)

        ~50%                                                                                                                                                 50%
                                                    -1mt carbon emissions
                                                           in 2020 full scope(1)
                                                                                                                                                     of Directors from
      of sales covered                                                 cost of carbon                                                               underrepresented
   by B Corp certification                                             per share -4%                                                                  nationalities(3)

                    (1) Compared to 2019, based on constant scope of consolidation and constant methodology; (2)Good place to work; (3) % of Danone people saying “I would recommend Danone
                                                                                                                                                                                                     I 9 I
                    as a good place to work” (2020 One Voice consultation); (3) (1) Under-represented nationalities are nationalities within the Africa, Americas, Asia, Eastern Europe and Oceania regions
Closing 2020 with priorities delivered through the Covid crisis
Focus on competitive profitable growth and absolute cash

     14%            Recurring operating margin

  €2.1bn            Free cash flow

   LFL sales        Sequential improvement Q4 vs Q3: -1.4% vs -2.5%
    growth          FY: -1.5% LFL; contrasted performance by category

                                                                        I 10 I
Market Share strength
Across key categories and brands
Infant Milk Formula
Dairy & Waters
Essential Dairy
I 11 IEDP back to solid performance, highest LFL sales growth since 2012
Dairy growing low-single-digit in 2020
& CIS
Modern & Traditional Dairy
Dairy Europe is back to growth Dairy US: Broad-based sales growth
portfolios fueling growth recovery
2017 2018 2019 2020
+1%
~ -2%
~ -3%
~ -7%
Like-for-like sales growth
I 12 IEDP back to solid performance, highest LFL sales growth since 2012
Dairy reaping the fruits of the repositioning strategy
Restored category relevance & market share gains Restored category relevance & market share gains
Health & Immunity Smart Indulgence
> +10% > +20bps MS > +5% > +23bps MS
LFL sales growth Global (1) LFL sales growth Global (1)
(1) Source: Nielsen / IRI, , Value share, YTD vs YTD-1 I 13 IAnother year of accelerated innovation
36% of revenues generated from products launched less than 2 years ago
% of Innovation in Net Sales (1)
~ x2
36%
20%
16%
2016 2018 2020
(1) Innovations and renovations over the last 24 months I 14 IInnovation model will be adapted to the new context
SKU rationalization to allow for more selective and meaningful innovation
Successful dynamic portfolio management
2021 plan
2020 example
# of SKUs cut
2020 2021
+10% volume output on
performing assets
~ -500
Double-digit growth
in 2020
-30% in # SKU on ~ -1500
half-gallon formats +200bps share gains (1)
in 2020 widening gap with competition -20% of total Company SKUs
cut by end of 2021
(1) Source: IRI, Value share, YTD vs YTD-1 I 15 I2020, the last year of the WhiteWave integration
Value creation plan delivered
Growth engine since Legacy WW driving Value creation plan
the acquisition growth in 2020 fully delivered
2016 – 2020 CAGR 2020 like for like sales growth Integration Synergies
Original plan Delivery
+11% ~ $300m overdelivered
+6% +13%
Category leadership Contribution to Danone 2020 LFL growth EBITDA evolution
#1 #1
PB Beverages
and Yogurt
Organic milk
PB Beverages
~ +160bps +40%
between 2016 and 2020
and Yogurt
I 16 IA brief history
Contrasted performance in 2020, after 5 years of consistent and competitive delivery
Danone’s reinvention is underway, around 4 pillars
Strengthened governance
I 17 IFour pillars to reconnect with Danone’s mid-term profitable growth ambition
And restore shareholder value creation
Reviewing our
Investing for Optimizing
Reshaping the portfolio, making
portfolio superiority execution across
organization selective divestures
and differentiation the value chain
and bolt on
acquisitions
I 18 IFour pillars to reconnect with Danone’s mid-term profitable growth ambition
And restore shareholder value creation
Reviewing our
Investing for Optimizing
Reshaping the portfolio, making
portfolio superiority execution across
organization selective divestures
and differentiation the value chain
and bolt on
acquisitions
I 19 IPlant-based now representing c. 20% of EDP revenues
Reaching scale thanks to accelerated geographic and portfolio expansion
Plant-based now Continued category Accelerated
contributing at scale penetration gains expansion
+15% +5pts ~ €750m ~ +60%
LFL sales growth since 2016 (1) revenus in 2020 vs 2015
Number of countries addressed
€2.2bn +8pts
> 60
< 30
~ x2
revenues in 2020 since 2016 (1)
2015 2020
WW Danone
I 20
(1) Source: IRI – Refrigerated plant-based beverages (US), GfK – Plant-based Beverages; weighted average including Belgium, Germany, UK, Italy and Spain IPortfolio superiority and differentiation through incremental innovation
YoPro and Two Good, reinventing the High Protein and Greek segments
2020 revenues
~€ 130 m
3 years after launch
2020 revenues
~€ 100 m
2 years after launch
I 21 I~ €2bn revenues from eCommerce in 2020
Growth fueled by consumer adoption and market share gains
~ €2bn
revenues in 2020 (1) 75%
of businesses gaining eCom
~ +40%
like for like sales growth (1)
market share in Europe EDP (3)
+ 162 bps
~ 10%
+ 190 bps
+ 340 bps
of Company 2020 sales (2)
(1) Excluding Indirect sales; (2) Including Indirect sales; (3) Evolution of Danone eCommerce market share YTD 2020 (source I RI / Nielsen) I 22 IFour pillars to reconnect with Danone’s mid-term profitable growth ambition
And restore shareholder value creation
Reviewing our
Investing for Optimizing
Reshaping the portfolio, making
portfolio superiority execution across
organization selective divestures
and differentiation the value chain
and bolt on
acquisitions
I 23 IDelivering superior consumer value for profitable growth
With unmatched science and technology in Plant-based, Probiotics and Proteins
Plant-based
Accelerating brand support in 2021
~+ 8%
LFL sales growth vs LY
Probiotics Proteins
I 24 IDelivering superior consumer value for profitable growth
Design to Deliver integration already in action with Alpro
Unique 40-year
ingredient dataset
~4.0
relative
market
share
Direct farmer
relationships
First brand of choice (18-24yo) (1)
Proprietary
processing
capabilities
Unique x2
technology
Comp.
#1
(1) Source: Consumer surveys (2020) I 25 IFour pillars to reconnect with Danone’s mid-term profitable growth ambition
And restore shareholder value creation
Reviewing our
Investing for Optimizing
Reshaping the portfolio, making
portfolio superiority execution across
organization selective divestures
and differentiation the value chain
and bolt on
acquisitions
I 26 ILocal First: organization design as a lever for growth and resilience
From category-led independent businesses to geography-led cross-category units
FROM 3 BUSINESSES OPERATING IN PARALLEL TO CROSS-CATEGORY LOCAL ENTITIES
Local cross-category consumer centricity
Brand Brand Brand Synergized manufacturing & supply chain capabilities
assets assets assets
Manufacturing Manufacturing Manufacturing Synergized sales & distribution efforts
& Supply chain & Supply chain & Supply chain
Sales & Sales & Sales &
Distribution Distribution Distribution
protected category expertise
3 divisions
6 zone teams
13 regional teams
22 country business units
61 country business units
I 27 IA fitter and more agile organization
€700m savings on SG&A by 2023 to fuel growth and restore margins
€1bn
Overheads (% of NS, 2019)
Cost of goods sold
€300m and logistic costs
Extra productivity
~20% SG&A
€700m
costs reduction
in 3 years to restore
competitiveness and
invest in growth
Danone Average
peers
Peer A Peer B Peer C 2023 savings
I 28 IFour pillars to reconnect with Danone’s mid-term profitable growth ambition
And restore shareholder value creation
Reviewing our
Investing for Optimizing
Reshaping the portfolio, making
portfolio superiority execution across
organization selective divestures
and differentiation the value chain
and bolt on
acquisitions
I 29 IAccelerating in major Plant-Based adjacencies
Welcoming Follow Your Heart in the Danone Plant-based family
#1 position in US plant-based sliced cheese (1)
#2 position in US plant-based shredded cheese (1)
Leading position in plant-based mayonnaise
(1) In Natural and Conventional Grocery channels I 30 IDisciplined capital allocation to drive shareholder returns
With clear and well-balanced priorities
Continued disciplined capital allocation
Capital allocation priorities
to drive shareholder returns
Investment in profitable
sustainable growth
Strategic review of Argentina
and Vega on track
Sustainable and
resilient balance
Total Bolt on
shareholder acquisitions
sheet
Sale of remaining 6.6% stake in returns
Yakult in October 2020
following first exit in 2018
• > 25x P/E (1), unlocking €470m of
invested capital Dividend and
share buybacks
• ~ €200m capital gain
TSR part of Executive Committee
incentives as of 2021
(1) NTM P/E at disposal date I 31 IFour pillars to reconnect with Danone’s mid-term profitable growth ambition
And restore shareholder value creation
Reviewing our
Investing for Optimizing
Reshaping the portfolio, making
portfolio superiority execution across
organization selective divestures
and differentiation the value chain
and bolt on
acquisitions
€2bn investment plan in 2020-2022 €1.4bn restructuring 2021-2023
Accelerating growth and delivering €1bn savings by 2023 towards Danone
mid-term targets: 3% to 5% LFL sales growth, mid to high teens operating margin
I 32 IA brief history
Contrasted performance in 2020, after 5 years of consistent and competitive delivery
Danone’s reinvention is underway, around 4 pillars
Strengthened governance
I 33 IStrengthening our governance
To oversee Management’s delivery of the plan, including Local First
A Board reaching 70% A newly created Strategy & Entreprise à Mission
independence & gender parity Transformation Committee Mission Committee
After 2021 Shareholders’ Meeting
New Lead Monitoring progress on Monitoring progress
Independent
Gilles
SCHNEPP Director adaptation plan and on Social and
portfolio review Environmental goals
Two new
Ariane
members
GORIN
bringing Pascal LAMY
additional Chair
expertise Benoît POTIER supported by 8 members with
Chair
global independent expertise
Dr. Susan
ROBERTS
I 34 I2020 financial review
Juergen Esser
CFO
I 35 ISales bridge
Sequential LFL improvement in Q4 vs Q3
FY 20 sales bridge Quarterly LFL sales growth
Reported growth -6.6%
€25,287m
+3.7%
-5.0%
+0.3%
-1.5%
€23,620m
-0.4% -0.1%
LFL growth: -1.5%
-1.4%
-2.5%
-5.7%
FY 2019 Currency Argentina(2) Scope Volume Value FY 2020 Q1 Q2 Q3 Q4
and others(1) 2020 2020 2020 2020
(1) Including IAS 29; (2) Argentina organic contribution to growth: sine January 2019, all like-for-like data exclude the contribution of Argentinian entities I 36 ISpecialized Nutrition
Sequential improvement vs Q3
Quarterly LFL sales growth Q4 developments
China
+7.9% ▪ Domestic channels back to growth in Q4; cross-border declining -45%
+5.8%
▪ Solid market share performance: Aptamil, number one multinational brand
-2.2% -3.1% -0.9%
in China IMF, holding market share, best performer during 11-11 event
-5.7%
▪ Strong performance maintained in Advanced Medical Nutrition
FY 2019 Q1 2020 Q2 2020 Q3 2020 Q4 2020 FY 2020 Europe
▪ Slow recovery in Infant Milk and First Diet categories
FY 2020 key figures
▪ Medical nutrition activity back to a more normalized situation
Sales €7.2bn
▪ Resilient market share performance, notably in UK and France
Like-for-like change -0.9%
Volume / Value -0.8% / -0.1%
Other geographies
Recurring operating margin 24.5%
Change -74 bps
▪ Strong performance driven by market share gain
Like-for-like sales growth excluding Argentina
I 37 IEssential Dairy & Plant-based
Back to solid performance in 2020
Quarterly LFL sales growth
Plant-based reaching €2.2bn sales, growing +15% LFL in FY 2020
▪ Alpro, Silk and So Delicious growing double-digit
▪ Alpro now a c. €750m brand
+4.6%
+3.7% +3.6% +3.4%
+1.6%
+1.1% Q4 developments
FY 2019 Q1 2020 Q2 2020 Q3 2020 Q4 2020 FY 2020 Europe and North America driving the performance, up mid-single digit
▪ Dairy Europe back to growth, reaping the fruits of repositioning in 2019
FY 2020 key figures ▪ Increased relevance of Health and Immunity
Sales €12.8bn ▪ North America: resilient in Yogurt and Coffee Creamers, continued
performance of Plant-based and Premium Dairy
Like-for-like change +3.4%
Volume / Value +3.0% / +0.3%
Rest of the world
Recurring operating margin 10.2%
▪ Low single digit growth in CIS
Change -6 bps
▪ Steady performance in Latin America and Africa
Like-for-like sales growth excluding Argentina
I 38 IWaters
Volumes and mix impact from muted out-of-home consumption
Quarterly LFL sales growth Q4 developments
+1.5% Product, format and channel performance driven by lockdowns
-6.8% ▪ Out-of-home channels declining –20% and small formats down -30%
-13.5% -15.6% -16.8%
▪ Average price per liter severely hit by negative channel and format mix
-28.0%
Deteriorating conditions in Europe
▪ Europe performance negatively impacted by new wave of lockdowns and
FY 2019 Q1 2020 Q2 2020 Q3 2020 Q4 2020 FY 2020 restrictions to mobility
▪ Resilient market share performance, especially in France, Germany and UK
FY 2020 key figures
Sales €3.6bn Indonesia and Latam
Like-for-like change -16.8% ▪ Strong impact on out-of-home channels on the back of restrictions and
Volume / Value -7.7% / -9.1%
curfews
Recurring operating margin 7.0%
China
Change -601 bps
▪ Mizone back to growth in Q4 on a small quarter
Like-for-like sales growth excluding Argentina
I 39 IFY 2020 recurring operating margin
Margin deterioration mostly driven by Covid-related negative mix and extra costs
-117 bps
Scope Margin from Incremental
and FX operations costs related Investments Overheads
and others
15.2% to Covid
+34 bps
-102 bps
14.0%
-62 bps
+28 bps
-14 bps
Like-for-like -150 bps mainly driven by:
• Scope: +7bps • ~ -100bps of negative mix and -62 bps of Covid-related costs
• Currency: +38bps(1) • Volumes: ~ -5bps
• Argentina: -11bps • Inflation: ~ -280bps
• Productivities and mitigation actions: ~+350 bps
FY 2019 FY 2020
Recurring Recurring
operating margin operating margin
(1) Including IAS 29 I 40 IEPS
Decline of recurring EPS driven by operating performance; cost of carbon per share -4%
EPS bridge Carbon-adjusted EPS
+1.2%
-13.2%
€3.85
+0.2% €3.34
€3.34
-12.6% +0.8%
€2.99
€2.95
-0.6% -1.0%
cost of carbon per share: €1.41
€1.68 -4% vs LY driven by decrease of
carbon emissions
‘carbon-adjusted EPS’: €1.94
FY 2019 FY 2019 Operational Financing Tax, associates Scope Currency FY 2020 FY 2020 FY 2020
Reported EPS Recurring EPS Performance and minorities and others(1) Recurring EPS Reported EPS Recurring EPS
(1) Including IAS 29 I 41 ICash flow and balance sheet
Protecting cash generation and gearing through disciplined capital allocation
Free cash flow Working capital Capex Net Debt
€2.1bn -3.1% €962m 2.8x
Net debt/ EBITDA
8.7% conversion rate Negative
channel mix
4.1% of Net Sales
€11.9bn
Net debt
I 42 IProposed dividend of 1.94€ per share in cash at next AGM on April 29th, 2021
Balanced decision reflecting confidence in company resilience
€1.60 €1.70 €1.90 €1.94 €2.10 €1.94
Dividend
2015 2016 2017 2018 2019 2020
proposed
Payout
ratio 55% 55% 54% 54% 55% 58%
I 43 I2021 Outlook
2 phase year, return to profitable growth as of H2
Continued uncertainties on duration and level of restrictions across all geographies in H1 2021
Macro
outlook Progressive reopening of economies assumed starting from H2, driven by progressive roll-out
of vaccination programs
Tough Q1 driven by base of comparison and continued channel-related headwinds
Back to growth as of Q2
Danone
outlook Back to profitable growth in H2
FY margin expected broadly in line with 2020
I 44 IReiterating Financial Targets
Long-term goal
Mid-term ambition
2022 target
3% to 5%
LFL (1) sales growth
> 15%
operating mid to high teens
margin (2) operating margin(2)
(1) Like-for-like
(2) Recurring operating margin
I 45 ILeading in sustainability
Through financial disclosure
Engaged in the UN Compliant with TCFD Supporting the
Global Compact framework Audencia academic
CFO Task Force research chair
Together with 40+ corporates Piloting non-financial
and investors worldwide reporting standards with the
European Union
I 46 IConclusion
Emmanuel Faber
Chairman & CEO
I 47 IAppendix
I 48 IQ4 2020 sales by reporting entity – breakdown volume/value
By reporting entity By geographical area
Essential Dairy Specialized Europe Rest of
Company Waters
& Plant-based Nutrition & Noram the World
Q4 net sales €5,628m €3,131m €1,753m €743m €3,252m €2,376m
Like-for-like
-1.4% +3.6% -3.1% -15.6% -1.0% -1.9%
growth
Volume +0.0% +3.7% -1.7% -9.3% +1.0% -1.0%
Value -1.4% -0.1% -1.3% -6.3% -1.9% -0.9%
I 49 IQ4 2020 sales by reporting entity and by geographical area
Essential Dairy Specialized
Waters Company
& Plant-based Nutrition
Europe and Noram
Sales €2,182m €738m €332m €3,252m
LFL growth +4.6% -5.0% -21.9% -1.0%
Rest of the world
Sales €950m €1,015m €411m €2,376m
LFL growth +1.7% -1.7% -10.2% -1.9%
Company
€3,131m €1,753m €743m €5,628m
Sales
LFL growth +3.6% -3.1% -15.6% -1.4%
I 50 IQ4 & FY 2020 impact of currencies & scope
Q4 2020 Essential Dairy
Specialized Nutrition Waters Total
& Plant-based
Reported sales growth -6.1% -9.8% -22.8% -9.8%
Argentina organic contribution to growth +0.3% +0.3% +0.4% +0.3%
Currency and others(1) -9.8% -6.7% -7.5% -8.5%
IAS 29 impact -0.2% -0.4% -0.3% -0.3%
Scope +0.0% +0.1% +0.2% +0.1%
Like-for-like sales growth +3.6% -3.1% -15.6% -1.4%
FY 2020 Essential Dairy
Specialized Nutrition Waters Total
& Plant-based
Reported sales growth -2.6% -4.8% -21.1% -6.6%
Argentina organic contribution to growth +0.4% +0.4% +0.2% +0.3%
Currency and others(1) -5.4% -4.2% -4.4% -4.9%
IAS 29 impact -0.2% -0.1% -0.1% -0.1%
Scope -0.8% +0.0% +0.1% -0.4%
Like-for-like sales growth +3.4% -0.9% -16.8% -1.5%
(1) Excluding IAS29 impact
I 51 IChanges in exchange rates
% total FY 2020 FY 20 vs FY 19 (avg) Q4 20 vs Q4 19 (avg)
United States Dollar 21.5% -2.0% -7.2%
Chinese Renminbi 6.8% -1.8% -1.2%
Russian Ruble 6.0% -12.6% -22.4%
Indonesian Rupiah 5.7% -4.4% -8.9%
British Pound 5.4% -1.3% -4.7%
Mexican Peso 3.8% -12.1% -13.0%
Brazilian Real 2.4% -25.2% -29.2%
Polish Zloty 2.4% -3.3% -4.8%
Canadian Dollar 2.3% -2.9% -6.0%
Hong Kong Dollar 2.1% -1.0% -6.3%
Argentine Peso 1.8% -33.6% -31.4%
Australian Dollar 1.6% -2.7% -0.7%
Turkish Lira 1.6% -21.1% -31.7%
I 52 IRecurring operating margin
Recurring operating profit FY 2019 FY 2020 Change
(€m) and margin (%)
€m Margin (%) €m Margin (%) Reported Like-for-like
Essential Dairy & Plant-based 1,345 10.2% 1,303 10.2% -6 bps -36 bps
Specialized Nutrition 1,908 25.3% 1,763 24.5% -74 bps -126 bps
Waters 593 13.0% 251 7.0% -601 bps -574 bps
Europe & Noram 1,999 14.6% 1,823 13.6% -98 bps -117 bps
Rest of the world 1,847 16.0% 1,494 14.6% -132 bps -189 bps
Total 3,846 15.2% 3,317 14.0% -117 bps -150 bps
I 53 IBalance sheet
Assets(1) Liabilities
in € million
31/12/19 31/12/20 31/12/19 31/12/20
17,378
16,298
24,846 Shareholders’ equity
23,037
Intangible assets
12,819
11,941 Net debt(2)
10,177 9,733
Other assets 3,825 3,798 Other liabilities
Working capital 5,778 5,448 6,779 6,181 Working capital
40,801 38,218 40,801 38,218
(1) Excluding assets included in net debt
(2) Net of cash, cash equivalents, marketable securities, other short-term investments and financial instrument asset
I 54 ITax rate development
€ mln 2019 2020
Total income tax (reported) (793) (762)
Reported tax rate 27.7% 30.6%
Non-current income tax(1) 163 66
Current income tax (956) (828)
Underlying tax rate 27.5% 27.5%
(1) Tax related to non-current items
I 55 ICash-flow statement
2019 2020
Recurring operating income 3,846 3,317
Financial income (370) (310)
Income tax on operating and financial income (956) (828)
Non-current income net of tax (446) (453)
Depreciation and amortization 1,386 1,452
Net change in provisions / Deferred taxes 151 (5)
Dividend received from equity accounted affiliates 53 32
Net change in interest income (expense) 8 12
Expense related to stock options and GPS 30 16
(Gains) losses on disposal of property, plant and equipment and financial 14 (54)
investments
Other components of net income with no cash impact 39 20
Cash flow provided by operating activities,
excluding changes in net working capital
3,755 3,199
I 56 ICash-flow statement
2019 2020
Cash flow provided by operating activities,
excluding changes in net working capital
3,755 3,199
Change in working capital (311) (232)
Cash flow from operations 3,444 2,967
Capital expenditure (951) (962)
Proceeds from the sale of industrial assets 16 43
Business acquisitions and other investments, (112) (183)
net of cash and cash equivalent acquired
Proceeds from the sale of business 58 547
Change in long-term loans and other long-term assets (19) (54)
Cash flow used in investing activities and disposals (1,008) (610)
I 57 ICash-flow statement
2019 2020
Cash flow used in investing activities and disposals (1,008) (610)
Increase in capital and additional paid-in capital 55 30
Purchases of treasury stock (net of disposal) - 0
Perpetual subordinated notes issued or repaid during the period (22) (22)
Dividends paid to Danone shareholders (1,256) (1,363)
Transactions with non controlling interests* (209) (147)
Net cash flows on hedging derivatives (7) (1)
Bonds issued or raised during the period 0 1,600
Bonds repaid during the period (1,899) (2,050)
Increase (decrease) in other current and non-current financial debt 354 (306)
Increase (decrease) in other short-term investments 584 (102)
Cash flow used in financing activities (2,400) (2,360)
Effect of exchange rate and other changes (231) (48)
Increase (decrease) in cash (195) (51)
* Including dividends and capital increase
I 58 IEBITDA calculation
2019 2020
Operating income 3,237 2,798
Depreciation, amortization and impairment of property, plant
and equipment and intangible assets
1,386 1,452
EBITDA 4,623 4,250
I 59 IYou can also read