INVESTOR PRESENTATION - FEBRUARY/MARCH 2021 - BORGWARNER

Page created by Jacqueline Robbins
 
CONTINUE READING
INVESTOR PRESENTATION - FEBRUARY/MARCH 2021 - BORGWARNER
Investor Presentation

February/March 2021
INVESTOR PRESENTATION - FEBRUARY/MARCH 2021 - BORGWARNER
Forward-Looking Statements
This presentation may contain forward-looking statements as contemplated by the 1995 Private Securities Litigation Reform Act that are based on management’s current
outlook, expectations, estimates and projections. Words such as “anticipates,” “believes,” “continues,” “could,” “designed,” “effect,” “estimates,” “evaluates,” “expects,”
“forecasts,” “goal,” “guidance,” “initiative,” “intends,” “may,” “outlook,” “plans,” “potential,” “predicts,” “project,” “pursue,” “seek,” “should,” “target,” “when,” “will,” “would,” and
variations of such words and similar expressions are intended to identify such forward-looking statements. Further, all statements, other than statements of historical fact
contained or incorporated by reference in this presentation that we expect or anticipate will or may occur in the future regarding our financial position, business strategy and
measures to implement that strategy, including changes to operations, competitive strengths, goals, expansion and growth of our business and operations, plans, references to
future success and other such matters, are forward-looking statements. Accounting estimates, such as those described under the heading “Critical Accounting Policies and
Estimates” in Item 7 of our Annual Report on Form 10-K for the year ended December 31, 2020 (“Form 10-K”), are inherently forward-looking. All forward-looking statements
are based on assumptions and analyses made by us in light of our experience and our perception of historical trends, current conditions and expected future developments, as
well as other factors we believe are appropriate in the circumstances. Forward-looking statements are not guarantees of performance, and the Company’s actual results may
differ materially from those expressed, projected or implied in or by the forward-looking statements.

You should not place undue reliance on these forward-looking statements, which speak only as of the date of this presentation. Forward-looking statements are subject to risks
and uncertainties, many of which are difficult to predict and generally beyond our control, that could cause actual results to differ materially from those expressed, projected or
implied in or by the forward-looking statements. These risks and uncertainties, among others, include: uncertainties regarding the extent and duration of impacts of matters
associated with COVID-19, including additional production disruptions; the failure to realize the expected benefits of the acquisition of Delphi Technologies PLC that the
Company completed on October 1, 2020; the failure to promptly and effectively integrate acquired businesses; the potential for unknown or inestimable liabilities relating to
acquired businesses; our dependence on automotive and truck production, both of which are highly cyclical and subject to disruptions; our reliance on major OEM customers;
commodities availability and pricing; supply disruptions; fluctuations in interest rates and foreign currency exchange rates; availability of credit; our dependence on key
management; our dependence on information systems; the uncertainty of the global economic environment; the outcome of existing or any future legal proceedings, including
litigation with respect to various claims; future changes in laws and regulations, including, by way of example, tariffs, in the countries in which we operate; impacts from any
potential future acquisition or divestiture transactions; and the other risks, including by way of example, pandemics and quarantines, noted in reports that we file with the
Securities and Exchange Commission, including Item 1A, “Risk Factors” in our most recently-filed Form 10-K and in our most recently-filed Form 10-Q. We do not undertake
any obligation to update or announce publicly any updates to or revisions to any of the forward-looking statements in this presentation to reflect any change in our expectations
or any change in events, conditions, circumstances, or assumptions underlying the statements.

© BorgWarner Inc.                                                                     2
INVESTOR PRESENTATION - FEBRUARY/MARCH 2021 - BORGWARNER
Propulsion Systems Leader, Well Positioned for the Future

▪ Executing balanced propulsion strategy
                                                 OUR VISION
                                                 A clean, energy-efficient world

▪ Track record of strong financial performance
   ▪ Consistent, sustained outgrowth
   ▪ Top quartile margins
   ▪ Strong cash flow generation
▪ Product leadership drives our business

 © BorgWarner Inc.                     3
INVESTOR PRESENTATION - FEBRUARY/MARCH 2021 - BORGWARNER
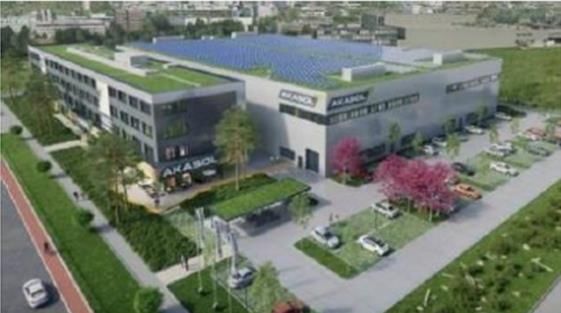
2020 Finishes Strong
                                                                                                                                           ▪ Organic revenue and outgrowth
              Net Sales                                          Adj. EPS*                                     Free Cash Flow*               ahead of expectations
       Outgrowth Ahead of
           Guidance
                                                           Solid Year Despite
                                                           Global Pandemic
                                                                                                              Above High End of
                                                                                                               Guidance Range
                                                                                                                                           ▪ Decremental margin in line with
       12.1% Adj.        9.7% Adj.                                                                                                           expectations, while continuing
       Op Margin*        Op Margin*
                                                                                                                                             to support future growth
                         $10,165

      $10,168
                          $9,045
                                                           $4.13                                              $699              $743       ▪ Record free cash flow
                                                                                                                                             generation
                                                                              $2.76
               630 BPS
               Outgrowth                                                                                                                   ▪ Completed Delphi Technologies
                                                                                                                                             acquisition
      FY 2019            FY 2020                         FY 2019            FY 2020                          FY 2019          FY 2020      ▪ Multiple new product awards for
           Delphi Technologies Sales                                                                                                         electrified vehicles

** Adj. operating margin, Adj. EPS and Free cash flow on this slide are non-US-GAAP measures. See reconciliation to US GAAP in Appendix.

© BorgWarner Inc.                                                                                        4
INVESTOR PRESENTATION - FEBRUARY/MARCH 2021 - BORGWARNER
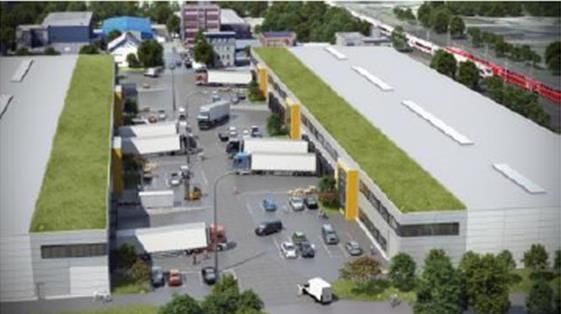
Expect Global Markets to Rebound in 2021
            BorgWarner Global Market                                                    North America                                  Europe                     China

            FY’20                          FY’21
            Actual                          Est.

                                      11% to 14%                                     FY’20                   FY’21            FY’20             FY’21    FY’20              FY’21
                                                                                     Actual                   Est.            Actual             Est.    Actual              Est.

                                                                                                        22% to 25%

                                                                                                                                            11% to 14%

                                                                                                                                                         0.5%             -2% to 1%

            -16.0%
                                                                                    -21.5%                                    -21.0%

Note: FY’20 Actuals are BorgWarner-weighted market assumptions based on January 2021 LV IHS and February 2021 CV On-Hwy IHS

© BorgWarner Inc.                                                                                   5
INVESTOR PRESENTATION - FEBRUARY/MARCH 2021 - BORGWARNER
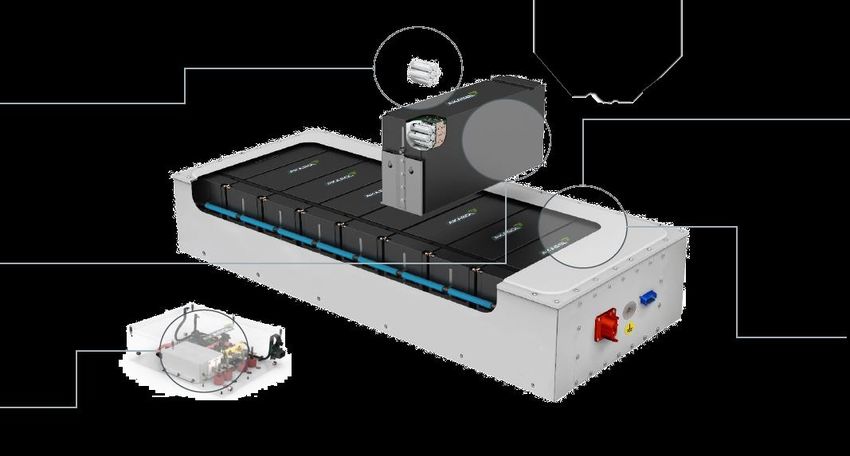
Integration on Track – Moving Forward as One BorgWarner
$ in millions

        Q4 2020 Sales & Adj.
         Operating Margin                                                                          Cumulative Cost
                                                                                                     Synergies

                              9.6% Adj.
                              Op Margin*

         3.8% to
        5.0% Adj.                                                                                                                        SiC Inverters
        Op Margin*

                               $1,120                                                                                 $90

         $950 to
         $1,000
                                                                                                   $15
        Guidance                Actual                                                            2020           Mid-point 2021
                                                                                                                    Estimate           GDi systems

 Delphi Technologies
                                                                                                 Synergies on                      Multiple program
 Q4 results ahead of
                                                                                                   schedule                       awards post signing
      guidance
** Adj. Operating Margin excludes synergies of $15 million and $13 million of purchase price amortization.

© BorgWarner Inc.                                                                                            6
INVESTOR PRESENTATION - FEBRUARY/MARCH 2021 - BORGWARNER
2021 Expected Sales Walk and Guidance
$ in millions

                Full-year Net Sales Outlook                                                                                           Net Sales Highlights

            2020 net sales                  $10,165
                                                                                         ▪          Global BWA LV/CV markets up ~11% to ~14%
                                                                                         ▪          ~100 to ~300 basis points of outgrowth
    Delphi Technologies
                                                                 $2,628
       pro forma impact
                                                                                                                          Earnings and FCF Highlights
     2020 pro forma incl.
                                                                                         ▪
                             8.3% Pro forma
                             Adj. Operating Margin    $12,793                                       Incremental margins in the low 20% range before
   Delphi Technologies**
                                                                                                    synergies and purchase price amortization
                       FX                                        $355
                                                                                         ▪          Delphi Technologies cost synergies benefit expected
                                                                                                    to be an incremental $70 to $80 million in 2021
      Market change and
                                                        $1,182          $1,522
                 pricing                                                                              ▪ Cumulative Synergies ~$85 to $95 million
  Backlog, mix & change
                                                                $370    $630
                                                                                         ▪          Adj. Diluted EPS ~$3.85 to $4.25*
    in Aftermarket sales
                                                                                         ▪          Free cash flow ~$800 to $900 million*
                             10.0% - 10.5%
            2021 net sales   Adj. Operating Margin*        $14,700        $15,300    * Adj. operating margin, Adj. diluted EPS and free cash flow on this slide are non-US GAAP measures. See reconciliation to US GAAP in Appendix.
                                                                                     ** On October 1, 2020 BorgWarner completed its acquisition of Delphi Technologies PLC (Delphi Technologies). The 2020 pro forma unaudited quarterly
                                                                                     financial information included herein includes the pro forma combined results of BorgWarner and Delphi Technologies for periods prior to October 1, 2020. The
                                                                                     pro forma financial information has been derived from the unaudited consolidated financial statements included in BorgWarner’s and Delphi Technologies’
                                                                                     Quarterly Report on Form 10-Q for the three and six months ended June 30, 2020 and does not give effect to the transaction on periods prior to October 1,
                                                                                     2020. The pro forma financial information is not necessarily indicative of either the actual consolidated results had the acquisition of Delphi Technologies
                                                                                     occurred on January 1, 2020 or of future operating results.

© BorgWarner Inc.                                                                7
INVESTOR PRESENTATION - FEBRUARY/MARCH 2021 - BORGWARNER
Awards Across Electrification Product Portfolio

                800-volt Electric Motor                       400-Volt Inverter                   High Voltage Coolant Heater
          ▪ with large global commercial               ▪ with a major European OEM              ▪ with major European premium
            vehicle EV customer launching                on next-generation BEVs                  OEM launching in 2023
            in 2024                                      expected to launch in 2022

 Integrated Drive Module (iDM)              Electric Drive Modules (eDM)                 800-Volt Inverter                        eTurbo™
▪ for Ford’s new all-electric             ▪ for electric JMC-Ford and two         ▪ with premium European OEM           ▪ with two European-based
  Mustang Mach-E SUV                        other NEV manufacturers in              on next-generation BEVs               OEMs expected to launch in
                                            China                                   expected to launch in 2024            2022 and 2023

© BorgWarner Inc.                                                      8
INVESTOR PRESENTATION - FEBRUARY/MARCH 2021 - BORGWARNER
Key European Inverter Wins Provide Scale
         BorgWarner Competitive Advantage        Inverters for 3 Key European OEM Programs

 ▪ Efficient speed to market with products                                          ~1.1M

   covering 400V SiC, 800V SiC, 48V
 ▪ Proprietary inverter power module design
 ▪ Vertical integration
     ▪ Power modules, integrated circuit
         development and full software
         capability in-house                     ~72K
 ▪ Scale in Electronics                          2022        2023        2024        2025

         Inverter wins expected to drive substantial future revenue growth

© BorgWarner Inc.                            9
INVESTOR PRESENTATION - FEBRUARY/MARCH 2021 - BORGWARNER
Significantly Higher Content Opportunities with Electrification

                                                          Combustion                                              Hybrid     Electric
        2025 BorgWarner                                                                                                      ~2.6X $$
     Content Opportunity Per
     Light Vehicle Summary                                                                                        ~2.0X $$

             Including Delphi
                                                                                                                               $2,427
                                                                                                                    $1,921

                                                                             $943

                         Market Volumes                                       52M                                    31M        11M
                            Addressable
                                                                             $49B                                    $59B       $26B
                              Market

Sources: BorgWarner TAM; IHS Markit, KGP. Excludes: Romeo Power Battery JV opportunities, Service & Aftermarket

© BorgWarner Inc.                                                                                   10
Electric Component Vehicle Sourcing
                    Electric Drive Motor                                               Gearbox

                                                                                   34%
                                       42%            Addressable                                                 Addressable
                             2025                                                        2025
                      58%                          outsourced market:                                          outsourced market:
                                                     $3.3B in 2025                                66%            $1.5B in 2025

                     OEM In-House      Suppliers                                  OEM In-House     Suppliers

                            Inverter                                     On-Board Charger, DC-DC Converter &
                                                                               Battery Pack Controller

                                    18%                                                          17%

                             2025                     Addressable                        2025                     Addressable
                                                   outsourced market:                                          outsourced market:
                                                     $4.4B in 2025                                               $7.2B in 2025
                         82%                                                          83%

                     OEM In-House      Suppliers                                  OEM In-House     Suppliers

© BorgWarner Inc.                                                   11
2025 EV Addressable Market Breakdown
                                                 $ in billions

  ▪ Power Electronics outsourcing strong
      increasing trend

  ▪ Motor outsourcing relatively flat through
      2025

  ▪ Sub-components insourced market
      represent additional opportunity

  More 70% of Electric Vehicle Addressable
    Market Expected to be Outsourced

© BorgWarner Inc.                           12
Journey to Advanced Electrification and Propulsion
Complementing Organic Growth with Acquisitions

2015                          2016                          2017                              2018                           2019                               2020

Acquired rotating electric      Acquired industrial-         Acquired propulsion      60/40 JV added battery
business to integrate with         focused power            inverters and controls      packs and module
   existing powertrain          electronics portfolio    businesses for HEVs / EVs         management            Acquired industry-leading power electronics, software,
       technology                                       in specialty and commercial         capabilities                   calibration capabilities, and scale
                                                               vehicle sectors

                                                                                                                Combined Inverter        On Board         Battery Pack
                                                                                                               and DC/DC Converter       Charger           Controller

      Acquired Capabilities

© BorgWarner Inc.                                                        13
Acquisition of Delphi Technologies Expected to
Strengthen Propulsion Systems Leadership
              Pro Forma Adj. Margin Outlook
             Meaningful EPS Accretion Expected

  ▪ Reinforces leadership in electrified
      propulsion systems

  ▪ Increases electronics and power
      electronics scale, technology, talent and
      adds to system capabilities

  ▪ Enhances combustion, commercial vehicle,
      and aftermarket businesses, resulting in
      more balance across light and commercial
      vehicles as well as the aftermarket

© BorgWarner Inc.                                14
Strengthens Combustion Leadership

                            so                                        so
               Boosting          Exhaust Gas        Fuel Assembly /        Engine / Transmission
             Technologies        Management            Delivery                 Controllers

         Air Path, Mechanical, and All                    Fuel Injection and
                 Wheel Drive                                 Electronics
Representative Examples

© BorgWarner Inc.                              15
Strengthens Scale and Expertise in Electrification
                                                                                                              Representative iDM Example

 Mechanical, clutching, and      Award-winning motors provide        Leadership in power electronics,
hydraulic controls expertise      industry leading technology            software, and controls

eGearDrive® Transmission           Electric Drive Motor                High Voltage Inverter            Integrated Drive Module (iDM)

                          Well positioned to take advantage of future propulsion migration

  © BorgWarner Inc.                                             16
Sustaining Top-Quartile Margin Performance
                                                                     Pro Forma Adj. Margin Outlook

                                                                                                                                                                             Pro Forma

                                          12.1%
                                                                                                                                                                             >11%(1)

                                                                                                            7.2%

                                   2019 Adjusted                                                     2019 Adjusted                                                      Pro Forma with
                                 Operating Margin(2)                                               Operating Margin(2)                                                    Synergies

                                                  BorgWarner expects to remain among the strongest,
                                                      most profitable companies in our industry
1. Includes estimated purchase accounting of $55 million to $60 million for incremental depreciation and amortization related to acquired PPE and intangibles and includes $175 million of run-rate cost synergies.
2. Reconciliation of Adjusted Operating Margin in Appendix.

© BorgWarner Inc.                                                                                            17
Acquisition of Leading Battery Systems Provider

  BorgWarner’s acquisition of AKASOL will strengthen its electric propulsion systems leadership

  ▪       Battery Systems is a key element of BorgWarner’s e-growth strategy

  ▪       AKASOL is a leader in high-performance battery system solutions for electric vehicles

  ▪       AKASOL has highly flexible battery technology across multiple cell architectures

  ▪       AKASOL has proven technologies and products with established manufacturing facilities already
          in serial production today

  ▪       AKASOL has a strong order backlog of approximately $2.4B1 primarily from leading OEMs

  ▪       AKASOL products serve CV and Off-highway applications, which aligns with BorgWarner’s goal to
          increase its electrification portfolio across both LV and CV markets
1. Backlog based on latest AKASOL public disclosure of €2.0B as of Q2 2020 using $1.20 USD to Euro exchange rate.

© BorgWarner Inc.                                                                                       18
Global Footprint with Production-Ready Capacity
State-of-the-art manufacturing facilities

                Langen                       Darmstadt                         Hazel Park

  Completed capacity expansion          New HQ with 1 GWh of           New US facility to support
    to support future growth              installed capacity           North American customers

                1.0 GWH          2020                          2022     4.7 GWH
             Production Output                                        Production Output

 © BorgWarner Inc.                          19
Flexible Battery Technology Across Cell Types
Integrated battery solutions for any kind of commercial vehicle
          Cell Architectures

             Pouch Cell / POC               Prismatic Cell / PRC     Cylindrical Cell / CYC

                     Cell                                                          System
   Highly selective process allows AKASOL
   to use only the top-tier quality cells                          Reliable and robust system design with
                                                                   various industry compliances

                   Module
   Highly functional and scalable module
   design with liquid cooling                                                    Smart BMS
                                                                   AKASOL’s BMS offers a complete
                Accessories                                        solution for monitoring and controlling
   Development and supply of various                               complex battery systems
   accessories

 © BorgWarner Inc.                              20
Technology Leading Position in Energy Density
Ultra-High-Energy System in Gravimetric and Volumetric Energy Density

                                                                                                                                                                             Gen X
                                                                                                                                                                          (in development)
Gravimetric energy density (Wh/kg)

                                                                                                                               Gen 3 (Format Agnostic)
                                                                                                                                      (SOP: Q4 2021)
                                                                                               Competitor #2

                                                                                                                                         Competitor #4
                                                                           Competitor #3

                                                                 Competitor #2                                           Competitor #4
                                                                                                    Competitor #3
                                              Competitor #1                                                                                                 Gen 1 & 2 Track-records
                                                     Competitor #2                                                                                       6,800 Produced         544,000,000 Km
                                                                                  Gen 2                                                                  Serial Systems        Electric Range Sold
                                                                                 (SOP: 2020)

                                     Latest model    Previous models                                 Volumetric energy density (Wh/l)
      Note(s): Company information as of November 2020. Gravimetric represents amount of energy stored in given mass. Volumetric represents
               amount of energy stored in given volume.
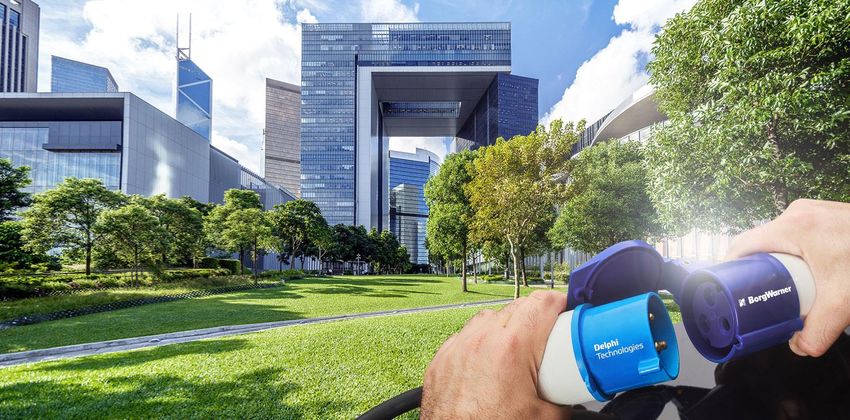
                        © BorgWarner Inc.                                                                      21
Potential for Significant, Long-Term Growth
             Significant TAM Opportunities                                                                                                       Projected Revenue

    Global Lithium-ion Battery Systems                                                                                                                  Opportunity for Profitable
    Market for Electric Vehicle in 2030E1                                                                                                                       Growth

                               ~$140B                                                                                                                                          ~$1.0B

       Near-term Focus on:                                                                                                                             ~$500M
                                                                                                                 ~7% EBITDA Margin

                                                                                                                                                       70%+
               Europe and North America                                                                                  ~$150M                       Booked
                   CV / Off-Highway2

                                 ~$10B                                                                                    2021E 3                      2024E 4                 2030E 4

Source: IHS and management forecast.
1 Global EV and hybrid lithium-ion battery systems market for all vehicles in 2030E.
2 2030E estimate includes Class 4+ Truck & Bus, Material Handling, Construction & Mining, Rail and Marine segments.
3 2021E in line with average broker consensus as of 12 February 2021 using $1.20 USD to Euro exchange rate.
4 Based on BorgWarner’s diligence of AKASOL management plan for 2024 and BorgWarner’s estimate of 2030E using $1.20 USD to Euro exchange rate.

  © BorgWarner Inc.                                                                                   22
Complements BorgWarner’s Electrification Capabilities
                          BorgWarner’s Product Offerings Across Full Suite of Electrification Capabilities

          E-Motors & Gearboxes                          Power Electronics                Battery Pack Systems

                                                                   Combined
                              eGearDrive®                          Inverter and
                              Transmission                         DC/DC
                                                                   Converter

                              Electric Drive                       On Board
                              Motor                                Charger

                                                                                                  60/40 JV

                    Continued Organic and Inorganic Investments in Powertrain Electrification
Representative Examples

© BorgWarner Inc.                                           23
Commitment to Sustainability
          Create a cleaner, more             Live the                              Partner with and report
          energy-efficient world             BorgWarner Beliefs                    to stakeholders

 Products that drive clean mobility   Fostering talent and diversity        Responsibility in our supply chain
 • > 80% revenue from electric,       • CEO Action for Diversity &          • Supplier sustainability training
   hybrid, and emissions-reducing       Inclusion™ signatory                  and assessment programs
   combustion parts
                                      • ~58,000 hours of employee
                                        training in 2019

 Leading environmental targets        Top-quartile worker safety rate       Transparency in our reporting
 • 50% carbon and 37% energy                                                • SASB, TCFD, and GRI aligned
                                      • 75% improvement in total incident
   intensity reductions by 2030                                               reporting
                                        rate over the past decade
   from 2015

                    Delivering our vision of a clean, energy-efficient world

© BorgWarner Inc.                                24
Sector-leading targets to reduce our
Create a cleaner,
 more energy-
 efficient world      environmental footprint
   Operations environmental goals
   •   50% greenhouse gas intensity reduction     GHG: 50% Reduction by 2030   Energy: 37% Reduction by 2030
       by 2030 from 2015 baseline
   •   37% energy intensity reduction by 2030
       from 2015 baseline
   •   Maintain 100% ISO 14001 certification
       at all of our manufacturing facilities
   •   Annual water risk assessment of
       facilities and target high and extremely
       high-risk locations
       for reduction
   •   Benchmark and disclose our baseline
       waste generation and establish a
       diversion goal in 2021

       © BorgWarner Inc.                                  25
Appendix
Combined Capabilities Across Propulsion Types

             Boosting                 All Wheel Drive &          Engine Timing
           Technologies              Cross Axle Systems            Systems
                                                                                                                                                           High Voltage Battery /    eGearDrive®         Battery Module
                                                                                    eBooster® electrically                            P2 Hybrid Modules
                                                                                                                                         On / Off Axis        Coolant Heater         Transmission
                                                                                     driven compressor Integrated Belt Alternator
                                                                                                            Starter Systems
                       Exhaust Gas                      Starters &
                       Management                       Alternators

                                                                                   Dual Clutch
             Thermal                   Transmission          Variable Valvetrain                                                            Electric All                            Electric Drive      Power Electronics
                                                                                    Modules         Turbochargers     Power Electronics                      Electric Drive Motor
            Management                 Technologies               Systems                                                                   Wheel Drive                                Module

                                               Smart Remote
          Fuel Assembly / Delivery                                       Engine Controller                Inverters         Combined Units           Battery Pack Controller        Local Controllers   Software & Calibration
                                                 Actuator

                                                                      Transmission Controllers
                   Canisters         Engine Air Control Valve                                          DC-DC Converter              On-Board Chargers      Domain Controllers        Power Modules        Application-Specific
                                                                                                                                                                                                          Integrated Circuits
Note: Representative selection of product portfolios.

© BorgWarner Inc.                                                                                    27
Fourth Quarter and Year-to-Date Reconciliation to US GAAP
Adjusted Earnings Per Diluted Share
The Company defines adjusted earnings per diluted share as earnings per diluted share adjusted to eliminate the impact of restructuring expense, merger, acquisition and
divestiture expense, other net expenses, discontinued operations, other gains and losses not reflective of the Company's ongoing operations, and related tax effects.

                                                                                         Three Months Ended                  Year Ended
                                                                                            December 31,                    December 31,
                                                                                             2020           2019           2020           2019

                                   Earnings per diluted share                            $      1.52    $      1.06    $      2.34    $      3.61

                                   Non-comparable items:
                                    Restructuring expense                                       0.53           0.11           0.86           0.26
                                    Merger, acquisition and divestiture expense                 0.13           0.01           0.38           0.05
                                    Intangible asset accelerated amortization                   0.13             -            0.14             -
                                    Amortization of inventory step-up                           0.09             -            0.10             -
                                    Asset impairment and loss on divestiture                      -            0.03           0.08           0.03
                                    Net gain on insurance recovery for property damage            -              -           (0.04)            -
                                    Unfavorable arbitration loss                                  -              -              -            0.07
                                    Officer stock awards modification                             -              -              -            0.01
                                    Gain on derecognition of subsidiary                           -           (0.02)            -           (0.02)
                                    Unrealized gain on equity securities                       (1.26)            -           (1.36)            -
                                    Delayed-draw term loan cancellation                           -              -            0.01             -
                                    Pension settlement loss                                     0.02             -            0.02           0.10
                                    Tax adjustments                                             0.02          (0.02)          0.23           0.02

                                   Adjusted earnings per diluted share                   $      1.18    $      1.17    $      2.76    $      4.13

© BorgWarner Inc.                                                              28
FY’20 and FY’21 Free Cash Flow to Reconciliation to US GAAP
The Company defines free cash flow as net cash provided by operating activities minus capital expenditures, including tooling outlays. The measure is useful to both management
and investors in evaluating the Company’s ability to service and repay its debt.

                                                                                     Three Months Ended       Year Ended
                                                                                        December 31,         December 31,
                                                                                      2020        2019      2020      2019
                         Net cash provided by operating activities                  $     376 $       184 $   1,184 $    1,008
                         Derecognition of subsidiary                                       -          172       -          172
                         Capital expenditures, including tooling outlays                 (179)       (135)     (441)      (481)
                         Free cash flow                                             $     197 $       221 $     743 $      699

                                                                                         Full Year 2021 Outlook
                                                                                            Low         High
                                         Net cash provided by operating activities       $     1,450 $    1,600
                                         Capital expenditures, including tooling outlays        (650)      (700)
                                         Free cash flow                                  $       800 $      900

© BorgWarner Inc.                                                              29
Adj. Operating Income Reconciliations
($ in millions)

                                                    Twelve                                                 Twelve
                                                 Months Ended                                           Months Ended
    BorgWarner                                   December 31,     Delphi Technologies                   December 31,
                                                     2019                                                   2019
   Sales                                         $     10,168     Sales                                 $       4,361

   Operating income                              $      1,303     Operating income                      $         141
   Operating margin %                                   12.8%     Operating margin %                             3.2%

   Non-comparable items:                                          Non-comparable items:
   Restructuring expense                                   72     Restructuring expense                            80
   Merger, acquisition and divestiture expense             11     Separation and transformation costs              44
   Officer stock awards modification                        2     Asset impairments                                35
   Unfavorable arbitration loss                            14     Pension charges                                  14
   Gain on derecognition of subsidiary                   (177)    Adjusted operating income             $         314
   Asset impairment and loss on divestiture                 7     Adjusted operating income margin %             7.2%
   Adjusted operating income                     $      1,232
   Adjusted operating income margin %                   12.1%

© BorgWarner Inc.                                            30
FY’21 Adj. Operating Income and Adj Operating Margin
Reconciliation to US GAAP

                                                                      Full Year 2021 Guidance
                                                                        Low            High

                    Net Sales                                     $       14,700   $     15,300

                    Operating income                              $        1,260 $        1,450
                    Operating margin                                        8.6%           9.5%

                    Non-comparable items
                    Restructuring expense                         $          200   $        150
                    Merger, acquisition and divestiture expense               10             10

                    Adjusted operating income                     $        1,470 $        1,610
                    Adjusted operating margin                              10.0%          10.5%

© BorgWarner Inc.                                    31
FY’21 Adj. Earnings per Diluted Share Reconciliation to US GAAP

                                                                       Full Year 2021 Guidance
                                                                          Low          High

                    Earnings per diluted share                         $     3.23   $      3.77

                    Non-comparable items:
                         Restructuring and other expense                     0.58          0.44
                         Merger, acquisition and divestiture expense         0.04          0.04

                    Adjusted earnings per diluted share                $     3.85   $      4.25

© BorgWarner Inc.                                    32
Key Definitions
    The terms below are commonly used by management and investors in assessing
    ongoing financial performance:

    ▪ Organic Net Sales Change. BorgWarner net sales change year over year excluding
        the estimated impact of foreign exchange (FX) and net M&A.

    ▪ Market. For 2020, light vehicle production weighted for BorgWarner's geographic
        exposure as estimated by BorgWarner. For 2021, light and commercial vehicle
        production weighted for BorgWarner’s geographic exposure as estimated by
        BorgWarner.

    ▪ Outgrowth. For 2020, BorgWarner's “Organic Net Sales Change” vs. year-over-year
        change in “Market”. For 2021 “Organic Net Sales Change” excluding Aftermarket
        segment vs. year-over-year change in “Market”.

© BorgWarner Inc.                           33
You can also read