Kongsberg Automotive Investor Presentation - September 2019
←
→
Page content transcription
If your browser does not render page correctly, please read the page content below
Kongsberg Automotive
Investor Presentation

September 2019

Kongsberg Automotive
Forward-Looking Statements and Non-IFRS Measures

Forward-Looking Statements

This presentation contains certain “forward-looking statements”. These statements are based on
management’s current expectations and are subject to risks, uncertainty and changes in circumstances,
which may cause actual results, performance, financial condition or achievements to differ materially from
anticipated results, performance, financial condition or achievements. All statements contained herein that
are not clearly historical in nature are forward-looking and the words “anticipate,” “believe,” “expect,”
“estimate,” “plan,” and similar expressions are generally intended to identify forward-looking statements. We
have no intention and are under no obligation to update or alter (and expressly disclaim any such intention or
obligation to do so) our forward-looking statements whether as a result of new information, future events or
otherwise, except to the extent required by law. The forward-looking statements in this presentation include
statements addressing our future financial condition and operating results. Examples of factors that could
cause actual results to differ materially from those described in the forward-looking statements include,
among others, business, economic, competitive and regulatory risks, such as conditions affecting demand for
products, particularly in the automotive industries; competition and pricing pressure; fluctuations in foreign
currency exchange rates and commodity prices; natural disasters and political, economic and military
instability in countries in which we operate; developments in the credit markets; future goodwill impairment;
compliance with current and future environmental and other laws and regulations; and the possible effects on
us of changes in tax laws, tax treaties and other legislation. More detailed information about these and other
factors is set forth in the 2018 Kongsberg Automotive Annual Report and the Kongsberg Automotive Quarterly
Reports.

Non-IFRS Measures

Where we have used non-IFRS financial measures, reconciliations to the most comparable IFRS measure
are provided, along with a disclosure on the usefulness of the non-IFRS measure, in this presentation.

                                                                                                                 2
Today’s Presenter

 Henning Jensen, Chief Executive Officer

                       Professional experience
                       Kongsberg Automotive
                       President and Chief Executive Officer
                       June 2016 - Present

                       Kistefos AS
                       Chief Executive Officer
                       2011 - 2015

                       RHI AG
                       Chief Executive Officer, Chief Financial Officer and
                       Chairman
                       2010 – 2011

                       Tyco Electronics
                       SVP, Divisional Head (Automotive), Chief Financial
                       Officer (Electronic Components) and other senior
                       level management positions
                       2001 – 2009

                       General Motors
                       Managerial and executive positions
                       1995 – 2001

                       Education
                       Hochschule St. Gallen (Switzerland)
                       Doctoral Studies
                       University of San Francisco (USA)
                       BA & MBA

                                                                              3
Kongsberg Automotive at a glance

                                         Overview                                                                            Selected KPIs
     ➢         Headquartered in Zurich, Switzerland and listed on the Oslo stock
                                                                                                     Revenue                                    Adj. EBIT
               exchange                                                                   (2017A / 2018A / 2019Q2 LTM)                (2017A / 2018A/ 2019Q2 LTM)
     ➢         3 segments: Interior, Powertrain & Chassis, Specialty Products

          ▪    Interior: interior comfort systems and light duty cables                   1,057mm / €1,123 mm / €1,148mm                 €50mm / €75mm/ €76mm

          ▪    Powertrain & Chassis: gearshift systems and vehicle dynamics
               applications                                                              Revenue growth / Adj. EBIT growth
                                                                                                                                       Booked business / Revenue
                                                                                           (2017A-2018A & 2018Q2 LTM-
                                                                                                   2019Q2 LTM)                      (avg. 2016A, 2017A, 2019Q2 LTM)
          ▪    Specialty Products: air couplings, FTS and off-highway applications

     ➢         We estimate that approximately one out of five LD or HD vehicles
                                                                                            6% / 49%         &      6% / 23%                        1.4x
               contain our products

     ➢         Diverse customer and end-market exposure

                                                                           2018A revenue breakdown

                     By geography                             By customer                          By end-market                               By channel
                                                                                                                                               Heavy
                                                                                                          Heavy                              Equipment Other
 South                  Other                                                                           Equipment    Other                       3%     8%
America                 2%                                          11%                                    3%
              Asia                                                                                                    9%             Power Sports
  2%                                                                                                                                     7%
              12 %                                                      9%                                                                                   OE LDV
                                                        Others                           Power Sports
                                                                         6%                                            LDV           Aftermarket              51%
                          Europe                         45%                                 7%
                                                                         6%                                            53%               6%
      North                50%
     America                                                            5%
                                                                       4%                           HDV                                                    Total OE
      34 %                                                     3%    4%                                                                   OE HDV
                                                                  3%4%                              28%                                                      76%
                                                                                                                                           25%

                                                                          Total revenue 2018A: €1,123mm

                                                                                                                                                                      4
Kongsberg Automotive history
                                                                                                                                      2016 the major turning point
    SP        Speciality Products          ▪    Sale of North American
                                                Headrest and Armrest       Int.

P&C
                                                business                                        Step change                           ▪     Starting from a period of low growth post Teleflex acquisition,
              Powertrain & Chassis                                                                      2018
    Int.
                                           ▪   Operational HQ moved to Zurich                                                               Kongsberg Automotive initiated a number of changes in 2016
              Interior
                                                                                                     2017
                                                                                                                        ▪
                                           ▪   Sale of Aviation business                                                    Sale of
                                                                                                                            ePower
                                                                                                                                          – Elected New Board of Directors
                                                                                                2016
                                                                                                                                          – Changed majority of senior management
                                                                               Low growth
                                                                                                             ▪   Establishment of
                                                                                          2012                   improvement              – Initiated operational improvements taking out costs and
▪       Acquisition of Teleflex GMS                  SP
        (systems for gear shift,                                                                                 program and hiring
        seat comfort and fluid systems)        P&C        Int.                                                   of new                     planning closure of plants
                                                                                    2009                         management team
                                                                                                                                          – Implemented organizational changes creating a new
                                                                                                        ▪   Electronic Center of
▪       Acquisition of couplings
                                                                               2008                         Excellence established          structure
                                       SP                                                                   in Canada
        producer Raufoss United
                                                                       2005                                                               – Focused market approach
▪       Production in China established                                                     ▪    Acquisition of Milan
                                                                                                                              Int.
                                                                                                 Seating Systems                          – Cleaned up product portfolio
                                                                 2004
                                                                                            ▪    Listed on the Oslo stock exchange
    ▪      Production of seat
           heating in Mexico
                                                                                                                                          – Changed the legal structure
           begins                                         2001
                                                                                                                                          – Moved the headquarters
                                                                                    ▪   Acquisition of Jung Ang, the
                                                  2000                                  leading producer of clutch            P&C
▪       Kongsberg                                                                       servos in Korea                                   – Started the transition to become a company with a
        Våpenfabrikk
        starts production                  1999                                                                                             performance based culture
        of brakes for
        Volvo trucks                                                       ▪    Technology center for gearshifts established in
                                                                                the USA
                                1987                                       ▪    Production established in Poland

                                                                                         Select M&A and disposals
                     1957              ▪    Kongsberg Automotive is
                                                                                         Change in ownership
                                            established
                                                                                         Foundation/Internalisation/Restructuring

                                                                  Kongsberg Automotive is on track to deliver on its targets

                                                                                                                                                                                                         5
Kongsberg Automotive benefits from a well
      diversified customer base
                                                                                                                                                                        Contribution of top 10 customers
Share of KA’s Total Revenue
11%                                                                                                                                                                                               Top 10
                                                                                                                                                                                                 customers
10%                                                                                                                                                                                                ~55%

 9%
                                                                                                                                                                           Revenue 2018A: €1,123mm
 8%

 7%

 6%
            10,6%
 5%
                           8,6%
 4%

 3%                                       6,1%          5,8%
                                                                       5,2%
 2%                                                                                  4,4%          4,2%           4,1%
                                                                                                                                3,3%
                                                                                                                                               2,8%          2,5%
 1%                                                                                                                                                                        2,2%           2,0%      2,0%

 0%
                                                1

                                                                                    OEM customers                 Tier1 customers2

                                                                              Single customer exposure is limited

  1   Product portfolio of Bombardier Recreational Products (BRP) includes snowmobiles, watercrafts, on-and off-road vehicles and engines for karts, motorcycles and recreational aircrafts
  2   For Tier 1 customers the products go to a wide variety of OEMs
                                                                                                                                                                                                             6
New business wins - Group
 Booking momentum remains despite softening markets

New business wins per quarter (per annum revenues)                                       New business wins per quarter (lifetime revenues*)
MEUR                                                                                     MEUR
 140
                                                                                           600                                                     561
                                  122             121                                                                      537
 120                                                                             110
                                                                                           500                                             459                             463
                                                          99
 100
                                                                                           400
                                                                  77                                       349                                             338     339
  80               71                                                                                                              323
                                          66                              65                                       288
                          62                                                               300
  60

           36                                                                              200
  40                                                                                               139

  20                                                                                       100

   0                                                                                          0
         Q1-17 Q2-17 Q3-17 Q4-17 Q1-18 Q2-18 Q3-18 Q4-18 Q1-19 Q2-19                               Q1-17 Q2-17 Q3-17 Q4-17 Q1-18 Q2-18 Q3-18 Q4-18 Q1-19 Q2-19

New business wins LTM (per annum revenues)                                               New business wins LTM (lifetime revenues*)
MEUR                                                                                     MEUR
 420                                                     409                              2,000
                                                                                                                                                   1,880
 390
                                                                                          1,800
                                                  372                                                                                                              1,697   1,701
                                                                 364     363                                                                               1,681
 360                                                                             352                                                       1,607
                                                                                          1,600
                                                                                                           1,485                   1,497
 330                                                                                               1,435           1,429
                                          321
                                                                                          1,400
                                                                                                                           1,312
 300              292     288     291
          281                                                                             1,200

  0                                                                                            0
         Q1-17 Q2-17 Q3-17 Q4-17 Q1-18 Q2-18 Q3-18 Q4-18 Q1-19 Q2-19                               Q1-17 Q2-17 Q3-17 Q4-17 Q1-18 Q2-18 Q3-18 Q4-18 Q1-19 Q2-19
       *Lifetime revenue assumptions are based on IHS and LMC production estimates at the time of the booking.                                                                   7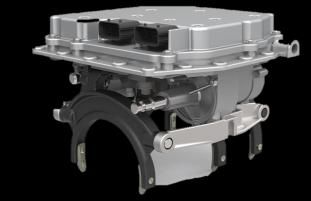
Revenues and Adjusted EBIT
Revenue and adj. EBIT figures have improved substantially over the last
years

Revenues                                                             Adjusted EBIT
MEUR                                                                 MEUR and percent

                  2016         2017      2018        2019                               2016             2017              2018            2019

                                                                           7.0%                    7.2%                                             7.2%
            307                                                      7.0%
      288                                                                                          6.9%
   280                  288 294                               288    5.4%
                                                                                                                           5.1%                     4.8%
                                                                                                          5.2%
                     268                                267
257                                            259                         4.9%                                            3.2%                     3.0%
                  251                    241         250                                                  3.6%
                                      228
                                                                                    21.5             20.8 20.4
                                                                             20.1                                                                    20.7
                                                                                                                           -0.3%

                                                                       15.2
                                                                                                13.9
                                                                    12.6                                                      13.1              13.0

                                                                                             9.1
                                                                                                                           7.7               7.4

                                                                                                                    -0.8
      Q1                  Q2               Q3               Q4              Q1                       Q2                    Q3                       Q4

Revenues including HRAR                                                    EBIT adjusted for restructuring - see details in the quarterly report.

                                                                                                                                                            8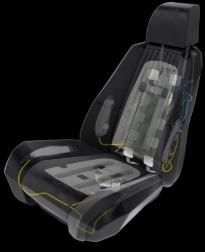
EBIT and Net Income
  Net Income continues to grow YoY driven by fundamentals and reduction
  of restructuring expenses
       EBIT                                                          Net Income
       MEUR                                                          MEUR

   2016             2017      2018        2019

             20.3
                                19.2
                                                              17.9

       14.8                15.0
14.1                                                                              13.8
                       12.7                                           13.0

                    10.5
                                                                               9.7
   8.0                                                                                                                                 7.7
                                                6.2                                      5.7
                                                                                                           4.9
                                                                                                     4.2
                                                            3.3                                2.9
                                                      1.6                                                                 2.1
                                         -0.2                            0.2                                        0.3
        Q1                 Q2                 Q3             Q4              Q1                 Q2                      Q3             Q4

                                       -5.0

                                                                                                                                -7.4

                                                                                                                 -9.9
                                                                                                                                   -11.3
                                                                                                                                             9
Historical financials overview

  Revenue performance (€mm)                                                                                   Key financials (€mm)
                                                                                                              P&L                                                          Actuals

     1200
                                                                                                              €mm                              FY 2016         FY 2017         FY 2018 LTM Q2 2019
                                                                                           1148
     1150                                                            1123
                                                                                                              Revenue                               986           1,057           1,123      1,148
     1100
                                          1057
     1050

     1000
                   986                                                                                        % growth                           (3.0%)            7.2%              6.2%      NA
      950

      900                                                                                                     Adj. EBITDA                            73              92               110      116
      850

      800

      750

                                                                                                              % margin                            7.4%             8.7%              9.8%   10.1%
      700

                FY 2016                 FY 2017                  FY 2018              LTM Q2-2019

  Adj. EBITDA performance (€mm)                                                                               Adj. EBIT                              28              50                75       76

                 7.4%                    8.7%                        9.8%                 10.1%               % margin                            2.9%             4.7%              6.7%    6.6%
                                                                                          116
                                                                     100
    100                                   92                                                                  Capex                                 (51)            (53)             (68)     (69)

     80            73
                                                                                                              % of revenue                       (5.2%)          (5.0%)          (6.1%)     (5.9%)
     60

                                                                                                              Adj. EBITDA - Capex                    22              40                42       47
     40

     20                                                                                                       % cash conversion                  29.7%           43.0%           38.0%      40.5%

      0

               FY 2016                 FY 2017                   FY 2018             LTM Q2 2019              Change in NWC1                         (3)            (27)             (17)     (49)

     %        EBITDA margin (%)
1 Defined   as Trade receivable + Inventories – Trade payable;   2   Includes the divested HRAR business accounting for €42mm revenue in 2016 and one quarter of €10mm revenue in 2017
                                                                                                                                                                                                 10
Financial ratios
Adjusted gearing ratio (NIBD/EBITDA, LTM*) Adjusted ROCE* (%, LTM)
Incl. IFRS 16 effect Incl. IFRS 16 effect
3.0 3.0
2.2 2.2 2.3 13.9 15.3 14.9 13.8 14.0 13.2
2.1 1.9 13.1
Q2 2018 Q3 2018 Q4 2018 Q1 2019 Q2 2019 Q2 2018 Q3 2018 Q4 2018 Q1 2019 Q2 2019
Equity Ratio** (%) Capital Employed (MEUR)***
Incl. IFRS 16 effect Incl. IFRS 16 effect
634 636
31.3 32.6 32.9 510 515 523 542 545
30.2 30.9 29.3
29.0
Q2 2018 Q3 2018 Q4 2018 Q1 2019 Q2 2019 Q2 2018 Q3 2018 Q4 2018 Q1 2019 Q2 2019
* Excluding restructuring costs; ** Q2 2018 has accounted for the ~MEUR 40 equity increase; *** Capital employed at end of quarter
11Bond pricing and summary
Bond price development Bond summary
Issuer: Kongsberg Actuation Systems B.V.
103
Issue: Senior secured notes (“the Notes”)
Amount: €275mm
100 Maturity: 7 years
101
Expected corporate
Ba3 / B+ // Ba3 / BB-
// issue ratings:
99 Call protection: Non-callable for 3 years
◼ T + 50 bps make whole during non-call period
Optional
◼ Equity claw-back allowing redemption of up to 40% of the Notes, at a premium equal
redemption:
to par plus the coupon, with the proceeds of an equity issue during NC period
97
Refinance existing indebtedness, transaction fees and expenses and general corporate
Use of proceeds:
purposes (which may include acquisitions)
The Notes will be senior obligations of the Company and will rank pari passu with all present and
95 Ranking:
future senior indebtedness (provided that the SSRCF and certain hedging obligations will receive
proceeds from enforcement on the collateral in priority to the Notes under the Intercreditor
Agreement)
Pledges over the shares of the Issuer and all Guarantors (other than Kongsberg Automotive
93
Security: ASA), as well as a security assignment of intercompany loan receivables by the Issuer and the
Guarantors
The Notes will contain customary covenants for corporate bond financings. Covenants will
91 particularly include:
◼ Limitation on Indebtedness
◼ Limitation on Liens
Covenants:
◼ Limitation on Restricted Payments
89 ◼ Limitations on Payment Restrictions Affecting Restricted Subsidiaries
◼ Limitation on Sales of Assets
◼ Limitation on Affiliate transaction
Distribution: Reg S, 144A for life
87
Governing law: New York law
Listing: The International Stock Exchange
85 Sole Global
Coordinator and
J.P. Morgan Securities plc
Physical
Bookrunner:
Joint Bookrunner: Danske Bank 122019 Outlook
13Passenger Car Unit production estimates are declining
The main driver is the Chinese market
CMD 2018 September 2019
1.9% -4.3%
98.3 95.2 94.2
100 95.2 96.4 90.1
2.6 2.6 2.6
2.6 2.7 3.8 3.3 3.4 2.0 Rest of World
3.3 3.6 3.4 South America
17.1 17.1 17.0
80 17.1 17.1 16.6 North America
Units in millions
22.4 22.7 22.0 22.0
60 22.0 21.4 Europe
40 22.2 22.4 22.8 22.2 22.4
21.8 APAC w/o China
20
28.0 28.3 29.4 28.0 26.9 24.9 China
0
2017 2018 2019 2017 2018 2019
Source: IHS September 2019 Source: IHS August 2019
-8.3%
14How our business works – margin perspective
General Process
RfQ Award SOP EOP
% Margin
“New programs” “Mature Programs”
Time
(Illustrative example)
15Revenue Projections
KA Group Revenue– Illustrative example by product status
➢ The product/model cycles in the automotive
industry vary from three to ten years, primarily
1.800 depending on the end-market. For KA, the
average length of a program is somewhere
1.600 between five to seven years.
2019
1.400
➢ Reported new business wins turn into revenue
1.200 with delay of up to two to three years, depending
on the customer nomination process and
1.000 development requirement.
800 ➢ Given the current and booked programs, the
€ revenue is, to a large extent, «set» well ahead in
600
the future, but still depends on market
development of end customers products.
400
200 ➢ Our revenue projection for the out years includes
business not yet booked which we will compete
0 for. However, such non-booked projected
Time revenues have been dicounted with a success
factor.
Existing business Booked business Estimated Business Wins
A high level of revenue projections are backed up by current and booked programs
16Market decline leads to an increasing share
of “new programs”
CMD 2018 Update Impact on KA Financials
1,357 ▪ Declining markets typically
1,271 affect mature programs rather
1,194 than new programs
1,123 ~25% ▪ Unusual high share of “new
(318) ~27% programs” offsets the market
(318) driven decline in the mature
products. However, this leads
Margin to an unfavorable mix effect
Differential on margin.
~ 10% ▪ We estimate the margin
impact to be €3m from 2018-
~75%
2019.
~73%
(953)
(876)
2018 2019 2020 2019
Mature programs New programsFinancial overview
2019 Outlook Development
2019 AGM / May 15 Current outlook / Sept 4
2018 CMD
Update Update
In Mill. Euro 2017 2018 2019 In Mill. Euro 2017 2018 2019 In Mill. Euro 2017 2018 2019
Sales 1.057 1.128 1.271 Sales 1,057 1,123 1,220 Sales 1,057 1,123 1,194
EBIT adj. 50 75 97 EBIT adj. 50 75 82 EBIT adj. 50 75 78
% of sales 4,7% 6,6% 7,6% % of sales 4.7% 6.7% 6.8% % of sales 4.7% 6.7% 6.5%
Restructuring & One Off cost -26 -20 -7 Restructuring & One Off cost -26 -21 -7 Restructuring & One Off cost -26 -21 -7
EBIT 24 55 90 EBIT 24 54 75 EBIT 24 54 71
% of sales 2,2% 4,9% 7,1% % of sales 2.2% 4.8% 6.2% % of sales 2.2% 4.8% 5.9%
Financial Items -17 -14 -15 Financial Items -17 -15 -16 Financial Items -17 -15 -18
Profits Before Taxes 6 42 75 Profits Before Taxes 6 39 59 Profits Before Taxes 6 39 53
Taxes -14 -17 -20 Taxes -14 -15 -16 Taxes -14 -15 -18
% of PBT -225,0% -42,0% -26,5% % of PBT -225.0% -38.0% -26.5% % of PBT -225.0% -38.0% -33.1%
Net Income -8 24 55 Net Income -8 24 44 Net Income -8 24 35
EPS (NOK) -0,19 0,51 1,17 EPS (NOK) -0.19 0.53 0.94 EPS (NOK) -0.19 0.53 0.79
Bridging FY 2018 to the FY 2019 outlook, the following account for the main deviations:
▪ Revenue growth of +71. Expected Adj. EBIT Effect: +15
▪ Margin decline due to change in growth mix. Expected Adj. EBIT Effect: (3)
▪ Fixed cost absorption effect due to lower than planned revenues. EBIT Effect: (8)
▪ Increase in Mexican labor rates. Expected Adj. EBIT Effect: (3)
▪ Increase in raw material prices and tariffs. Expected Adj. EBIT Effect: (4)
▪ FX effects drive an increase in revenues of +2. Expected Adj. EBIT Effect: (2)
▪ Effect from implementing IFRS 16. Expected Adj. EBIT Effect: +3
▪ Note that the IFRS16 implementation negatively affects net income by (1)
▪ Launch issues with a new program in the P&C segment. Expected Adj. EBIT Effect: (3)
▪ Erosion and economics offset by cost savings. Expected Adj. EBIT Effect: +9
Even in this challenging macro environment, assuming our Current Macro Expectations remain
unchanged, in 2019, we plan to deliver:
▪ top line growth of ~ 6%,
▪ adj. EBIT growth of ~ 4%, and
▪ NI growth of ~45% in 2019 18Key financial policies and governance
▪ Leverage target: 1.5x net debt / EBITDA
Leverage targets ▪ Further deleveraging
▪ Target equity ratio1 of 35%
Liquidity ▪ Minimum operational cash on balance sheet: €30mm
Investments ▪ Select investments in key product / niche areas based on strict return performance
▪ Reinvestment of proceeds and debt reduction to maintain future prospects and achieve leverage targets take
Dividend policy priority over dividends / share buy-backs
Liabilities and risk ▪ Benefits from natural hedging with relatively limited revenue / cost exposure
management ▪ Currently no use of derivatives
Compliance ▪ Adhere to strict compliance standards
▪ No urgency to do M&A; we will only engage in opportunistic M&A activities
▪ No transaction will take place if not accretive to the Company
▪ Criteria for potential M&A targets:
M&A policy ▪ Technology based
▪ Enabling stronger vertical integration and synergies
▪ We will continue our portfolio pruning process
1Defined as Equity / total Assets
19Kongsberg Automotive –
Key highlights & Conclusion
▪ Kongsberg Automotive – truly global mid-sized automotive supplier with diversified customer base
▪ Kongsberg Automotive is a manufacturer and supplier of components, systems and aftermarket products primarily for
the automotive (light duty and heavy duty vehicle) markets. We also serve the power sports and heavy equipment
industries, with leadership positions in niche markets
▪ Diversified revenue base with ~75% from OE auto and ~25% from non-auto markets including
aftermarket
▪ Strong and improving financial performance driven by the improvement program initiated in 2016
▪ Kongsberg Automotive is outperforming the general automotive supplier market from a top line and
bottom line perspective. In 2019, we plan to deliver:
▪ top line growth of ~ 6%,
▪ adj. EBIT growth of ~ 4%, and
▪ NI growth of ~60%”
▪ Even in this challenging macro environment (trade wars, raw material price increases, overall market
declines), we continue to deliver YoY earnings growth.
▪ Strong recent business wins ensures high degree of short and medium term top line confidence.
20Backup Slides
21Interior Segment
Interior
Revenue 2018A: 25%1
€286mm
Description % of Interior revenue2 Product End-markets
➢ Exclusively focused on LDV market
Interior Comfort Systems
➢ Core Interior Comfort Systems – strong market
growth
– Technology leader in integration of the various
seat functionalities 77%
– Ability to offer full models or individual products
Seat
ventilation Massage
systems
Lumbar
Seat
support
heat
systems
➢ Exclusively focused on LDV market Bolster
systems
➢ Cables represent core competence
Light Duty Cables
– Strong product technology and knowledge base
– Traditional LDC applications moving towards 23%
actuators
– Uses actuator designs from other business units,
thus offering competitive benefits vs other pure LDC
players
1 % 2018 revenue; 2 Includes other revenue of 3% 22Powertrain & Chassis Segment
P&C
Revenue 2018A: 39%1
€437mm
Description % of P&C revenue2 Product End-markets
➢ Technology shift from mechanically based systems
towards electronically controlled actuation systems
➢ Product range include:
– AMT Actuators and PRND Actuators
Transmission control
– Clutch Actuation Modules
ATrAct™ Gear Gear shift
86%
– Shift-By-Wire Shifters and Manual Gear Shifters Control Unit cables
– Shift Cables
➢ Focus:
– Profitable growth for new technology
– Maintain share in conventional mechanical systems
AT Shifter Shift by Wire
➢ Well positioned on both HDV and LDV actuators
➢ Product range consists of 3 technologies
– Chassis Stabilizer
Vehicle dynamics
– V-Stays 11% V-stays
– Cabin Anti-roll Bar
➢ Well positioned in the market
Cabin Anti-roll
➢ No ICE exposure Bar
23
1 % 2018 revenues; 2 Includes other revenue of 4%Specialty Products segment
Speciality
Revenue 2018A: Products
€400mm 36%1
Description % of SP revenue Product End-markets
➢ Focused on air brake applications for HDVs
Air Couplings
➢ Technology leader with growing market share
– Premium priced products 27%
– Savings to OEMs through simplified processes
– Potential for growth in NA and Asia
Raufoss ABC™ Couplings System
➢ Specialty hoses for harsh applications
Fluid Transfer Systems
➢ Market and technology leader in PTFE hoses
➢ Growing market with strong competition in assemblies
34%
➢ Focus on product differentiation and scale benefits Twin Turbo
Feed
➢ Fragmented market in assemblies segment
Twin Turbo Drain
➢ Target: become largest supplier of steering system
Off Highway
products for the Power Sports, Agriculture, and
Construction markets
39%
➢ Steering columns, displays, pedals and hand controls
➢ Supplier of HMI and custom electronic products Pedal Box Tilt & Telescope KAntrak
Columns 1700
1%
24
2018 revenueGlossary
Term Meaning
AMT Automated Manual Transmission
CMD Capital Markets Day
EV Electric Vehicle
FTS Fluid Transfer System
HDV Heavy Duty Vehicle
HMI Human Machine Interface
HR / AR Headrest / Armrest
ICE Internal Combustion Engine
LDC Light Duty Cable
LDV Light Duty Vehicle
OE Original Equipment
OEM Original Equipment Manufacturer
PRND Park Reverse Neutral Drive
25You can also read