FIBRA PROLOGIS Citi CEO 2021 Conference - March 2021 - cloudfront.net
←
→
Page content transcription
If your browser does not render page correctly, please read the page content below
Prologis Park Grande 3, Mexico City

FIBRA PROLOGIS
Citi CEO 2021 Conference
March 2021
Forward-Looking Statements / Non Solicitation
This presentation includes certain terms and non-IFRS financial measures that are not specifically defined herein. These
terms and financial measures are defined and, in the case of the non-IFRS financial measures, reconciled to the most
directly comparable IFRS measure, in our first quarter Earnings Release and Supplemental Information that is available on
our website at www.fibraprologis.com and on the BMV’s website at www.bmv.com.mx.

The statements in this release that are not historical facts are forward-looking statements. These forward-looking statements are
based on current expectations, estimates and projections about the industry and markets in which FIBRA Prologis operates,
management’s beliefs and assumptions made by management. Such statements involve uncertainties that could significantly
impact FIBRA Prologis financial results. Words such as “expects,” “anticipates,” “intends,” “plans,” “believes,” “seeks,” “estimates,”
variations of such words and similar expressions are intended to identify such forward-looking statements, which generally are not
historical in nature. All statements that address operating performance, events or developments that we expect or anticipate will
occur in the future — including statements relating to rent and occupancy growth, acquisition activity, development activity,
disposition activity, general conditions in the geographic areas where we operate, our debt and financial position, are forward-
looking statements. These statements are not guarantees of future performance and involve certain risks, uncertainties and
assumptions that are difficult to predict. Although we believe the expectations reflected in any forward-looking statements are
based on reasonable assumptions, we can give no assurance that our expectations will be attained and therefore, actual outcomes
and results may differ materially from what is expressed or forecasted in such forward-looking statements. Some of the factors that
may affect outcomes and results include, but are not limited to: (i) national, international, regional and local economic climates, (ii)
changes in financial markets, interest rates and foreign currency exchange rates, (iii) increased or unanticipated competition for our
properties, (iv) risks associated with acquisitions, dispositions and development of properties, (v) maintenance of real estate
investment trust (“FIBRA”) status and tax structuring, (vi) availability of financing and capital, the levels of debt that we maintain and
our credit ratings, (vii) risks related to our investments (viii) environmental uncertainties, including risks of natural disasters, (ix) risks
related to the current coronavirus pandemic, and (x) those additional factors discussed in reports filed with the “Comisión Nacional
Bancaria y de Valores” and the Mexican Stock Exchange by FIBRA Prologis under the heading “Risk Factors.” FIBRA Prologis
undertakes no duty to update any forward-looking statements appearing in this release.

Non-Solicitation - Any securities discussed herein or in the accompanying presentations, if any, have not been registered under
the Securities Act of 1933 or the securities laws of any other jurisdiction and may not be offered or sold in the United States or other
jurisdiction absent registration or an applicable exemption from the registration requirements or in any such jurisdiction. Any such
announcement does not constitute an offer to sell or the solicitation of an offer to buy the securities discussed herein or in the
presentations, if and as applicable.

                                                                                                                                                  2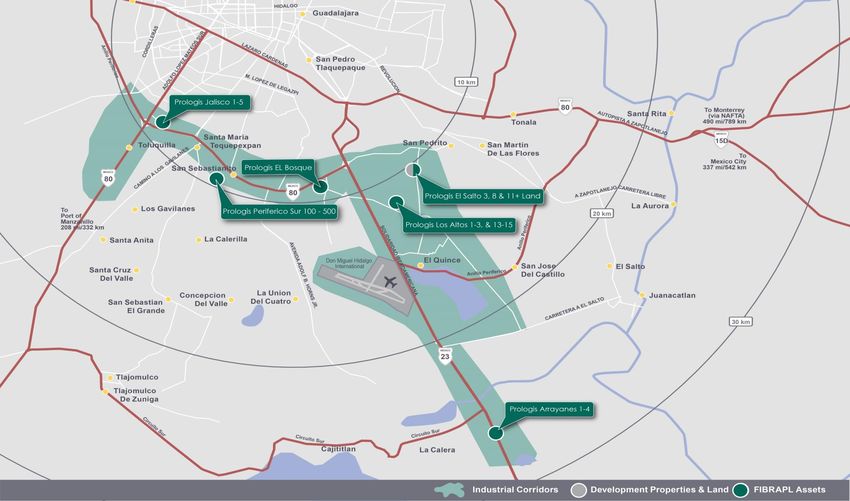
Prologis Tres Rios Industrial Park, Mexico City

Resilient Investment Strategy
Focused Investment Strategy

                                                                                                             •     129% Total Return Since IPO(1)

                                                                                                             •     Superior organic growth

                                                                                                             •     Reliable and sustainable cash flow

                                                                                                             •     Access to Prologis development
                                                                                                                   pipeline

                                                                                                             •     Irreplaceable industrial real estate in
                                                                                                                   Mexico in the six most dynamic markets

                                                                                                             •     Consumption and e-commerce driving
                                                                                                                   incremental growth

                                                                                                             •     Benefit from manufacturing and
                                                                                                                   nearshoring

4   1.   IPO was June 4, 2014; total return calculated in Mexican Pesos on February 18, 2021. Source: Bloomberg.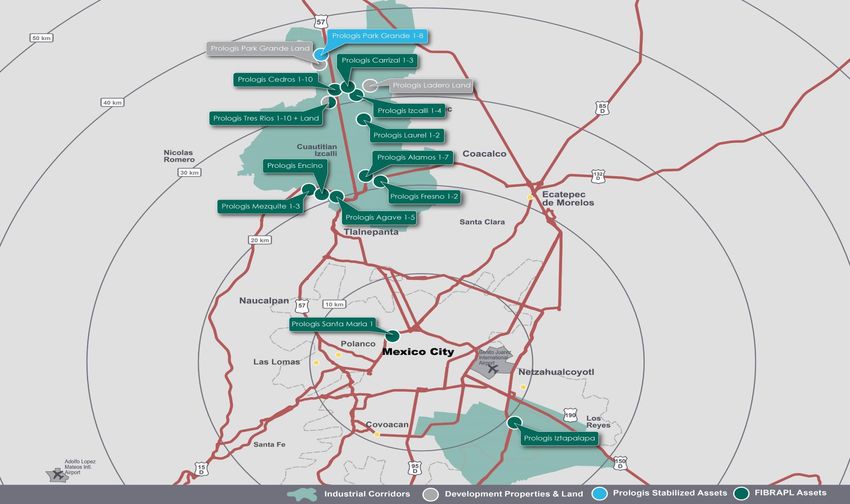
Unmatched Portfolio Focused on the Top Consumption and
Manufacturing Markets
6
Markets
                                                 Tijuana
97.1%
                                                                                                  Ciudad Juarez
                                                 GLA 4.2 MSF                                      GLA 3.5 MSF
Occupancy(1)                                     100.0% Occupancy                                 94.9% Occupancy

40.2                                                                                                                         Reynosa
Million Square Feet                                                                                                          GLA 4.7 MSF
                                                                                                                             100.0% Occupancy
205
Operating Properties(2)                                                                                                      Monterrey
                                                                                                                             GLA 5.4 MSF

16 years                                                                                        Guadalajara
                                                                                                GLA 5.9 MSF
                                                                                                                             93.4% Occupancy

Average Age
                                                                                                97.3% Occupancy

          > 10MSF

                                                                                                                    Mexico City
          5MSF to 10MSF
                                                                                                                    GLA 16.5 MSF
          3MSF to 5MSF                                                                                              97.0% Occupancy

          Data as of December 31, 2020.
          Note: GLA is defined as gross leasable area.
          1. Operating properties only.
5         2. Includes one value-added acquisition property that is not in the operating pool.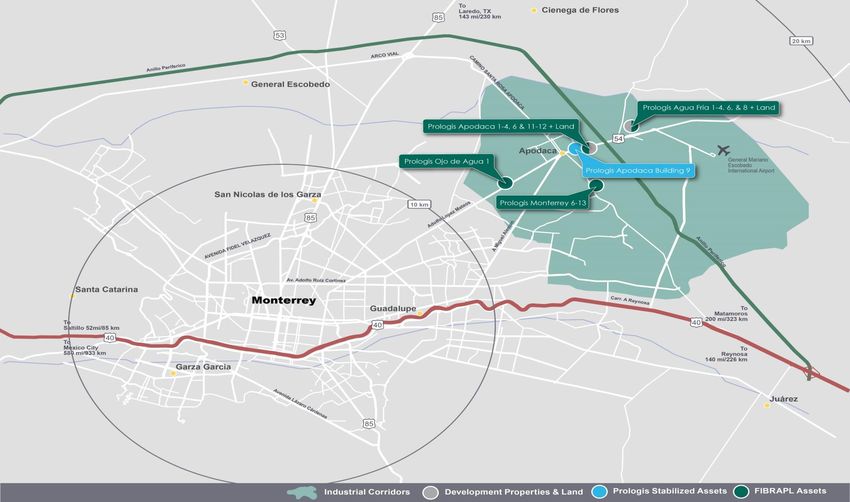
Real Estate Fundamentals
     DEMAND (TTM) VS SUPPLY (PIPELINE)                                             DEMAND VS SUPPLY                                       VACANCY
     (MSF)                                                                         (MSF)                                                               (%)

                                                                                                                                                             • Logistics real estate demand
               0       1       2         3        4          5       6                                                                                 10
                                                                                                                                                               was solid during the year
                                                                                    24
Mexico City                                                                                                                                                  • Border markets remain
                                                                                                                                                       8
                                                                                                                                                               severely constrained with
                                                                                    20                                                                         market vacancy near 1.7%
 Monterrey
                                                                                                                                                             • Tijuana’s market vacancy for
                                                                                    16                                                                 6       Class-A product is ~80 bp
Guadalajara

                                                                                    12

     Tijuana                                                                                                                                           4

                                                                                     8

     Juarez
                                                                                                                                                       2
                                                                                     4

   Reynosa

                                                                                     0                                                                 0
                                                                                           2013   14       15   16      17     18   2019 2020

  BTS Development      Speculative Development        Net Absoprtion (TTM)                   Completions          Net Absorption        Vacancy Rate

          Sources: CBRE, NAI, Prologis Research                                     Sources: CBRE, Prologis Research
                                                                                    Note: Completions equate to supply while net absorption
                                                                                    is equivalent to demand
 6                                 Data as of December 31, 2020
                                   1.   BTS is defined as build to suit
                                   2.   TTM is defined as trailing twelve months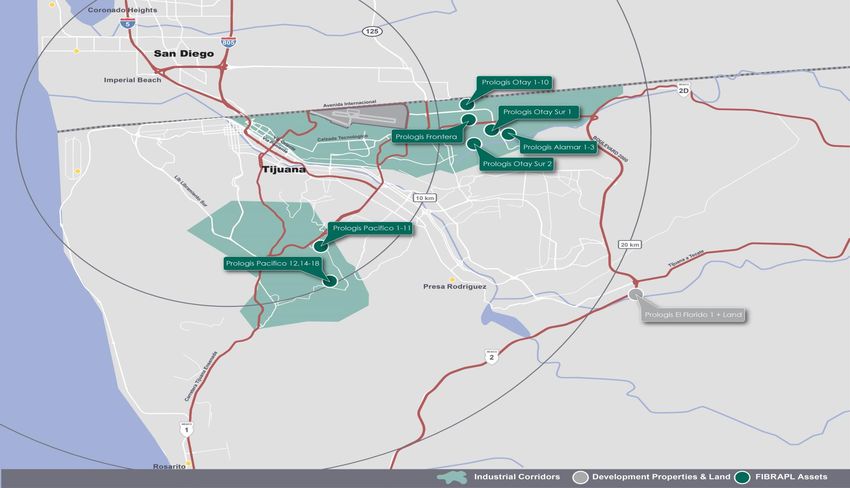
Nearshoring as a Rising Structural Demand Driver
Global supply chain trends underpin the future of Mexican logistics real estate

Supply chain disruptions driving a renewed focus on resiliency
• Built-in flexibility to avoid disruptions (e,g., geopolitical, weather,
  currency, supplier, labor) accelerating the shift to regionalize and
  nearshore production
• Regionalized production models create quasi-independent supply chains
  that can ship globally were disruptions to arise around the world          Efficiency                    Regionalization                   Resiliency
                                                                             inventory is waste                                 inventory as a lifeblood
• Underpinned by IIoT (Industrial Internet of Things) technology                                                                   for revenue streams

Nearshoring offers compelling efficiency gains                                                             Nearshoring
• Proximity to consumers in North America offers speedy delivery                          Just-in-time                       Just-in-case
                                                                                          (speed and                                (IIoT,
• Consumer preference for customized products underpinned by                              customization)                     planning for
  technology                                                                                                                  disruption)

Geographical and industry diverse demand                                                                   Technology

• Propelled by defense-sensitive industries (e.g., electronics, medical),
  complex high-technology sectors (auto, industrial goods), bulky products
  (e.g., home goods) and consumer goods that require customization
• Asian multinationals a growing share of demand, as firms mature to
  service North American consumers or reconfigure supply chains away
  from long global supply chains

7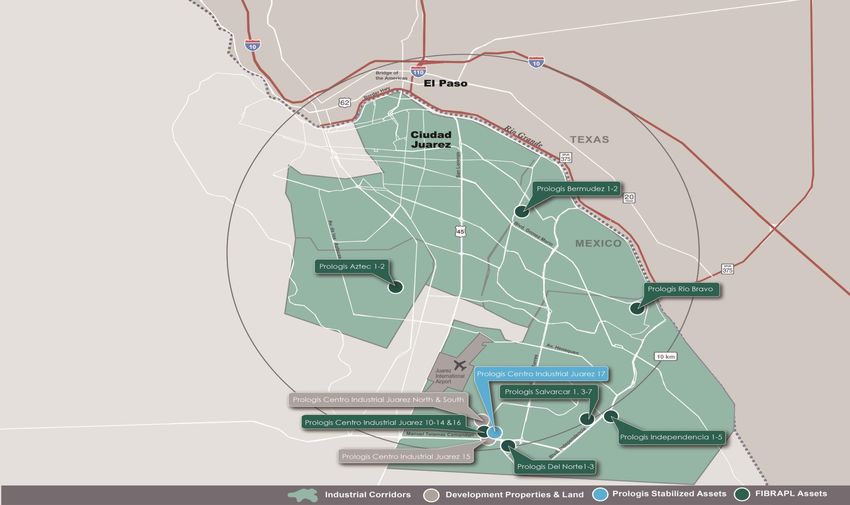
Nearshoring: Growth in Mexico-to-US Manufacturing

    TOTAL MANUFACTURED GOODS IMPORTS FROM MEXICO AS % OF
    IMPORTS FROM ASIAN LOW-COST COUNTRIES                                                                                                • In 2020, the U.S. imported 46 cents
                                                                                                                                           worth of manufacturing imports from
                                                                                                                                           Mexico for every dollar of manufacturing
    52%
                                                                                                                                           imports from Asia

    50%
                                                                                                                                         • 75% less time to transport goods to the
                                                                                                                                           end customer in the U.S. from Mexico vs
    48%
                                                                                                                                           Asia

    46%
                                                                                                                                         • 20-30% savings in production cost by
                                                                                                                                           manufacturing in Mexico vs U.S.
    44%

    42%

    40%
          2010     2011      2012      2013       2014      2015       2016      2017       2018      2019      2020

8           Source: United States International Trade Commission, United States Department of Commerce Bureau of Economic Analysis; Kearney analysis
Diverse Demand Drivers Present in Mexico
 Resilience During Pandemic

CONSUMPTION
Distribution of Customer Industry, Share of Total FIBRA Prologis Portfolio NRA

                                    General Retailer
          Structural

                                          Healthcare
                                                                                                                                       30%
                           Industrial/Commodities

                                            Transport

                                          Appliances

                                                  Auto
          Cyclical

                                       Home Goods
                                                                                                                                       31%
                                        Construction

                                   Paper/Packaging
          Basic Needs

                                                 Food

                                             Clothing
                                                                                                                                       23%
                                  Consumer Goods

                                                Other                                                                                  15%
                                                         0%          2%            4%           6%      8%   10%   12%   14%   16%   18%

                        Source: Prologis Research
9                       Note: Other category includes data center, call centers and multi-industries.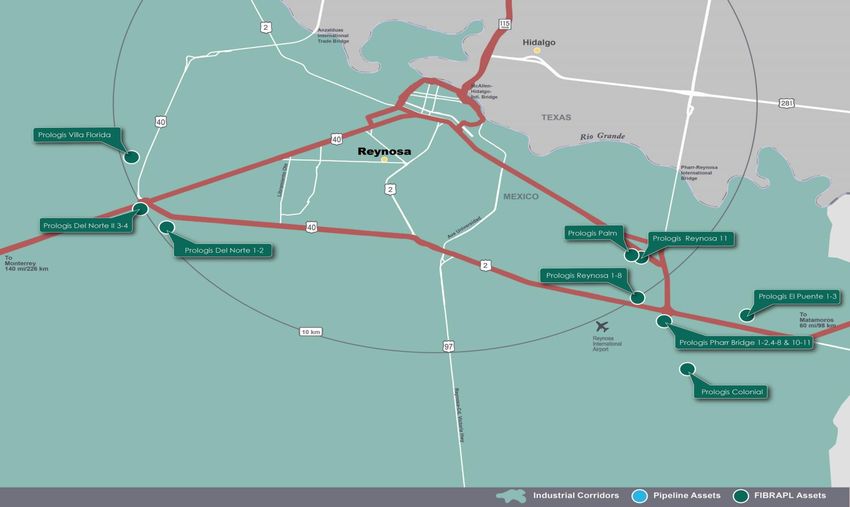
Positive Trends for E-Commerce in Mexico
SHARE OF INTERNET RETAILING SALES                                                       INTERNET SALES PENETRATION BY INDUSTRY,                   • E-commerce becoming an
%, As a Percentage of Total Retail Sales                                                MEXICO                                                      added tailwind for logistics real
                                                                                        %, As a Percentage of Total Industry Retail Sales           estate demand, especially in
                                                                                                                                                    Mexico City
 35                                                                                                                          0   5     10    15
 30                                                                                                                                               • Mexican e-commerce sales
                                                                                                           Electronics
 25                                                                                                                                                 growing rapidly by >50% year-
 20
                                                                                                           Appliances                               over-year, driven by the stay-
 15
 10
                                                                                                                                                    at-home economy
                                                                                           Video Games Hardware
  5                                                                                                                                               • Mexico projected to exceed
  0                                                                                                             Games                               USD$19B in e-commerce
                                                                                                                                                    revenue, surpassing Argentina
                                                                                                                Beauty
                                                                                                                                                    in 2021(1)
                       Europe           Brazil           China                                 Home Improvement
                                                                                                                                                  • E-commerce penetration in
                       Japan            Mexico           U.S.
                                                                                                                                                    Mexico still in nascent
                                                                                                                                                    development stage relative to
POSITIVE UPSIDE IN INTERNET PENETRATION
%, Internet Sales as a Share of Total Retail Sales
                                                                                                                                                    global market peers

                                                                                                                                     27.3

                                                                                                                      19.9

                                                         13.9                          14.3

                           8.1

                         Mexico
                         Mexico                         Brazil                  Western Europe                        U.S.           China

           Source: Euromonitor, Prologis Research
10         Note: Excludes sales tax and travel spending; E-commerce sales exclude consumer-to-consumer transactions
           1. Statista
E-Commerce Requires ~3X the Distribution Space of
Traditional Retail
Sales Facilities Productivity Efficiency E-fulfillment requires 3X
US$, B SF, M US$ / SF SF / $1B the logistics space used
of brick-and-mortar
retailers due to:
• Shipping parcels
versus pallets
Online $234 265 $883 1,174 KSF +/• High inventory level
• Broader product
3x
variety (ie increased
+ SKUs)
- • Reverse logistics
Brick &
$1,343 449 $2,991 334 KSF
Mortar
Source: Internet Retailer, company filings, Prologis Research
Note: SF is defined as square feet; KSF is defined as thousands of square feet and SKUs is defined as stock keeping unit which is tracked by a bar code
11 usually printed on product label.Prologis Park Grande 2, Mexico City Low Risk Business Model
Portfolio Statistics & Well-Laddered Expiration Schedule

     LEASE EXPIRY PROFILE BY ANNUALIZED NER

                                                                                       20%
                                                                                                                                              18%
                           15%
                                               13%
          10%                                                       9%
                                                                                                             6%                   7%
                                                                                                                      2%

         2021              2022                2023                2024                2025                  2026    2027        2028      Therafter

     PORTFOLIO STATISTICS                                                                             CURRENCY OF LEASES, % OF NET EFFECTIVE RENT

     Avg in Place Rent per Sq Ft                         $5.60
     Avg Market Rent per Sq Ft                           $5.57                                                                MXN
                                                                                                                              36%
     2021 Expiring Rent per Sq Ft                        $5.45
                                                                                                                     USD
     Avg Contractual Rent Escalator(1) ~2.5%                                                                         64%

     WARLT(2)                                            ~42 months

                Data as of December 31, 2020
                1. For USD denominated leases only. Leases in Mexican pesos are tied to Mexican inflation.
13              2. Weighted Average Remaining Lease Term
Diversified Customer Base
228
CUSTOMER TYPE CUSTOMER INDUSTRY
%, NER basis %, NRA basis
customers in Mexico
have
20%
24% 23%
336 leases with FIBRA 16%
Prologis B2B 14%
14% 10%
86% of FIBRA Prologis’ 9% 9%
8% 7%
39%
customers are multinational
4%
companies(1) Retail 3%
Our top 10 customers Logistic Services Manufacturing
Multicustomer 3PL
Retailer
Industrial
Apparel
IT & Electronics
Auto & Parts
Consumer Goods
Healthcare
Packaging Paper
Home Goods
represent just
E-commerce Retail
23.9%
of net effective rent
Source: Prologis Research. Data as of December 31, 2020
Note: Industry classifications do not sum to 100%; the balance (15%) is ascribable to units where 3PL customers have more than one industry type present.
14 1. As a percentage of net effective rentExternal Growth: Identified Future Growth Acquisitions
EXTERNAL GROWTH VIA PROLOGIS DEVELOPMENT PIPELINE
(MSF) Prologis & FIBRAPL UNIQUE COMPETITIVE ADVANTAGE
Development Land Bank &
Pipeline Expansion Land(1) • Proprietary access to Prologis
FIBRAPL Portfolio development pipeline at market
values
• Exclusive right to third-party
40.2 1.6 5.2 acquisitions sourced by Prologis
• 17% growth potential in the next 3
to 4 years, subject to market
conditions and financial availability
47.0
PROLOGIS DEVELOPMENT PIPELINE
GLA %
(MSF) Leased
Prologis Land Bank And FIBRAPL Expansion Land Based On Buildable SF
Mexico City 0.5 100%
Ciudad Juarez 0.4 58%
0.6 0.6 1.5 1.8 0.7
Tijuana 0.4 100%
Monterrey 0.3 69%
Mexico City Monterrey Reynosa Juarez Tijuana
Total 1.6 82%
Data as of December 31, 2020, except where noted.
15 1. Based on buildable square feet.Strong Financial Position
BBB/BBB+ rated by Fitch/HR Ratings1
DEBT METRICS Q4 2020
DEBT MATURITY SCHEDULE
Total debt $857M (USD$ in millions)
Unsecured Debt
$290
Wtd avg rate 3.4% $1 Secured Debt
USD denominated 100%
$125 $125 $125
$107
Wtd avg term 7.1 yrs $85
Available liquidity USD2 $374M
2021 '22 '23 '24 '25 '26 '27 '28 '29 '30 '31 2032
Fixed debt3 56%
Cash
Interest
--- --- 2.4 2.3 --- 4.7 --- 4.1 --- 4.1 --- 4.1
Net debt to EBITDA 4.6x Rate:
(%)
Fixed charge coverage 4.2x
Data as of December 31, 2020.
16 1. A securities rating is not a recommendation to buy, sell or hold securities and is subject to revision or withdrawal at any time by the rating agency
2. Liquidity is comprised of US$22M of cash, US$325M undrawn from unsecured credit facility.
3. Includes the interest rate swap contracts.Apodaca 9, Monterrey Best Practices Oriented to Create Value
ENVIRONMENT

33%              50%                      24%
                 of total operating       of total operating
Green
                 portfolio has LED        portfolio has cool or
certifications
                 lighting                 reflective roofing

COMMUNITY & EMPLOYEES

51%              100%                      92%
of employees      of employees have         employee
are women         access to career          engagement
                  training and              with the
                  education                 company

GOVERNANCE

 57%               24-hr                    100%
 of Technical     anonymous ethics           of employees
 Committee        and safety help lines      subject to
 members are                                 FCPA rules
 independent                                                      Dutra RJ, Sao Paulo, Brazil
                                                                     Centro Industrial Juarez 17, Ciudad Juarez

     FIBRA Prologis ESG Facts
     18
Strong Sustainability Focus
STRATEGY
• Committed to minimizing environmental impact and growing our
portfolio of sustainably certified buildings
• Promoting Inclusion & Diversity amongst our employees.
Committed to the communities where we do business, we seek to Ranked #2 in 2020
grow together. for ESG/SRI Metrics
• Strong ethics and compliance aligned with our Code of Ethics and Listed
Business Conduct, our policy on Global Anti-Corruption and the
Foreign Corrupt Practices Act (FCPA), our Supplier Code of
Conduct, and anonymous 24-hour ethics and safety help lines
SUSTAINABILITY BY THE NUMBERS
GRESB Sector Leader 2020
Sustainable Building 29 LEED certification
Feature 2017 2018 2019 2020 awarded Awarded Green Stars 4
years in a row
LED lighting 2% 26% 28% 50%
Cool roof portfolio 17% 22% 23% 25%
coverage1
17 21 34 44 17 Silver BOMA BEST
A Score in 2020 Climate
certificates awarded
Building certifications 4.4 MSF 5.8 MSF 8.4 MSF 13.2 MSF Change
1. Based on percentage by area of operating portfolio that utilizes cool/reflective roofing materials
19 2. Does not include double counting of assets with both a LEED certificate and BOMA BESG certificateWorld Class Corporate Governance
Alignment with Certificate Holders
Philosophy Technical Committee Members
• Our governance structure reflects a market- • Technical Committee members are ratified
leading approach to corporate governance annually by certificate holders
prioritizing the interests of our certificate
holders, while leveraging our relationship with
Prologis, consistently recognized for its best-in- 4 3
class governance Independent Prologis
Members Members
Committees
• Luis F. Cervantes • Luis Gutiérrez
• The following committees consist of at least three
independent members • Alberto Saavedra • Eugene F. Reilly
• Xavier de Uriarte Berron • Edward S. Nekritz
– Audit Committee
• Carlos Elizondo Mayer-
– Practices Committee Serra
– Indebtedness Committee
Shared Ownership Related-Party Transactions
• Prologis’ 46.8%(1) ownership of FIBRA Prologis, • Only independent members of the Technical
demonstrates alignment with certificate holders Committee may vote for related-party
transactions, such as purchasing stabilized
assets from our sponsor, Prologis
20Creating Value for Certificate Holders
TOTAL RETURN OF CBFIS IN MEXICAN PESOS
June 4, 2014 – February 18, 2021
129%
82% 88%
68%
24%
(8%)
FIBRAPL Peer A Peer B Peer C Peer D FIBRA Index
Stock Return Dividend Return
FIBRAPL DISTRIBUTIONS
USD$
(2)
$100
$79 $80 $77
$75
$80 $70
$63
$60 $48
(3)
$40
$20 $28
$0
2014 2015 2016 2017 2018 2019 2020
Source: Bloomberg, company filings. FIBRA Prologis’ initial public offering was June 4, 2014. Peers include Terrafina, FIBRA Uno, FIBRA Macquarie and Vesta.
1. Excluding the realized exchange loss on VAT refund.
21 2. 6-year CAGR based on annualized 2014 figures.
3. Represents annualized distributions for 2014 based on period from June 4, 2014 through December 31, 2014.Prologis Park Grande, Mexico City Appendix
Historical Operating Performance
 ELEVATED PERIOD-END OCCUPANCY
 (%)
                                                                       97.4 97.3                                        97.4 97.5                   97.6
                                                                                             97.3                                                                                  97.1
              96.6                                      96.7 96.8                                                                    96.6 96.8              96.8
       96.3                96.3 96.5 96.4 96.4                                       96.4                       96.5                                                       96.4
                     96                                                                             96.0 95.9
                                                                                                                                                                   95.5

       Q414 Q115 Q215 Q315 Q415 Q116 Q216 Q316 Q416 Q117 Q217 Q317 Q417 Q118 Q218 Q318 Q418 Q119 Q219 Q319 Q419 Q120 Q220 Q320 Q420

 STRONG POSITIVE RENT CHANGE ON ROLLOVER
 (%)

                                                                                                                                     16.0                                   16.3
       13.4                14.7                                                                         15.1                                         13.9
                                                                              13.2            14.0 13.8                 13.5                                        13.2
                                                 11.8                                 10.9
                                  10.3 9.7                                                                                                                                         10.5
               8.9                                                                                               10.6
                     9.5                                                8.0
                                                           8.0   8.3
                                                                                                                               5.9                           6.6

                                                                                                                                            (1.4)
       Q414 Q115 Q215 Q315 Q415 Q116 Q216 Q316 Q416 Q117 Q217 Q317 Q417 Q118 Q218 Q318 Q418 Q119 Q219 Q319 Q419 Q120 Q220 Q320 Q420

                                                                                             Trailing 4Q

                            Data as of December 31, 2020
23
Historical Growth
NOI GROWTH ADJUSTED EBITDA GROWTH
Millions of USD Millions of USD
180 180
150 150
120 120
90 90
60 60
30 30
0 0
2015 2016 2017 2018 2019 2020 2015 2016 2017 2018 2019 2020
FFO GROWTH AFFO GROWTH
Millions of USD Millions of USD
140 100
120
80
100
80 60
60 40
40
20 20
0 0
2015 2016 2017 2018 2019 2020 2015 2016 2017 2018 2019 2020 YTD
Data as of December 31, 2020
24 Note: For comparative purposes, incentive fees paid to FIBRAPL’s sponsor in 2017, 2018 and 2019 have been excluded, as has the impact on realized exchange losses
from VAT in 2015.Historical Credit Metrics
DEBT % OF INVESTMENT PROPERTIES FIXED CHARGE COVERAGE RATIO
40% 5X
4X
30%
3X
20%
2X
10%
1X
0% 0
Q416 Q417 Q418 Q419 Q420 Q416 Q417 Q418 Q419 Q420
DEBT TO ADJUSTED EBITDA LIQUIDITY
Millions of USD
6X 750
5X
600
4X
450
3X
2X 300
1X 150
0 0
Q416 Q417 Q418 Q419 Q420 Q416 Q417 Q418 Q419 Q420
Data as of December 31, 2020
25 Note: On April 6, 2020, FIBRA Prologis acquired Prologis Park Grande for US$353M, including closing costs but excluding VAT. The information displayed on
this page does not reflect that acquisition.Portfolio Growth Since IPO
GROSS LEASABLE AREA
Thousands of SF, June 4, 2014 through December 31, 2020
41,000
37,000
33,000
29,000
25,000
IPO 4Q 2014 4Q 2015 4Q 2016 4Q 2017 4Q 2018 4Q 2019 4Q 2020
REAL ESTATE PORTFOLIO(1)(2)(3)
Thousands of USD$
+71% Total
+21% Internal
$2,700
$0.8B $2.4B
$2,200
$1.7B
$1,700 $0.4B $2.9B
$1,200 $2.0B
$1.7B
$700
IPO Portfolio IPO Portfolio As of 31-Dec-2020 Acquisitions Since IPO Total As of 31-Dec-2020
1. Based on 3rd party appraisals.
26 2. IPO was June 4, 2014.
3. Post-IPO acquisitions were completed between 2014 and 2019.Superior High-Barrier Market Concentration Versus Peers
Supply Chain Center Growth Economy Global Metropolis
High-Barrier
FIBRAPL Others FIBRAPL Others
31% 17% 42% 24%
Lower-Barrier
FIBRAPL Others FIBRAPL Others
0% 47% 26% 11%
Subtotal
FIBRAPL Others FIBRAPL Others FIBRAPL Others
31% 64% 26% 11% 42% 24%
Sources: company filings, Prologis Research
Note: Distributed by NRA. Other FIBRAs includes FUNO, Terrafina, Fibra Macquarie and Vesta as of March 31, 2020. Global Metropolis defined as large and high-income
population center with high barriers to new development. A Growth Economy is a fast-growing population and evolving economy with rising incomes and increasing
barriers to new development. A supply chain center is a lower barrier market with access to major transportation routes. Mexico City defined as a high barrier global
27 metropolis. Monterrey and Guadalajara defined as lower barrier growth economies. The main border markets (Tijuana, Juarez and Reynosa) are high barrier supply chain
centers and the Bajio is a lower barrier supply chain center.Fee Structure
Transparent and Aligned
Fee Type Calculation Payment Frequency
Property Management 3% x collected revenues Monthly
Operating Fees
New leases: 5% x lease value for 10 yrs
Only when no broker is involved ½ at occupancy
Renewals: 50% of new lease schedule
Construction Fee / Development Fee 4% x property and tenant improvements Project completion
and construction cost
Asset Management 0.75% annual × appraised asset value Quarterly
Hurdle rate
Administration Fees
9%
High watermark Yes
Incentive Fee 10% Annually
at IPO anniversary
Currency 100% in CBFIs
Lock up 6 months
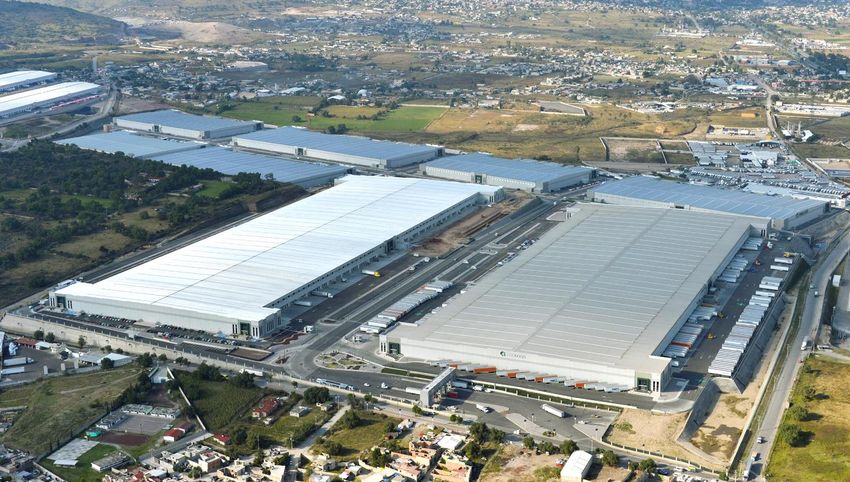
28Strategic Acquisition Completed April 2020
Prologis Park Grande
• Location: Mexico City
• Land Size: 212.3 acres, 9.3 MSF
• GLA: 3.9 MSF B-6
B-7 B-5
• 100% leased
B-8 B-4
B-3
Unique Competitive Advantage:
• State of the art logistics park focused on e-
commerce customers and consolidation of 3PL B-2
customers
• Strategically located in the land constrained B-1
premier Class-A building corridor of Mexico
City
Current Land Site
29 Note: On April 6, 2020, FIBRA Prologis acquired Prologis Park Grande for US$353M, including closing costs but excluding VAT.Mexico City 30
Guadalajara

31
Monterrey

32
Tijuana

33
Ciudad Juarez

34
Reynosa

35
Reynosa

36
You can also read