Antony Waste Handling Cell Ltd. "AVOID" to - Stretched valuation - Equity
←
→
Page content transcription
If your browser does not render page correctly, please read the page content below

“AVOID” to
Antony Waste Handling Cell Ltd.
         Stretched valuation
03rd Mar. 2020
Salient features of the IPO:
• One of the key players in municipal solid waste (MSW) management,           Recommendation                          AVOID
    Antony Waste Handling Cell Ltd. (AWHCL), is planning to raise up to       Price Band                 Rs. 295 - 300 per Share
    Rs. 2,000mn through an IPO, which opens on 04th Mar. and close on         Face Value                 Rs. 5
    06th Mar. 2020. The price band is Rs. 295 - 300 per share.                Shares for Fresh Issue     1.167 - 1.186mn Shares
• The issue is combination of fresh and OFS. AWHCL will not receive
    any proceeds from OFS. From the fresh issue net proceeds, the             Shares for OFS             5.7mn Shares
    company will infuse funds in its subsidiary company for the               Fresh Issue Size           Rs. 350mn
    repayment/pre-payment of certain outstanding debt.                        OFS Issue Size             Rs. 1,681.5 - 1,710mn
Key competitive strengths:                                                                               6.867 - 6.886mn Shares
                                                                              Total Issue Size
• A leading service provider in MSW management sector with end-to-                                       (Rs. 2,031.5 - 2,060mn)
   end capabilities                                                           Bidding Date               04th Mar. - 06th Mar. 2020
• Strong track record of project execution                                    MCAP at Higher Price
• De-risked business model with diverse portfolio of projects                                            Rs. 8,027mn
                                                                              Band
• Strong base of modern and well-maintained fleet of vehicles
• Experienced promoters and management team with strong domain                Enterprise Value at
                                                                                                         Rs. 8,437mn
   expertise                                                                  Higher Price Band
                                                                              Book Running Lead
Risk and concerns:                                                            Manager
                                                                                                         Equirus Capital Pvt. Ltd.
• Governments poor/lower allocation towards waste management
   projects                                                                   Registrar                  Link Intime India Pvt. Ltd.
• Revenue concentration risk                                                                             Mr. Jose Jacob Kallarakal, Mr.
• Project renewal risk                                                        Promoters                  Shiju Jacob Kallarakal and Mr.
• Labor and working capital intensive business                                                           Shiju Antony Kallarakkal
• Intense competition
                                                                              Pre and post - issue shareholding pattern
Peer comparison and valuation: There are on listed peers having similar                                    Pre - Issue     Post - Issue
business operations like AWHCL. We have taken global peers for                Promoter & Promoter
valuation benchmarking. At the higher price band of Rs. 300 per share,                                       51.10%          48.87%
                                                                              Group
the company’s share is valued at a P/E multiple of 29.6x (to its restated
FY19 EPS of Rs. 10.2) as compared to peer average of 25.3x.                   Public                         48.90%          51.13%
                                                                              Total                         100.00%         100.00%
Below are few key observations of the issue: (continued in next page)         Retail application money at higher cut-off price per lot
Industry:                                                                     Number of Shares per Lot                  50
• Currently, around 80% of the municipal solid waste generated in India       Application Money                Rs. 15,000 per Lot
   is being collected and transported whereas only 25% gets processed.        Analyst
   The government with its flag ship programs like “Swachh Bharat
   Mission” and “Smart City Mission”, intended to expand the waste            Rajnath Yadav
   procession from 25% to 100% by 2019. Although the target was very          Research Analyst (022 - 6707 9999; Ext: 912)
   ambitious, it has set a vision and platform for significant growth of      Email: rajnath.yadav@choiceindia.com
   solid waste management industry in India in the coming years
• India generated around 55mn tonnes per annum of MSW in FY18 and is forecasted to grow at 5% CAGR over FY18-23 to
   70mn tonnes in FY23. In terms of value, the MSW management market is estimated at Rs. 30bn in FY18 and is expected to
   reach Rs. 62bn by FY23, a CAGR of 15.6%.

Company:
• MSW segment offers high potential in collection & transportation (C&T), compost, power generation and integrated MSW
  management services. C&T was first opened up for private sectors in India couple of decades ago. Since then, this segment
  has seen technological improvements such as mechanized primary waste collection & sweeping, GPS vehicle and bin
  tracking system etc. AWHCL is among select few companies who have pioneered this segment.
• It is also among very few companies with expertise in landfill construction and management. Landfills are seen as vital
  component in the integrated management of solid waste for cities having population more than 1mn. Kanjurmarg site in
  Mumbai is a key success story of scientific landfill in India. It is one of the largest single location waste processing plants in
  Asia. AWHCL through its subsidiary was awarded Kanjurmarg landfill project by MCGM in FY10. Since FY10 and till 31st Dec.
  2019, the company processed around 6.17mn tonnes of waste at the Kanjurmarg site.
• AWHCL also has presence in waste-to-energy (WTE) segment. Currently, the company through its subsidiary is operating a
  0.4MW landfill gas-to-energy plant at Kanjurmarg facility since 2014, which has been upgraded to 1.37MW. It has also been
  awarded a contract by Pimpri Chinchwad Municipal Corporation (PCMC) for setting up and operating WTE plant having a
  capacity to process 1,000 tonnes of waste per day.
• Currently, AWHCL is among the top five players in the domestic MSW management industry. As of 1st Jan. 2020, the
  company has undertaken 25 projects, of which 17 are ongoing and has started generating revenue. The portfolio of ongoing
  projects includes 11 MSW C&T projects, two MSW based WTE projects and four mechanized sweeping projects.

                                                                                                                              1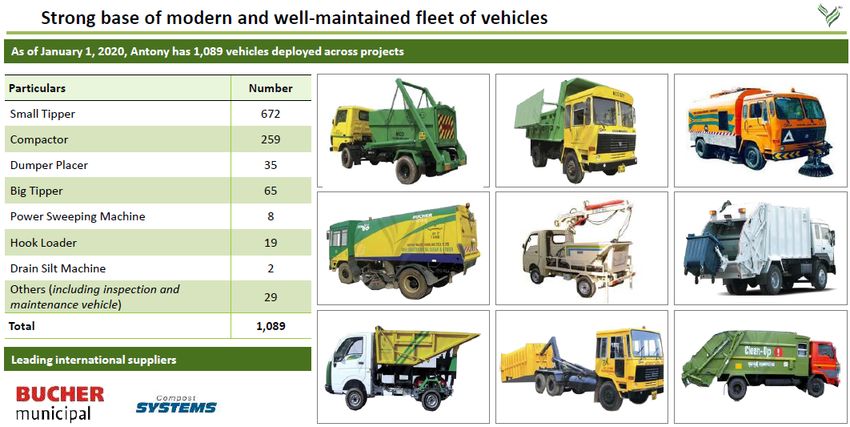
Peer comparison and valuation (Contd…):
                                                    CMP        MCAP             EV            Total Operating      TTM EBITDA     TTM PAT         TTM EBITDA TTM PAT
          Company Name                Currency
                                                    (Rs.)     (Rs. mn)       (Rs. mn)        Revenue (Rs. mn)        (Rs. mn)     (Rs. mn)         Margin (%) Margin (%)
Antony Waste Handling Cell Ltd.         INR         300.0         8,027           8,437           2,837               762              272             26.9%         9.6%
Advanced Disposal Services Inc.         USD          33.1         2,972           4,854           1,623               404               11             24.9%         0.7%
Biffa Plc.                              GBp          2.7           680             892            1,091               146               35             13.4%         3.2%
Clean Harbors Inc.                      USD          69.5         3,879           5,191           3,412               596              114             17.5%         3.3%
Suez Environment S.A.                   EUR          14.1         8,876          23,755           18,015             2,653             295             14.7%         1.6%
Veolia Environment S.A.                 EUR          25.9         14,682         26,131           27,189             3,620             894             13.3%         3.3%
Waste Management Inc.                   USD         110.8         47,061         57,446           15,455             4,618            1,864            29.9%         12.1%
Republic Services Inc.                  USD          90.3         28,802         37,707           10,300             2,951            1,075            28.6%         10.4%
Average                                                                                                                                                20.3%         5.0%
                              TTM                         Debt       Total Asset                                                               EV /
                                      BVPS       DPS                                      RoE     RoCE     P/E       P/B     EV / Sales                  MCAP /      Earning
      Company Name             EPS                       Equity       Turnover                                                                EBITDA
                                      (Rs.)      (Rs.)                                    (%)      (%)      (x)       (x)       (x)                      Sales (x)   Yield (x)
                              (Rs.)                      Ratio          Ratio                                                                   (x)
Antony Waste Handling
                              10.2    122.5      0.0        0.6            0.4            8.3%    11.0%    29.6       2.4       3.0            11.1        2.8        3.4%
Cell Ltd.
Advanced Disposal
                              0.1      10.3      0.0        2.1            0.5            1.1%    2.3%     270.2      3.2       3.0            12.0        1.8        0.4%
Services Inc.
Biffa Plc.                    0.1      1.4       0.1        1.2            1.0             5.1%    6.4%    19.3       1.9       0.8            6.1         0.6        5.2%
Clean Harbors Inc.            2.0      22.8      0.0        1.4            0.9             8.0%    5.2%    34.1       3.1       1.5            8.7         1.1        2.9%
Suez Environment S.A.         0.5      7.7       0.7        1.5            0.5             7.4%    3.5%    30.1       1.8       1.3            9.0         0.5        3.3%
Veolia Environment S.A.       1.6      10.5      1.0        2.4            0.7            10.5%    4.2%    16.4       2.5       1.0            7.2         0.5        6.1%
Waste Management Inc.         4.4      16.7      2.1        2.0            0.6            25.0%   11.5%    25.3       6.7       3.7            12.4        3.0        4.0%
Republic Services Inc.        3.4      25.5      1.6        1.1            0.5            13.4%    8.4%    26.8       3.5       3.7            12.8        2.8        3.7%
Average                                          0.8        1.7            0.7            10.1%   5.9%     25.3       3.2       2.1            9.7         1.5        3.7%
    Note: All financials and ratio based on FY19 data or TTM; Data in their respective currency; Source: Choice Broking Research

•    Traditionally in India, MSW management services have been controlled by relevant municipal corporations with only 30-
     35% being managed by professional waste management players. With privatization trend growing slowly since 2013, more
     and more municipalities will move towards privatization in coming years, thereby benefiting players like AWHCL.
•    To operate the projects efficiently, the company has consistently invested in fleet of vehicles. As of 1st Jan. 2020, it had
     1,089 vehicles. Owning a fleet of modern vehicles assists AWHCL with a competitive advantage in terms of easy availability
     of vehicles and smooth project executions.
•    The company generates 45% of the business from the waste processing, while the balance from C&T. The processing
     business is expected to report higher business with the commencement of PCMC WTE plant.
•    Its C&T business is highly competitive. Growth drives are the waste volume and the annualized increase of around 5-8% in
     the tipping fees. Most of its operational projects are expected to approach contract completion in next 2-3 years. Post
     which, again the contract will have to be renewed. According to the management, in the past around 80% of the contract
     got renewed on expiry. Considering the competitive intensity, especially in this segment, renewing the existing contract
     will be a challenge for the company.
•    Since AWHCL deals with government entities like the municipal corporations, it is exposed to the delayed payment from
     such entities. Its total net receivables were around 30% of the FY19 top-line. Moreover, trade receivables days increased
     from 45 days in FY17 to 64 days in FY19. This makes the business highly working capital intensive.
Financial performance:
• The reported financials are of short period and have stagnant performance. AWHCL reported a modest consolidated top-
   line growth of 1.4% CAGR over FY17-19 to Rs. 2,836.9mn in FY19. Total operating expenditure declined by 0.8% CAGR over
   FY17-19, leading to 8.4% CAGR rise in consolidated EBITDA to Rs. 761.8mn in FY19. Consequently, EBITDA margin expanded
   by 335bps during the period to stood at 26.9% in FY19. With higher depreciation charge and tax expenses, reported PAT
   declined by 8.9% CAGR over FY17-19 to Rs. 271.6mn in FY19. PAT margin contracted by 228bps during the period to 9.6%
   in FY19. The company had a positive operating cash flow over FY17-19, however, it declined by 19.9% CAGR over FY17-19.
   During the period, average RoIC and RoE stood at 26.6% and 18.6%, respectively.
• For H1 FY20, the company reported a PAT of Rs. 277.8mn on a top-line of Rs. 2,186.2. We are expecting a top-line of Rs.
   4,255.3mn in FY20E, with EBITDA and PAT margin of 26% and 10.1%, respectively. Over FY19-22E, the top-line is forecasted
   to grow by 22.7% CAGR to Rs. 5,235.7mn, while EBITDA and PAT margin would expand by 196bps and 81bps, respectively.
Valuation:
• On valuation front, at higher price band AWHCL is demanding an P/E multiple of 29.6x (to its restated FY19 EPS of Rs. 10.2),
   which is at a premium to the peer average of 25.3x. Despite the sectors favorable outlook, the performance of AWHCL is
   not encouraging, which is been marred by stagnant growth and higher receivables. The issue size is below Rs. 2,500mn, so
   the listing will take place in “T” group, thereby eliminating any speculating bets post-listing.
Thus considering the above observations, we feel that valuation is stretched and assign an “AVOID” rating for the issue.

                                                                                                                                © CHOICE INSTITUTIONAL RESEARCH
About the issue:

•   AWHCL is coming up with an initial public offering (IPO) with 6.867 - 6.886mn shares (fresh issue: 1.167 - 1.186; OFS
    shares: 5.7mn shares) in offering. The offer represents around 25.66% of its post issue paid-up equity shares of the
    company. Total IPO size is Rs. 2,031.5 - 2,060mn.

•   The issue will open on 04th Mar. 2020 and close on 06th Mar. 2020.

•   The issue is through book building process with a price band of Rs. 295 - 300 per share.

•   The issue is combination of fresh and OFS. AWHCL will not receive any proceeds from OFS. From the fresh issue net
    proceeds, the company will infuse funds in its subsidiary company for the repayment/pre-payment of certain outstanding
    debt.

•   50% of the net issue shall be allocated on a proportionate basis to qualified institutional buyers, while rest 15% and 35%
    is reserved for non-institutional bidders and retail investors, respectively.

•   Promoter holds 51.1% stake in the company and post-IPO this will come down to 48.87%. Public holding will increase
    from current 48.9% to 51.13%.

                                                Pre and post issue shareholding pattern (%)
                                                                   Pre Issue              Post Issue (at higher price band)
           Promoter & Promoter Group (%)                               51.10%                          48.87%
           Public (%)                                                  48.90%                          51.13%
             Source: Choice Equity Broking

Indicative IPO process time line:

                                                                          Unblocking of
                              Offer Closes on
                                                                          ASBA Account
                               06-Mar-2020
                                                                          13-Mar-2020

    Offer Opens on                                   Finalization of                                                    Commencement
     04-Mar-2020                                     Basis of                                 Credit to Demat           of Trading
                                                     Allotment                                Accounts                  17-Mar-2020
                                                     12-Mar-2020                              16-Mar-2020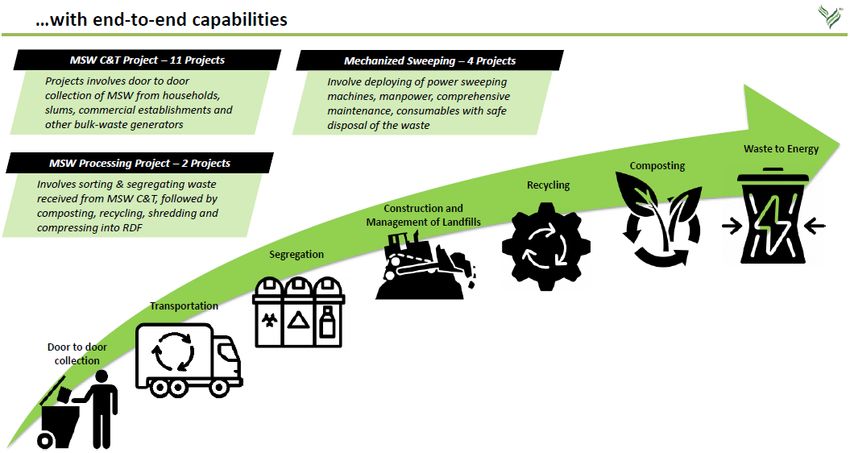
Company introduction:

AWHCL is one of the top five players in the Indian MSW management industry with an established track record of 17 years,
providing full spectrum of MSW services which includes solid waste collection, transportation, processing and disposal
services across the country, primarily catering to Indian municipalities. The company is among the select few who have
pioneered in MSW collection and transportation sector. It is among the key players in landfill construction and management
sector with in-house expertise for landfill construction along with its management. AWHCL is also present in the emerging
waste management area in India which is MSW based WTE.

The company primarily undertake: (i) MSW C&T projects which involve door to door collection of MSW from households,
slums, commercial establishments and other bulk-waste generators (community bins) from a designated area through
primary collection vehicles like compactors, dumper placers and tippers and transportation of these materials, to the
processing facility, transfer station or a landfill disposal site.; (ii) MSW processing projects which involves sorting and
segregating the waste received from MSW C&T, followed by composting, recycling, shredding and compressing into RDF, as
required; and (iii) mechanized sweeping projects which involve deploying of power sweeping machines, manpower,
comprehensive maintenance, consumables, safe disposal of the waste and any other items required for completion of the
cleaning operation of the designated areas.

              Source: Company Presentation

The company has undertaken more than 25 projects as of 01st Jan. 2020, of which 17 are ongoing. It has demonstrated its
track-record as a comprehensive service provider equipped with the resources to handle large-scale projects for
municipalities as well as private players. AWHCL’s portfolio of ongoing projects, comprised 11 MSW C&T projects, two MSW
processing (including WTE) project and four mechanized sweeping projects. All the 17 ongoing projects have started
generating revenue. The company is currently undertaking projects for the Municipal Corporation of Greater Mumbai, Navi
Mumbai Municipal Corporation, Thane Municipal Corporation, PCMC, North Delhi Municipal Corporation, Mangalore
Municipal Corporation, New Okhla Industrial Development Authority, Nagpur Municipal Corporation and the Greater Noida
Industrial Development Authority. It is also currently undertaking a project for Jaypee International Sports. In the past,
SWHCL has undertaken projects for Municipal Corporation of Delhi, Municipal Corporation, Gurgaon, Ulhasnagar Municipal
Corporation, Amritsar Municipal Corporation, Kalyan Dombivali Municipal Corporation and Jaipur Municipal Corporation. Its
strengths and capabilities are evidenced by the long-term servicing relationships that it have been able to maintain with
some of the customers.

AWHCL’s foothold in the solid waste management industry can be traced back to its incorporation in 2001. Starting with a
simple business of C&T of waste, the company has come a long way in the field of solid waste management with adoption of
latest technologies and innovations thereby transforming the business itself into a complex operation system with the use of
technologies in garbage compaction, processing, use of transfer stations, management of sanitary engineered landfills.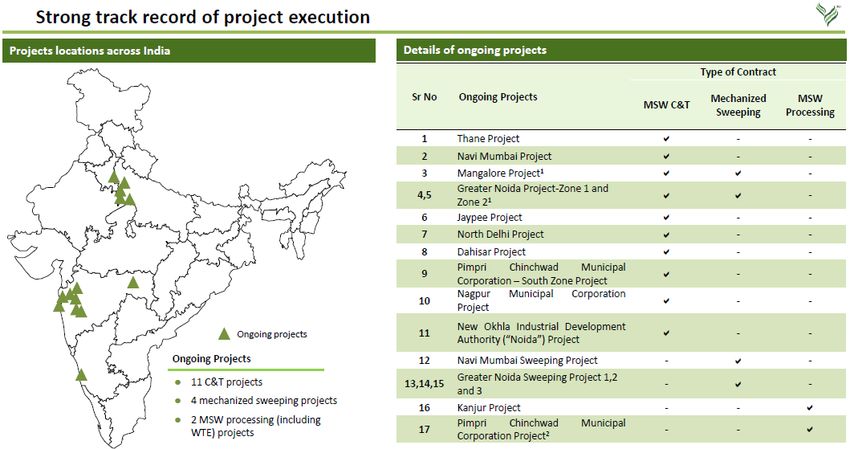
Company introduction (Contd…):

As of 01st Jan. 2020, it had a fleet of 1,089 vehicles. AWHCL procure the components for its vehicles mostly from leading
international suppliers, such as BUCHER Municipal AG and Compost System GmbH, who have been amongst the preferred
vendors for over four years. According to the company, its fleet of modern vehicles provides it with a competitive advantage
by ensuring easy availability of vehicles best suited for the projects as well as bolstering its project execution capabilities.

            Source: Company Presentation

Competition: There are around 20-30 participants in the MSW management market offering various services. Many
infrastructure and environment services companies are present in this market. Logistics companies are also present in this
market providing only transportation and fleet management services. Competitors can be categorized into two tiers -
national and local.

National participants are large infrastructure and environmental services firms. Local participants are largely transport
companies and small firms involved in making compost. Most of AWHCL’s contracts are won through a competitive bidding
process. The company’s competition varies depending on the size, nature and complexity of the project and on the
geographical region in which the project is to be executed.
Company introduction (Contd…):

 Financial performance: With periodic commencement of new and completion projects, AWHCL reported a modest
 consolidated top-line growth of 1.4% CAGR over FY17-19 to Rs. 2,836.9mn in FY19. During the period, the top-line growth
 was aided by 5.4% CAGR rise in business from services (which contributed around 87.4% to the top-line), partially offset by
 28.7% CAGR fall in the contract business. In H1 FY20, the company reported a consolidated top-line of Rs. 2,186.2mn.

 Total operating expenditure declined by 0.8% CAGR over FY17-19, leading to 8.4% CAGR rise in consolidated EBITDA to Rs.
 761.8mn in FY19. Consequently, EBITDA margin expanded by 335bps during the period to stood at 26.9% in FY19. Other
 expenses (comprising mainly of power & fuel expenses and vehicle hiring charges) and employee charges, which formed an
 average 37.9% and 22.8%, respectively, of the top-line increased by 4.1% and 4.6% CAGR over FY17-19. With closure of
 certain projects, project expenses (which formed around 13.2% of the top-line) declined by 24.3% CAGR. In H1 FY20,
 consolidated EBITDA stood at Rs. 664.7mn with a margin of 30.4%.

 Depreciation charge increased by 28.3% CAGR, mainly on account of higher vehicle asset base. Finance cost remained almost
 flat, while other income declined by 2% CAGR. Corporate tax expenses increased by 118.5% CAGR, mainly due to rise in
 effective tax rate from 14.9% in FY17 to 27.1% in FY19. As a result, reported PAT declined by 8.9% CAGR over FY17-19 to Rs.
 271.6mn in FY19. PAT margin contracted by 228bps during the period to 9.6% in FY19. In H1 FY20, reported PAT stood at Rs.
 277.8mn with PAT margin of 12.7%.

 The company had a positive operating cash flow over FY17-19, however, it declined by 19.9% CAGR to Rs. 299.2mn in FY19.
 Average operating cash flow during FY17-19 was around Rs. 377mn. Average working capital cycle stood at 21.6 days over
 FY17-19. During the period, average RoIC and RoE stood at 26.6% and 18.6%, respectively.
                     (Rs. mn)                     FY17         FY18          FY19        H1 FY20      CAGR (%)     Y-o-Y (%)
Total Operating Revenue (Gross)                  2,757.7      2,761.4       2,836.9      2,186.2        1.4%          2.7%
EBITDA                                            648.1        697.5         761.8        664.7         8.4%          9.2%
Reported PAT                                      327.0        294.1         271.6        277.8        -8.9%         -7.6%

Restated Adjusted EPS                             12.2          11.0         10.2          10.4         -8.9%       -7.6%

Cash Flow from Operating Activities               465.9        365.8         299.2        420.2        -19.9%       -18.2%
NOPLAT                                            456.9        440.1         421.9        453.2         -3.9%        -4.1%
FCF                                                            364.2         (12.1)       (15.7)                   -103.3%

RoIC (%)                                         32.8%         26.7%        20.5%         17.3%      (1,229) bps   (620) bps

Revenue Growth Rate (%)                                          0.1%        2.7%
EBITDA Growth Rate (%)                                           7.6%        9.2%
EBITDA Margin (%)                                23.5%          25.3%       26.9%         30.4%        335 bps      159 bps
Reported PAT Growth Rate (%)                                   -10.1%       -7.6%
Reported PAT Margin (%)                          11.9%          10.6%        9.6%         12.7%       (228) bps    (108) bps

Fixed Asset Turnover Ratio (x)                     1.9          1.9           1.5          0.9         -11.2%       -20.0%
Total Asset Turnover Ratio (x)                     0.8          0.6           0.6          0.4         -14.0%       -13.9%

Current Ratio (x)                                  0.9          1.2           1.1          1.2          10.3%       -1.2%
Debt to Equity (x)                                 1.3          0.9           0.9          0.9         -15.7%       -1.3%
Net Debt to EBITDA (x)                             2.3          1.7           2.1          2.8          -4.3%       24.6%

RoE (%)                                          25.1%         17.4%        13.2%         11.4%      (1,198) bps   (422) bps
RoA (%)                                          8.9%           6.9%         5.3%          4.7%       (359) bps    (155) bps
RoCE (%)                                         18.8%         17.7%        14.3%         11.8%       (442) bps    (334) bps
  Source: Choice Equity Broking
Competitive strengths:
• A leading service provider in MSW management sector with end-to-end
capabilities
• Strong track record of project execution
• De-risked business model with diverse portfolio of projects
• Strong base of modern and well-maintained fleet of vehicles
• Experienced promoters and management team with strong domain
expertise
Business strategy:
• Capitalize on the growth opportunities in the MSW management sector by
continued focus on bidding for MSW projects
• Continue with rational selection of projects and strategically expand
geographical footprint
• Moving up the MSW value chain by increasing the presence in emerging
waste management areas in India like WTE domain
• Continue to focus on enhancing operational efficiency
Risk and concerns:
• Continued economic slowdown
• Governments poor/lower allocation towards waste management
projects
• Revenue concentration risk
• Project renewal risk
• Labor and working capital intensive business
• Intense competition
© CHOICE INSTITUTIONAL RESEARCHFinancial statements:
Consolidated profit and loss statement (Rs. mn)
CAGR over Annual Growth
FY17 FY18 FY19 H1 FY20
FY17 - 19 (%) over FY18 (%)
Total Operating Revenue (Gross) 2,757.7 2,761.4 2,836.9 2,186.2 1.4% 2.7%
Purchase of Traded Goods (2.5) (29.3) (37.9) (4.8) 291.7% 29.2%
Changes in Inventories of Stock-in-Trade (1.4) 0.3 0.4 (0.2) 38.5%
Project Expenses (489.5) (333.5) (280.3) (278.7) -24.3% -16.0%
Employee Benefits Expense (606.1) (639.5) (663.2) (442.3) 4.6% 3.7%
Other Expenses (1,010.1) (1,061.8) (1,094.1) (795.6) 4.1% 3.0%
EBITDA 648.1 697.5 761.8 664.7 8.4% 9.2%
Depreciation and Amortization (111.4) (127.1) (183.3) (105.8) 28.3% 44.2%
EBIT 536.7 570.4 578.5 558.9 3.8% 1.4%
Finance Costs (252.9) (228.9) (249.9) (139.2) -0.6% 9.2%
Other Income 154.4 146.4 148.3 70.0 -2.0% 1.3%
PBT 438.2 487.9 476.8 489.7 4.3% -2.3%
Tax Expenses (27.8) (89.0) (132.6) (111.2) 118.5% 48.9%
PAT Before Minority Interest 410.4 398.8 344.2 378.4 -8.4% -13.7%
Minority Interest (83.4) (104.8) (72.6) (100.6) -6.7% -30.7%
Reported PAT 327.0 294.1 271.6 277.8 -8.9% -7.6%
Consolidated balance sheet statement (Rs. mn)
CAGR over Annual Growth
FY17 FY18 FY19 H1 FY20
FY17 - 19 (%) over FY18 (%)
Equity Share Capital 13.1 13.1 71.5 71.5 133.8% 446.7%
Other Equity 901.9 1,188.1 1,429.4 1,698.3 25.9% 20.3%
Minority Interest 385.8 490.6 563.3 663.8 20.8% 14.8%
Long Term Borrowings 1,302.3 1,218.9 1,530.9 1,759.8 8.4% 25.6%
Non Current Financial Liabilities (Lease Liability) 17.8 20.0 21.9 20.4 11.0% 9.8%
Long Term Provisions 155.0 213.4 303.0 376.7 39.8% 42.0%
Deferred Tax Liabilities (Net) 85.5 83.8 115.6 131.1 16.3% 38.0%
Short Term Borrowings 329.1 306.8 307.1 310.8 -3.4% 0.1%
Trade Payables 159.8 316.0 362.0 412.4 50.5% 14.6%
Short Term Provisions 18.2 39.9 46.1 52.7 59.2% 15.5%
Current Financial Liabilities 202.1 278.9 235.2 270.0 7.9% -15.7%
Current Tax Liabilities (Net) 27.6 72.6 73.3 52.7 63.1% 1.1%
Other Current Liabilities (Statutory Dues) 71.6 38.8 48.5 45.3 -17.7% 24.9%
Total Liabilities 3,669.6 4,280.7 5,107.9 5,865.6 18.0% 19.3%
472.4 414.7 606.1 881.3 13.3% 46.1%
Intangible Assets 1,050.0 1,193.7
Capital Work-in-Progress 48.3 151.0 150.3 76.9%
Intangible Assets Under Development 926.8 1,055.9 81.9 121.5 -70.3% -92.2%
Non Current Trade Receivables 331.4 284.0 330.3 373.1 -0.2% 16.3%
Long Term Loans (Security Deposits) 19.7 19.2 22.1 27.5 5.9% 15.0%
Non Current Financial Assets 1,029.9 1,190.2 1,506.5 1,571.1 20.9% 26.6%
Deferred Tax Assets (Net) 42.8 63.6 91.9 90.8 46.5% 44.5%
Income Tax Assets (Net) 38.9 57.8 70.5 76.9 34.6% 21.9%
Other Non Current Assets 69.6 61.4 96.8 45.2 17.9% 57.6%
Inventories 0.3 0.5 0.9 0.7 79.3% 66.7%
Trade Receivables 339.3 442.7 556.8 578.4 28.1% 25.8%
Cash and Cash Equivalents 126.7 336.0 219.5 225.4 31.6% -34.7%
Short Term Loans (Security Deposits) 14.9 54.4 18.4 21.2 11.4% -66.1%
Current Financial Assets 87.6 180.3 127.9 210.0 20.9% -29.1%
Other Current Assets 70.0 81.9 137.5 260.1 40.1% 67.9%
Assets Held for Sale 51.2 38.1 39.9 38.4 -11.7% 4.6%
Total Assets 3,669.6 4,280.7 5,107.9 5,865.6 18.0% 19.3%
Source: Choice Equity Broking
© CHOICE INSTITUTIONAL RESEARCHFinancial statements:
Consolidated cash flow statement (Rs. mn)
CAGR over Annual Growth
Particulars (Rs. mn) FY17 FY18 FY19 H1 FY20
FY17 - 19 (%) over FY18 (%)
Profit Before Tax 438.2 487.9 476.8 489.7 4.3% -2.3%
Cash Flow Before Working Capital Changes 702.8 741.9 819.8 707.5 8.0% 10.5%
Change in Working Capital (196.0) (290.7) (379.7) (167.6) 39.2% 30.6%
Cash Flow from Operating Activities 465.9 365.8 299.2 420.2 -19.9% -18.2%
Purchase of Property , Plant & Equipment (441.4) 29.5 (625.0) (574.8) 19.0% -2215.8%
Cash Flow from Investing Activities (261.3) 140.6 (537.5) (535.7) 43.4% -482.3%
Repayment of Long Term Borrowings (200.2) (356.5) (249.4) (160.4) 11.6% -30.1%
Cash Flow from Financing Activities (420.6) (300.3) 119.1 121.4 -139.7%
Net Cash Flow (216.0) 206.2 (119.2) 5.9 -25.7% -157.8%
Opening Balance of Cash and Bank Balances 324.8 108.8 314.9 195.7 -1.5% 189.5%
Closing Balance of Cash and Bank Balances 108.8 314.9 195.7 201.6 34.1% -37.9%
Consolidated financial ratios
Particulars (Rs. mn) FY17 FY18 FY19 H1 FY20
Revenue Growth Rate (%) 0.1% 2.7%
EBITDA Growth Rate (%) 7.6% 9.2%
EBITDA Margin (%) 23.5% 25.3% 26.9% 30.4%
EBIT Growth Rate (%) 6.3% 1.4%
EBIT Margin (%) 19.5% 20.7% 20.4% 25.6%
Reported PAT Growth Rate (%) -10.1% -7.6%
Reported PAT Margin (%) 11.9% 10.6% 9.6% 12.7%
Liquidity ratios
Current Ratio 0.9 1.2 1.1 1.2
Debt Equity Ratio 1.3 0.9 0.9 0.9
Net Debt to EBITDA 2.3 1.7 2.1 2.8
Turnover ratios
Inventories Days 0.0 0.1 0.1 0.1
Debtor Days 44.9 51.7 64.3 96.6
Payable Days (21.1) (31.4) (43.6) (68.9)
Cash Conversion Cycle 23.8 20.3 20.8 27.8
Fixed Asset Turnover Ratio (x) 1.9 1.9 1.5 0.9
Total Asset Turnover Ratio (x) 0.8 0.6 0.6 0.4
Return ratios
RoE (%) 25.1% 17.4% 13.2% 11.4%
RoA (%) 8.9% 6.9% 5.3% 4.7%
RoCE (%) 18.8% 17.7% 14.3% 11.8%
Per share data
Restated Reported EPS (Rs.) 12.2 11.0 10.2 10.4
Restated BVPS (Rs.) 48.6 63.2 77.2 91.0
Restated Operating Cash Flow Per Share (Rs.) 17.4 13.7 11.2 15.7
Restated Free Cash Flow Per Share (Rs.) 13.6 (0.5)
Note: Ratios calculated on pre-issue data; Source: Company RHP
© CHOICE INSTITUTIONAL RESEARCHDisclaimer
This is solely for information of clients of Choice Broking and does not construe to be an investment advice. It is also not
intended as an offer or solicitation for the purchase and sale of any financial instruments. Any action taken by you on the
basis of the information contained herein is your responsibility alone and Choice Broking its subsidiaries or its employees or
associates will not be liable in any manner for the consequences of such action taken by you. We have exercised due
diligence in checking the correctness and authenticity of the information contained in this recommendation, but Choice
Broking or any of its subsidiaries or associates or employees shall not be in any way responsible for any loss or damage that
may arise to any person from any inadvertent error in the information contained in this recommendation or any action
taken on basis of this information. This report is based on the fundamental analysis with a view to forecast future price. The
Research analysts for this report certifies that all of the views expressed in this report accurately reflect his or her personal
views about the subject company or companies and its or their securities, and no part of his or her compensation was, is or
will be, directly or indirectly related to specific recommendations or views expressed in this report. Choice Broking has
based this document on information obtained from sources it believes to be reliable but which it has not independently
verified; Choice Broking makes no guarantee, representation or warranty and accepts no responsibility or liability as to its
accuracy or completeness. The opinions contained within the report are based upon publicly available information at the
time of publication and are subject to change without notice. The information and any disclosures provided herein are in
summary form and have been prepared for informational purposes. The recommendations and suggested price levels are
intended purely for stock market investment purposes. The recommendations are valid for the day of the report and will
remain valid till the target period. The information and any disclosures provided herein may be considered confidential. Any
use, distribution, modification, copying, forwarding or disclosure by any person is strictly prohibited. The information and
any disclosures provided herein do not constitute a solicitation or offer to purchase or sell any security or other financial
product or instrument. The current performance may be unaudited. Past performance does not guarantee future returns.
There can be no assurance that investments will achieve any targeted rates of return, and there is no guarantee against the
loss of your entire investment.
POTENTIAL CONFLICT OF INTEREST DISCLOSURE (as on date of report) Disclosure of interest statement – • Analyst
interest of the stock /Instrument(s): - No. • Firm interest of the stock / Instrument (s): - No.
+91-022-6707 9999 www.choicebroking.in +91-022-6707 9959
Choice Equity Broking Pvt. Ltd.
Choice House, Shree Shakambhari Corporate Park, Plot No: -156-158,
J.B. Nagar, Andheri (East), Mumbai - 400 099.You can also read