ELE Corporate Presentation November 2020 - Elemental Royalties
←
→
Page content transcription
If your browser does not render page correctly, please read the page content below
Corporate Presentation
       November 2020
                         | ELE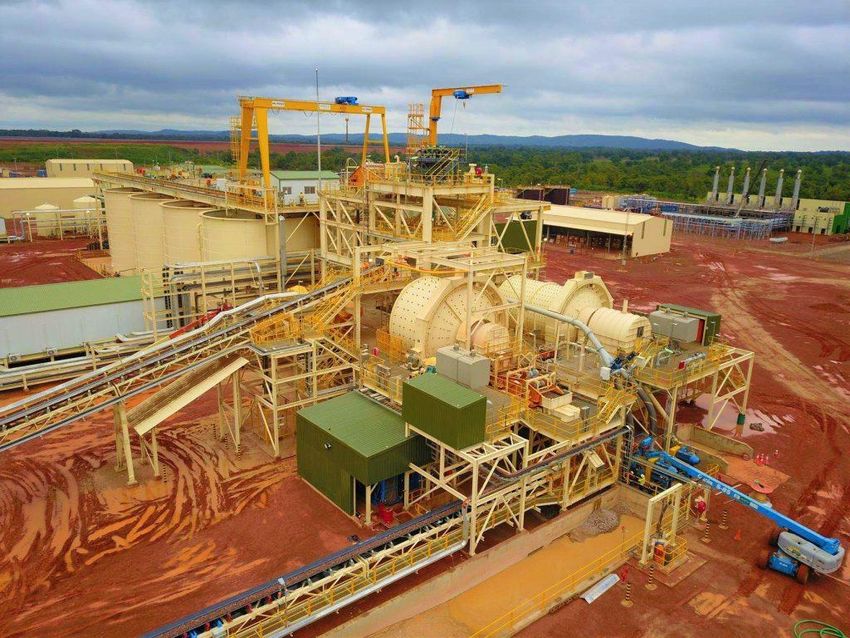
|   ELE
Forward Looking Statements

Market and Industry Data
This corporate presentation includes market and industry data and forecast that were obtained from third-party sources, industry publications and publicly available information. Third-party sources generally state that
the information therein has been obtained from sources believed to be reliable, but there can be no assurances as to the accuracy or completeness of included information. Although management believes it to be
reliable, management has not independently verified any of the data from third-party sources referred to in this presentation, or analyzed or verified the underlying studies or surveys relied upon or referred to by such
sources, or ascertained the underlying economic assumptions relied upon by such sources.
Forward-Looking Statements
This corporate presentation contains “forward-looking information” within the meaning of applicable Canadian securities laws and “forward-looking statements” within the meaning of the United States Private
Securities Litigation Reform Act of 1995, (together, “forward-looking statements”), concerning the business, operations and financial performance and condition of the Company. Forward-looking statements include, but
are not limited to, statements with respect to the future price of gold, the estimation of mineral reserves and mineral resources; the realization of Mineral Reserve estimates; and the timing and amount of estimated
future production. Generally, forward-looking statements can be identified by the use of forward-looking terminology such as “plans,” “expects” or “does not expect,” “is expected,” “budget,” “scheduled,” “estimates,”
“forecasts,” “intends,” “anticipates” or “does not anticipate,” “believes,” “projects” or variations of such words and phrases or state that certain actions, events or results “may,” “could,” “would,” “might” or “will be taken,”
“occur” or “be achieved.” Forward-looking statements are based on the opinions and estimates of management as of the date such statements are made, and they are subject to known and unknown risks, uncertainties
and other factors that may cause the actual results, level of activity, performance or achievements of the Company to be materially different from those expressed or implied by such forward-looking statements,
including, but not limited to, volatility in the price of gold, discrepancies between anticipated and actual production by companies in our portfolio, risks inherent in the mining industry to which the companies in our
portfolio are subject, regulatory restrictions, the impact of the current COVID-19 pandemic on the companies in our portfolio, activities by governmental authorities (including changes in taxation), currency fluctuations
and the accuracy of the mineral reserves, resources and recoveries set out in the technical data published by the companies in our portfolio. Although management of the Company has attempted to identify important
factors that could cause actual results to differ materially from those contained in forward-looking statements, there may be other factors that cause results not to be as anticipated, estimated or intended. There can be
no assurance that such statements will prove to be accurate, as actual results and future events could differ materially from those anticipated in such statements. Accordingly, readers should not place undue reliance on
forward-looking statements. The Company cautions readers not to place undue reliance on forward-looking statements, as forward-looking statements involve significant risks and uncertainties. Forward-looking
statements should not be read as guarantees of future performance or results and will not necessarily be accurate indications of whether or not the times at or by which such performance or results will be achieved. The
Company does not undertake to update any forward-looking statements except in accordance with applicable Canadian securities laws. Readers are directed to the Company’s Filing Statement filed under the
Company’s profile on SEDAR (www.sedar.com) for a complete list of applicable risk factors.
Investors are advised that National Instrument 43-101 Standards for disclosure for Mineral Projects (“NI 43-101”) of the Canadian Securities Administrators requires that each category of Mineral Reserves and Mineral
Resources be reported separately. Mineral Resources that are not Mineral Reserves do not have demonstrated economic viability.
JORC Code
Certain Resource and Reserve estimates covering properties related to certain mining assets in this corporate presentation have been prepared in reliance upon the JORC Code. Estimates based on JORC Code are
recognized under NI 43-101 in certain circumstances. In each case, the Mineral Resources and Mineral Reserves included in this presentation are based on estimates previously disclosed by the relevant property owner
or operator, without reference to the underlying data used to calculate the estimates. Accordingly, the Company is not able to reconcile the Resource and Reserve estimates prepared in reliance on JORC Code with that
of CIM definitions. The Company previously sought confirmation from its Qualified Person who is experienced in the preparation of Resource and Reserve estimates using CIM and JORC Code, of the extent to which an
estimate prepared under JORC Code would differ from that prepared under CIM definitions. The Company was advised that, while the CIM definitions are not identical to those of JORC Code, the Resource and Reserve
definitions and categories are substantively the same as the CIM definitions mandated in NI 43-101 and will typically result in reporting of substantially similar Reserve and Resource estimates.
Cautionary Note to U.S. Investors Concerning Estimates of Measured, Indicated or Inferred Resources
This corporate presentation uses the terms “measured”, “indicated”, and “inferred” Mineral Resources. United States investors are advised that while such terms are recognized and required by Canadian regulations, the
United States Securities and Exchange Commission does not recognize these terms. “Inferred Mineral Resources” have a great amount of uncertainty as to their existence, as to their economic and legal feasibility. It
cannot be assumed that all or any part of an inferred Mineral Resource will ever be upgraded to a higher category. Under Canadian rules, estimates of inferred Mineral Resources mat not form the basis of feasibility or
other economic studies. United States investors are cautioned not to assume that all or any part of measured or indicated Mineral Resources will ever be converted into Mineral Reserves. United States investors are
also cautioned not to assume that all or part of an inferred Mineral Resource exist, or is economically or legally mineable.
                                                                                                                                                                                                            2
Qualified Person
Richard Evans, FAusIMM, is Senior Vice President, Technical for the Company and a qualified person under National Instrument 43-101 – Standards of Disclosure for Mineral Projects, has reviewed and approved the
scientific and technical disclosure contained in this presentation.

                                                                                                                                                                                                                                                 2
|   ELE

       Introduction to Elemental
       Invest in producing gold royalties with platform for growth

                                                                      Elemental Revenue Growth (US$m)
 •      Cash-generating gold royalty company targeting near-term                                                                                           5.2
        growth through material acquisitions
                                                                      1.5                                                                                            5.0
                                                                                 Kwale
 •      Since 2017, Elemental has acquired five producing royalties              Amancaya
                                                                      1.2        Wahgnion                                                                            4.0
                                                                                 Mt Pleasant
 •      Growth in pipeline – Mercedes royalty paying from 2022                   Annual Revenue (Trailing 12m, RHS)
                                                                      0.9                                                             2.4                            3.0
 •      Estimated US$5.2 million Revenue in 2020, 85% from gold
                                                                      0.6                                        1.4                                                 2.0
 •      Experienced team with a proven track record and material
        ownership (24%)                                               0.3                                                                                            1.0
                                                                                           0.4

 •      Uncapped Revenue and No Buybacks: future increases in           -                                                                                            -
        Reserves will deliver value to Elemental at zero cost               Q1   Q2   Q3   Q4    Q1   Q2   Q3    Q4    Q1   Q2   Q3   Q4    Q1   Q2   Q3   Q4

                                                                                  2017                 2018                  2019                 2020

Source: Elemental Q4 estimates. Gold price US$1,900/oz
                                                                                                                                                                           3
|   ELE
Royalty & Streaming Model Benefits

                       Clear strategy                               Established operators
           Disciplined, accretive acquisitions to date          Track record and reliable cash flow

                       Low overheads                             Experienced Management
      No funding commitments, funds available to reinvest       Scalable model, targeting growth

                Geographically diversified                         Exploration upside free
                         Reduced risk                       Many assets produce beyond original lives

                                                                                                                  4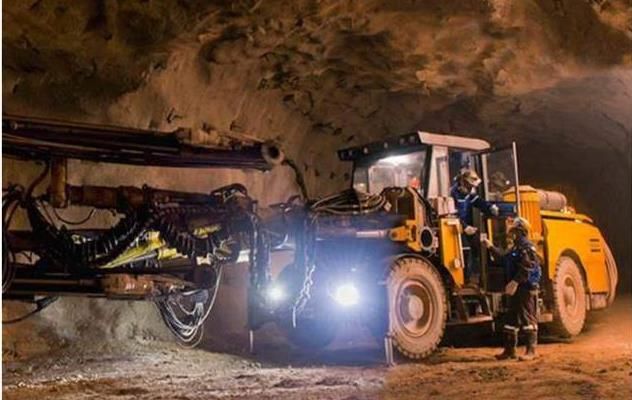
|   ELE

       Diverse Cash-Generating Portfolio
       Gold-focused portfolio across countries and top tier operators

        Preferred Commodity                        Producing Assets                     Strong Operators                    Proven Jurisdictions
        Direct exposure to gold production         Minimises funding or construction    Reduces corporate, management and   Protection from local political
                                                   risks outside of Elemental control   operational/technical risk          instability, expropriation, policy
            Gold                Silver
            85%                  4%                                                                                         changes
                                         Mineral   Producing
                                         Sands        98%
                                          11%

               2020E Revenue by Commodity1                 September 2020 NAV1

Source: Elemental estimates
                                                                                                                                                                           5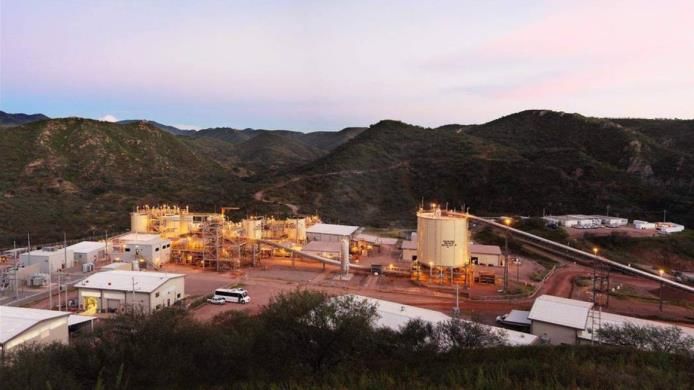
|   ELE
Capital Structure

  Elemental Shares Outstanding (m)                     44.5   Equity Research Coverage                 Analyst     Target Price

  Share Price (C$/share)1                              1.60

  Market Capitalisation (US$m)                         53.4                                         Carey McRury     C$2.25

  Cash (US$m)2                                         10.5
                                                                                                     Kerry Smith     C$2.50
  Enterprise Value (US$m)                              42.9

                                                              Selected Institutional Shareholders
         Directors and
         Management                          Private
             24%                              41%

                 Institutional
                     35%

  1.   Close price as of November 16, 2020
  2.   As of November 17, 2020                                                                                                              6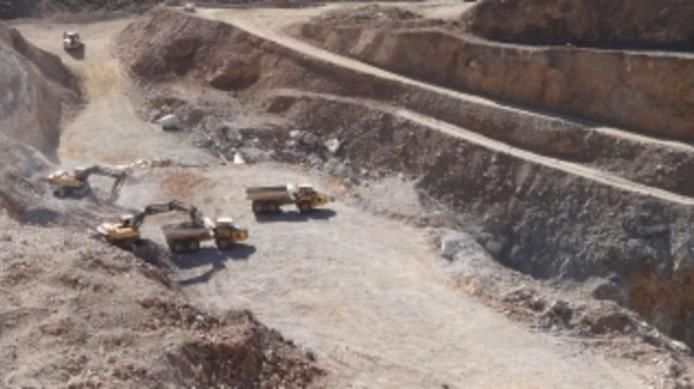
|   ELE
Board and Management Team

            Experienced and incentivised management team, who have grown Elemental from zero to US$[50]m valuation

  Elemental Board

                     Frederick Bell                Peter Williams                     John Robins                     Martin Turenne
                              CEO                        Director                         Director                            Director
                          Director

  Management Team                                                                                Advisory Panel

                          Richard Evans                               David Baker                                    Matthew Tack
                    Senior Vice President                            Vice President                                  Advisory Panel
                                Technical                    Business Development

                            Greg Owen                               Matt Anderson                                     Jim Paterson
                          Vice President                                     CFO                                     Advisory Panel
                             Operations

  Mining Corporate and Finance Experience:

                                                                                                                                                7
|      ELE
Corporate Timeline
 Highlights                                                                                                             Investment Opportunity
 • Acquired a portfolio of cash-generating and growth royalties over three years prior to listing                       • Ideal platform for growth with a base of five
 • Targeted advanced gold royalties in top-tier mining jurisdictions                                                      producing royalties
 • Raised and deployed US$18.5m as a private company                                                                    • Completed RTO onto TSX-V in July 2020 alongside
                                                                                                                          C$24.0m equity fundraise
                                                                                                                        • Experienced management team in place to continue
                                                                                                                          targeting accretive transactions in the precious
                                                                                                                          metals sector

                                                                                             2020
                                                                   2019
2017

                                   2018
                                                                                                                        • Best positioned to complete deals: proposed
                                                                                                                          US$20.0m acquisition facility, C$13.5m cash

    Q1      Q2       Q3       Q4        Q1   Q2      Q3       Q4         Q1   Q2   Q3     Q4          Q1   Q2         Q3

   Panton &               Mt Pleasant             Mercedes &                            Wahgnion                TSX-V Listing      Future Accretive Acquisitions
   Kwale                  acquisition             Amancaya                              acquisition
                                                                                                                                   Continue to target producing or near-term
   acquisitions           completed               acquisitions                          completed               Listed on the
                                                                                                                                   producing royalties over quality precious
   completed                                      completed                                                     TSX Venture
                                                                                                                                   metals assets
                          A$10/oz or 0.5%                                               1% NSR on               Exchange in
   Panton
                          NPI on                  Mercedes                              producing gold          conjunction
   0.5% NSR on                                                                                                                     Reserves and Resources Growth
                          producing gold          1% NSR on                             mine in Burkina         with C$24m
   Pre-Feasibility        mine in                                                       Faso                    fundraise          Future increases in Reserves and Resources
                                                  producing gold &
   PGM project in         Australia                                                                                                from exploration at existing assets delivers
                                                  silver mine in
   Australia                                                                                                                       additional value to Elemental at zero cost
                                                  Mexico
   Kwale
                                                  Amancaya
   0.25% GRR on
                                                  2.25% NSR on
   mineral sands
                                                  producing gold &
   mine in Kenya
                                                  silver mine in Chile                                                                                                                  8
|   ELE
Proven History of Shareholder Returns Since Incorporation

Since its first acquisition in 2017, Elemental has generated consistent returns for shareholders; both whilst as a private company, and after
                                                              listing in July 2020

                                       Equity Raise                                             Equity Price1
  Date                                                           Acquisitions                                            Share Price Growth
                                         (US$m)                                                  (C$/share)

  February 2017                            1.0                 Kwale, Panton                        0.29                      452%

  December 2017                            0.8                Mount Pleasant                        0.52                      208%

  August 2018                              4.0             Mercedes, Amancaya                       0.87                       84%

  December 2019                            4.5                   Wahgnion                           1.01                       58%

  July 2020                               18.0               Reverse Take Over                      1.30                       23%

*Share Price as of November 17, 2020
                                                                                                                                                          9
|   ELE
Asset Snapshot

     MERCEDES
     1.0% NSR
   FROM JULY 2022

                                                                           KWALE            PANTON
                                                                         0.25% GRR          0.5% NSR

          AMANCAYA
          2.25% NSR                WAHGNION
                                                                              MT PLEASANT
                                     1.0% NSR
                                                                               A$10/OZ OR
                                                                                 5% NPI

                      Principal Royalties       Other Royalties   Management and Board
                                                                                                       10
| ELE
District-Scale Licences – Free Carry on Exploration and Capital Expenditure
Future increases in Resources and Reserves over district-scale licence areas continue to deliver value to Elemental at zero cost
Mercedes: 692km2
Wahgnion: 1,022km2
Announced 25% production increase from 2020-2025 “Ongoing exploration has returned positive results and is
prioritized on extending mine life through the growth of
“The exploration program has recommenced with the intent of
reserves in proximity to existing mine workings and the
replacing reserves and extending the mine life.”
delineation of future resources”
Teranga Gold - September 2020 News Release Premier Gold - August 2020 Press Release 11| ELE
Revenue Growth through Existing Royalty Portfolio
Kwale Amancaya Mt Pleasant Targeting further material
accretive acquisitions
• Elemental team has targeted near term production
Wahgnion Mercedes since first transaction in 2017
7
6.6
• Grown from US$0.4m revenue in 2017 to an
estimated US$5.2m in 2020
6 5.8
5.4
5.2 • Transformational acquisitions in producing gold
Gross Royalty Revenue (US$m)
royalties increases the size and diversity of the
5
revenue streams
4 • Disciplined use of capital as a private company –
now can revisit deals that were not suitable for
Elemental at the time
3
2.4 • Future growth locked in - Mercedes royalty
payable from July 2022 following a time hurdle
2
1.4 • Expected upgrading of Mineral Resources into
Reserves and commencement of small-scale
1 mining operations at Mount Pleasant
0.4
• Ideal base for further accretive transactions
--
2017 2018 2019 2020 2021 2022 2023
Note: Estimated gold Price US$1,900/oz Q4/2020, US$1,850/oz 2021, US$1800/oz thereafter. 2020E includes Revenue to September 30, 2020 and anticipated Q4/2020 Revenue. Includes anticipated Mineral Resource conversion to Mineral Reserves at
Amancaya and Kwale, and small-scale mining on Mt Pleasant royalty area. Wahgnion production profile from News Release dated August 6, 2020 and available at www.terangagold.com
12| ELE
Strong Growth Pipeline
Elemental best positioned to continue accretive acquisitions
Three years operating pre-RTO, acquired six
royalties, built database and industry
relationships
Existing deal pipeline
Ongoing shareholder introductions
Listed company lowers cost of capital Skilled, cohesive management team built over
vs private company three years prior to listing
Ability to offer equity at ground floor UK, Australia, Canada based teams have exposure
valuation – attractive for deal targets to different opportunities vs peers
Moderate leverage allows Supported by Discovery Group, Tembo Capital,
growth without dilution and an experienced Board & Advisory Panel
13| ELE
Targeting Portfolio Acquisitions
Elemental can deliver multiples of cash returns to counterparties by offering equity participation in transformational portfolio deals
Royalty Portfolio Vendor Date Portfolio Acquiror Share Price Gain*
July 2016 13 royalties 534%
December 2016 11 royalties 121%1
July 2017 3 royalties, 1 stream 348%
May 2018 54 royalties 108%
April 2019 15 royalties 98%
December 2019 20+ royalties 20%
10 royalties, streams, and gold
February 2020
loans 70%
*Share Price gain from transaction announcement to September 30, 2020, adjusted for dividends and share splits. Source: Capital IQ. Transactions typically have a mix of cash and equity consideration.
1. Goldfields sold their equity investment on 6 June 2019
14| ELE
Producing Focus
Majority of value attributable to producing assets
98%
100% 94%
98% of Elemental NAV
attributable to producing assets.
76% Similar values only seen in larger
% of NAV in Producing Assets
75%
66% royalty peers
50%
41% 41%
25%
6%
0%
ELE FNV WPM MMX SSL OR MTA
Source: CIBC Research published December 12, 2019, Elemental estimates 15| ELE
Attractive Value Proposition
Elemental most attractively priced precious metals royalty company
68.5 179.6
40x Royalty peers typically
Price to H1/2020 Annualised Revenue
trading at higher
29.6
30x Price/Revenue multiples
20.0 20.4
20x 17.6 18.2
15.2
13.4
10.9
10x
0x
Elemental Osisko Royal Gold Maverix Sandstorm Wheaton Nomad Franco Ely Metalla
Nevada
H1/2020 Revenue
2.5 69.7 256.4 20.3 40.1 502.7 12.4 435.9 1.0 1.0
(US$m)
Source: Company Filings. Revenue to June 30, 2020. Metalla Revenue six months to May 31, 2020. Market Capitalisations from Capital IQ as of November 30, 2020 16| ELE
Strong Peer Performance following Listing
700% Producing Royalties on Listing
Maverix Metals +647% 5
4
Metalla Royalty 3
600% 2
1
0
ELE Maverix Metals Metalla Royalty
500%
+540%
Annual Revenue on Listing (US$m)
400%
5
4
3
300% 2
1
0
ELE Maverix Metals Metalla Royalty
200%
Market Capitalisation on Listing (US$m)
100% 80
60
40
0% 20
0 3 6 9 12 15 18 21 24 27 30 33 36 39 42
0
ELE Maverix Metals Metalla Royalty
Months from Listing
Source: Capital IQ, Company filings
17| ELE
Royalty Company Outperformance
800%
GDX - Gold Miners Equity ETF Gold Royalty Index
636%
700%
600%
500%
400%
300%
244%
200%
100%
131%
0%
2008 2009 2010 2011 2012 2013 2014 2015 2016 2017 2018 2019 2020
Source: Capital IQ. Royalty index consists of FNV, RGLD & WPM. Share price performance rebased to Dec 2007.
18| ELE
Investment Case
An opportunity to invest in high quality gold royalties with exciting growth prospects
Elemental Royalties Summary Investment Case
• Ground floor investment opportunity into a growing gold • Underpinned by 4 cash-generating royalties
royalty company
• 85% of revenues from gold, 4% from silver
• 98% of NAV in producing assets
• Organic growth with Mercedes royalty paying from July
• Clear strategy to acquire cash-generating royalties 2022
• Demonstrated ability to find, evaluate and complete deals • Listing unlocks deal pipeline – utilising cash, leverage and
on producing royalties equity for accretive acquisitions
• Experienced management team with strong track record • Equity attractive to royalty counterparties to achieve
and support from Discovery Group, mining connected market multiples versus simple cash returns
shareholders, and Advisory Panel
19| ELE
Contacts
LONDON VANCOUVER EMAIL
123 Buckingham Palace Road General Enquiries:
Suite 1020 – 800 West Pender Street
London SW1W 9SH info@elementalroyalties.com
Vancouver, British Columbia
United Kingdom
V6C 2V6 Opportunities:
Canada opportunities@elementalroyalties.com
PHONE
+44 (0) 20 3983 7040
20Appendix 1 Asset Overviews
|   ELE
Portfolio: Wahgnion

   Project
                     Location:           Burkina Faso
                    Operator:            Teranga Gold
                                         TSX: TGZ
                                         Market Capitalisation US$1.9bn
                Commodity:               Gold
                  Mine Type:             Open pit
                          Stage:         Production
       2020E Production:                 150-165koz Au
                 Mine Life:
                                         11 years
            (Reserves only)

   Royalty
                       Royalty:          1% NSR
                   Deal Date:            January 2020
           2020E Revenue:                US$2.7m

   Reserves & Resources
                     Reserves:           1.55Moz @ 1.59 g/t Au
         Resources (M&I):                2.37Moz @ 1.49g/t Au
            Resources (Inf):             0.24Moz @ 1.41g/t Au
   Source: NI 43-101 Technical Report on the Wahgnion Gold Operations dated July 31, 2019 available on the Company’s website at www.terangagold.com and SEDAR at www.sedar.com.
   Mineral Reserves are included in Mineral Resources. Market Capitalisation from Capital IQ as of November 16, 2020. Mineral Reserve and Resource Statement in Appendix
   2020 estimated production and revenue based on production guidance, published on August 8, 2020, on Teranga’s website at a US$1,900/oz gold price
                                                                                                                                                                                        22
| ELE
Portfolio: Amancaya
Project
Location: Chile
Operator: Austral Gold Ltd
ASX: AGD
Market Capitalisation US$97m
Commodity: Gold & Silver
Mine Type: Open pit & Underground
Stage: Production
2019 Production: 56koz Au, 527koz Ag
Mine Life: 2 years, ongoing exploration for Resource
(Reserves only) conversion and new prospects in royalty area
Royalty
Royalty: 2.25% NSR
Deal Date: June 2018
2019 Revenue: US$1.7m
Reserves & Resources
Reserves: 102koz Au @ 6.3g/t Au, 470koz Ag @ 29g/t Ag
Resources (M&I): 171koz Au @ 8.8g/t Au, 748koz Ag @ 38g/t Ag
Resources (Inf): 140koz Au @ 5.9g/t Au, 426koz Ag @ 18g/t Ag
Source: Austral Gold Limited’s 2019 Annual Report dated March 5, 2020. The report is prepared in accordance with NI 43-101 and is available on the Austral Gold’s website at www.australgold.com and SEDAR at www.sedar.com
Mineral Reserves are included in Mineral Resources. Market Capitalisation from Capital IQ as of November 16, 2020. Mineral Reserve and Resource Statement in Appendix
23| ELE
Portfolio: Mercedes
Project
Location: Mexico
Operator: Premier Gold Ltd
TSX: PG
Market Capitalisation US$468m
Commodity: Gold & Silver
Mine Type: Underground
Stage: Operating
2019 Production: 60koz Au, 191koz Ag
Mine Life: 6 years, awaiting updated Reserve and Resource
(Reserves only) estimate following 40,840m 2019 drilling program
Royalty
Royalty: 1% NSR after hurdle (July 2022)
Deal Date: June 2018
2019 Revenue: n/a
Reserves & Resources
Reserves: 395koz Au @ 3.6g/t Au, 2.7Moz Ag @ 25g/t Ag
Resources (M&I): 356koz Au @ 3.4g/t Au, 4.0Moz Ag @ 38g/t Ag
Resources (Inf): 231koz Au @ 4.2g/t Au, 2.0Moz Ag @ 36g/t Ag
Source: Premier Gold Mines Limited’s Management Discussion and Analysis for the year ending December 31, 2019. The report is prepared in accordance with NI 43-101 and is available on Premier’s company profile at www.sedar.com
Mineral Reserves are not included in Mineral Resources. Market Capitalisation from Capital IQ as of November 16. 2020. Mineral Reserve and Resource Statement in Appendix 24| ELE
Portfolio: Other Assets
Asset Information Kwale Mt Pleasant Panton
Location: Kenya West Australia West Australia
Operator: Base Resources Ltd Zijin Mining Group Panoramic Resources Ltd
ASX/AIM: BSE HKSE: 2899 ASX: PAN
Market Capitalisation US$237m Market Capitalisation US$30bn Market Capitalisation US$218m
Commodity: Mineral Sands Gold Platinum, Palladium, Gold
Mine Type: Open Pit Open-pit & underground Open-pit & Underground
Stage: Production Production Historical feasibility study
74kt Rutile, 348kt Ilmenite,
2019 Production: 2.2koz Au -
31kt Zircon
Mine Life:
4 years - -
(Reserves only)
Royalty
Royalty: 0.25% GRR A$10/oz or 5% NPI 0.5% NSR
Deal Date: Feb 2017 Sept 2017 Feb 2017
2019 Revenue: US$0.5m US$0.02m n/a
Reserves & Resources
Reserves: 1.4Mt HM @ 3.4% HM -
Resources (M&I): 2.4Mt HM @ 3.1% HM 469koz Au @ 1.9g/t1 879koz Pt @ 2.3g/t, 963koz Pd @ 2.5g/t
Resources (Inf): - 711koz Au @ 2.8g/t1 129koz Pt @ 1.9g/t, 139koz Pd @ 2.0g/t
Source: Market Capitalisation from Capital IQ as of November 16, 2020.
Note 1: The Mount Pleasant royalty contains a historical resource estimate based on the Norton Gold Fields Limited announcement dated February 3, 2015, titled “January 2015 Mineral Resource & Ore Reserve update”, which was prepared in accordance with
the JORC Code, and is available on the ASX website at https://www.asx.com.au/asx/statistics/displayAnnouncement.do?display=pdf&idsId=01596085 . Elemental believes that the resources disclosed are reliable but should not be relied on as a current
resource estimate, and no qualified person of Elemental has done sufficient work to classify the above estimate as current mineral resources. Elemental is not treating the historical estimate as current Mineral Resources or Mineral Reserves.
Other sources: Base Resources Ltd.’s ASX announcement dated August 13, 2020, “2020 Mineral Resources and Ore Reserves Statement”. The ASX announcements are prepared in accordance with the JORC Code. The ASX announcements are available on Base
Resources’ website at https://baseresources.com.au/investors/announcements/. Mineral Reserves are included in Mineral Resources. Panoramic Resources Ltd.’s ASX announcements dated September 30, 2015, titled “Mineral Resources and Ore Reserves at
June 30, 2015”, The ASX announcement is prepared in accordance with the JORC Code and is available on Panoramic’s website at https://panoramicresources.com/asx-announcements/. Mineral Reserves are included in Mineral Resources. 25Appendix 2 Board and Management
|   ELE
Board

          Frederick Bell   Frederick co-founded Elemental Royalties in 2016 following his role as Managing Director of a listed gold
           CEO, Director   exploration company, Goldcrest Resources plc, where he assembled a portfolio of gold licences in northeast
                           Ghana to take to AIM. He has wide experience in the mining industry, including as General Manager of an ASX-
                           listed uranium company from the age of 25. Frederick received the ‘Young Rising Star’ Award at Mines & Money
                           2018, read history at the University of Edinburgh and is on the Committee of Young Mining Professionals in
                           London.

         Peter Williams    Peter was the first Manager of WMC Geoscience technology before he became a founding member of
               Director    Independence Group Limited, $0.20 in 2002 to $6 in 2006 and now $3bn+. He was a founding director of
                           Ampella Mining Ltd, a vendor of Gryphon Minerals’ Banfora Gold Project and involved in the project generation
                           for Papillion’s Mali projects. Peter co-founded the International Resource Sector Intelligence company, Intierra,
                           and also co-founded the first hard rock mineral seismic company in the world, HiSeis.

          John Robins      John is a professional geologist, prospector and entrepreneur with over 35 years of experience in the mining
              Director     industry. In 2008 he was awarded the AMEBC Spud Huestis award for his contributions to mineral exploration in
                           British Columbia and Yukon. He has been involved in over a billion dollars in M&A activity and has generated
                           over $500 million in direct and indirect mineral expenditures throughout Canada, Latin America and Australia.
                           Mr Robins is the founder of the Discovery Group of companies and is currently Chairman and director of
                           Bluestone Resources Inc, Fireweed Zinc Corporation and K2 Gold Corp

        Martin Turenne     Martin is senior executive with over 15 years’ experience in the commodities industry, including 10 years in the
                Director   mining industry, Martin is currently CEO of FPX Nickel Corp. He was formerly CFO of First Point Minerals Corp.
                           from 2012 to 2015 and previously with KPMG LLP and Methanex Corporation. He is a member of the Chartered
                           Professional Accountants of Canada and serves on the board of directors of the Association for Mineral
                           Exploration of British Columbia.

                                                                                                                                                 27
| ELE
Management and Advisory Panel
Richard Evans Richard is a geologist and a co-founder of Elemental Royalties. He has over 30 years of technical and commercial
Senior Vice President resource industry experience on five continents with a metals focus. He spent 18 years with WMC covering
Technical exploration, feasibility, underground mining, business development and audit. He was a founding shareholder and
consultant to Mantra Resources, acquired by ARMZ for A$1bn.
David Baker David has over 10 years’ experience in the mining and mine finance industries. He started his career in Equity
Vice President Research at BMO Capital Markets before joining Kulczyk Investments as part of the team that founded QKR
Business Development Corporation and acquired the Navachab Gold Mine. Prior to joining Elemental, David was Vice President at
Tamesis Partners LLP, specialising in corporate advisory, research, and equity capital markets.
Greg Owen Greg has over 10 years of mining industry experience with both public and private companies, including as
Vice President Business Development Manager of Metals Exploration Plc, an AIM-listed exploration company developing the
Operations Runruno gold-molybdenum project in the Philippines; and VP Corporate Development of Altus Strategies Plc as
part of IPO in August 2017 & the acquisition of TSX-V listed Legend Gold Corp in January 2018.
Matt Anderson Matt is a chartered professional accountant who has served as CFO of public companies in the mining industry for
CFO over 10 years. He earned a Bachelor of Commerce degree from McGill University and earned his CPA while
articling at a large accounting firm. He is currently the managing director of Malaspina Consultants Inc.
Matthew Tack Jim Paterson
Advisory Panel Advisory Panel
Member
28Appendix 3 Reserves and Resources
Mineral Reserve Estimates
Proven Reserves
Tonnes Grade Contained Metal Grade Contained Metal
Project
(Mt) (g/t Au) (koz Au) (g/t Ag) (koz Ag)
Amancaya1 0.3 6.9 59 32.0 274
Mercedes2 0.2 9.0 56 81.0 503
Wahgnion3 2.9 1.37 130 - -
HM Assemblage
Material In Situ HM HM Ilmenite Rutile Zircon
(Mt) (Mt) (%) (%) (%) (%)
Kwale South Dune4 35 1.2 3.5% 58% 14% 6%
Probable Reserves
Tonnes Grade Contained Metal Grade Contained Metal
Project
(Mt) (g/t Au) (koz Au) (g/t Ag) (koz Ag)
Amancaya1 0.2 5.5 43 25.0 196
Mercedes2 3.2 3.3 339 21.7 2,222
Wahgnion3 27.4 1.61 1,420 - -
HM Assemblage
Material In Situ HM HM Ilmenite Rutile Zircon
(Mt) (Mt) (%) (%) (%) (%)
Kwale South Dune4 5 0.2 2.9% 51% 12% 5%
Total Mineral Reserves
Tonnes Grade Contained Metal Grade Contained Metal
Project
(Mt) (g/t Au) (koz Au) (g/t Ag) (koz Ag)
Amancaya1 0.5 6.3 102 29.0 470
Mercedes2 3.4 3.6 395 25.1 2,725
Wahgnion3 30.3 1.59 1,550 - -
HM Assemblage
Material In Situ HM HM Ilmenite Rutile Zircon
(Mt) (Mt) (%) (%) (%) (%)
Kwale South Dune4 40 1.4 3.4% 57% 13% 6%
Sources:
1. Austral Gold Limited’s 2019 Annual Report dated March 5, 2020. The report is prepared in accordance with NI 43-101 and is available on the Austral Gold’s website at www.australgold.com and SEDAR at www.sedar.com
2. Premier Gold Mines Limited’s Management Discussion and Analysis for the year ending December 31, 2019. The report is prepared in accordance with NI 43-101 and is available on Premier’s company profile at www.sedar.com
3. NI 43-101 Technical Report on the Wahgnion Gold Operations dated July 31, 2019 available on the Company’s website at www.terangagold.com and SEDAR at www.sedar.com
4. Base Resources Ltd.’s ASX announcement dated August 13, 2020, “2020 Mineral Resources and Ore Reserves Statement”. The ASX announcements are prepared in accordance with the Australasian Code for Reporting of Exploration Results, Mineral Resources and
Ore Reserves (“JORC Code”). The ASX announcements are available on Base Resources’ website at https://baseresources.com.au/investors/announcements/
30Mineral Resource Estimates
Measured Resources
Tonnes Grade Contained Metal Grade Contained Metal
Project (Mt) (g/t Au) (koz Au) (g/t Ag) (koz Ag)
Amancaya1 0.3 10.2 101 49.0 480
Mercedes2 0.3 3.3 27 51.2 417
Wahgnion3 3.3 1.36 140
HM Assemblage
Material In Situ HM HM Ilmenite Rutile Zircon
(Mt) (Mt) (%) (%) (%) (%)
Kwale South Dune4 55 1.8 3.2% 58% 14% 6%
Tonnage Grade Grade Grade Grade Grade Contained Contained
(Mt) (g/t Pt) (g/t Pd) (g/t Au) (% Cu) (% Ni) (koz Pt) (koz Pd)
Panton5 6.5 2.1 2.3 0.3 0.06% 0.25% 441 475
Indicated Resources
Tonnes Grade Contained Metal Grade Contained Metal
Project
(Mt) (g/t Au) (koz Au) (g/t Ag) (koz Ag)
Amancaya1 0.3 7.3 70 28.0 269
Mercedes2 3.0 3.4 329 36.9 3564
Wahgnion3 46.4 1.50 2,230
Mount Pleasant – Tuart6 3.6 1.8 212
Mount Pleasant - Racetrack6 4.3 1.9 257
HM Assemblage
Material In Situ HM HM Ilmenite Rutile Zircon
(Mt) (Mt) (%) (%) (%) (%)
Kwale South Dune4 20 0.6 2.9% 52% 12% 6%
Tonnage Grade Grade Grade Grade Grade Contained Contained
(Mt) (g/t Pt) (g/t Pd) (g/t Au) (% Cu) (% Ni) (koz Pt) (koz Pd)
Panton5 5.6 2.4 2.7 0.3 0.08% 0.28% 438 488
Sources:
1. Austral Gold Limited’s 2019 Annual Report dated March 5, 2020. The report is prepared in accordance with NI 43-101 and is available on the Austral Gold’s website at www.australgold.com and SEDAR at www.sedar.com. Mineral Reserves are included in Mineral Resources.
2. Premier Gold Mines Limited’s Management Discussion and Analysis for the year ending December 31, 2019. The report is prepared in accordance with NI 43-101 and is available on Premier’s company profile at www.sedar.com. Mineral Reserves are not included in Mineral Resources.
3. NI 43-101 Technical Report on the Wahgnion Gold Operations dated July 31, 2019 available on the Company’s website at www.terangagold.com and SEDAR at www.sedar.com. Mineral Reserves are included in Mineral Resources.
4. Base Resources Ltd.’s ASX announcement dated August 13, 2020, “2020 Mineral Resources and Ore Reserves Statement”. The ASX announcements are prepared in accordance with the Australasian Code for Reporting of Exploration Results, Mineral Resources and Ore Reserves (“JORC Code”).
The ASX announcements are available on Base Resources’ website at https://baseresources.com.au/investors/announcements/. Mineral Reserves are included in Mineral Resources.
5. Panoramic Resources Ltd.’s ASX announcements dated September 30, 2015, titled “Mineral Resources and Ore Reserves at June 30, 2015”, The ASX announcement is prepared in accordance with the JORC Code and is available on Panoramic’s website at https://panoramicresources.com/asx-
announcements/. Mineral Reserves are included in Mineral Resources.
6. The Mount Pleasant royalty contains a historical resource estimate based on the Norton Gold Fields Limited announcement dated February 3, 2015, titled “January 2015 Mineral Resource & Ore Reserve update”, which was prepared in accordance with the JORC Code, and is available on the
ASX website at https://www.asx.com.au/asx/statistics/displayAnnouncement.do?display=pdf&idsId=01596085 . Elemental believes that the resources disclosed are reliable but should not be relied on as a current resource estimate, and no qualified person of Elemental has done sufficient work
to classify the above estimate as current mineral resources. Elemental is not treating the historical estimate as current mineral resources or mineral reserves
31Mineral Resource Estimates (continued)
Total Measured and Indicated Resources
Tonnes Grade Contained Metal Grade Contained Metal
Project
(Mt) (g/t Au) (koz Au) (g/t Ag) (koz Ag)
Amancaya1 0.6 8.8 171 38.0 748
Mercedes2 3.3 3.4 356 38.1 3981
Wahgnion3 49.6 1.49 2370
Mount Pleasant - Tuart 3.6 1.8 211
Mount Pleasant - Racetrack 4.3 1.9 258
HM Assemblage
Material In Situ HM HM Ilmenite Rutile Zircon
(Mt) (Mt) (%) (%) (%) (%)
Kwale South Dune4 75.0 2.4 3.1% 56% 13% 6%
Tonnage Grade Grade Grade Grade Grade Contained Contained
(Mt) (g/t Pt) (g/t Pd) (g/t Au) (% Cu) (% Ni) (koz Pt) (koz Pd)
Panton5 12.2 2.3 2.5 0.3 0.07% 0.26% 879 963
Inferred Resources
Tonnes Grade Contained Metal Grade Contained Metal
Project
(Mt) (g/t Au) (koz Au) (g/t Ag) (koz Ag)
Amancaya1 0.7 5.9 140 18.0 426
Mercedes2 1.7 4.2 231 36.1 1997
Wahgnion3 5.2 1.41 240
Mount Pleasant - Tuart6 1.9 3.8 232
Mount Pleasant - Racetrack6 6.3 2.4 480
HM Assemblage
Material In Situ HM HM Ilmenite Rutile Zircon
(Mt) (Mt) (%) (%) (%) (%)
Kwale South Dune4 - - - - - -
Tonnage Grade Grade Grade Grade Grade Contained Contained
(Mt) (g/t Pt) (g/t Pd) (g/t Au) (% Cu) (% Ni) (koz Pt) (koz Pd)
Panton5 2.2 1.9 2.0 0.3 0.11% 0.31% 129 139
Sources:
1. Austral Gold Limited’s 2019 Annual Report dated March 5, 2020. The report is prepared in accordance with NI 43-101 and is available on the Austral Gold’s website at www.australgold.com and SEDAR at www.sedar.com. Mineral Reserves are included in Mineral Resources.
2. Premier Gold Mines Limited’s Management Discussion and Analysis for the year ending December 31, 2019. The report is prepared in accordance with NI 43-101 and is available on Premier’s company profile at www.sedar.com. Mineral Reserves are not included in Mineral Resources.
3. NI 43-101 Technical Report on the Wahgnion Gold Operations dated July 31, 2019 available on the Company’s website at www.terangagold.com and SEDAR at www.sedar.com. Mineral Reserves are included in Mineral Resources.
4. Base Resources Ltd.’s ASX announcement dated August 13, 2020, “2020 Mineral Resources and Ore Reserves Statement”. The ASX announcements are prepared in accordance with the Australasian Code for Reporting of Exploration Results, Mineral Resources and Ore Reserves (“JORC Code”).
The ASX announcements are available on Base Resources’ website at https://baseresources.com.au/investors/announcements/. Mineral Reserves are included in Mineral Resources.
5. Panoramic Resources Ltd.’s ASX announcements dated September 30, 2015, titled “Mineral Resources and Ore Reserves at June 30, 2015”, The ASX announcement is prepared in accordance with the JORC Code and is available on Panoramic’s website at https://panoramicresources.com/asx-
announcements/. Mineral Reserves are included in Mineral Resources.
6. The Mount Pleasant royalty contains a historical resource estimate based on the Norton Gold Fields Limited announcement dated February 3, 2015, titled “January 2015 Mineral Resource & Ore Reserve update”, which was prepared in accordance with the JORC Code, and is available on the
ASX website at https://www.asx.com.au/asx/statistics/displayAnnouncement.do?display=pdf&idsId=01596085 . Elemental believes that the resources disclosed are reliable but should not be relied on as a current resource estimate, and no qualified person of Elemental has done sufficient work
to classify the above estimate as current mineral resources. Elemental is not treating the historical estimate as current mineral resources or mineral reserves
32You can also read