BMO Conference February 2011

Page created by Lois Aguilar
 
CONTINUE READING
BMO Conference February 2011
BMO Conference ‐ February 2011

                                 1
BMO Conference February 2011
Cautionary Statement
Forward-Looking Statements
Certain information contained in this presentation, including any information as to future financial or operating performance and other statements that express management's
expectations or estimates of future performance, constitute "forward-looking statements". All statements, other than statements of historical fact, are forward-looking statements. The
words “anticipate”, “plans”, “estimate", "expect", "expects", "expected" and similar expressions identify forward-looking statements. Forward-looking statements are necessarily
based upon a number of estimates and assumptions that, while considered reasonable by management, are inherently subject to significant business, economic and competitive
uncertainties
  ncertainties and contingencies.
                      contingencies The Company
                                           Compan cautions
                                                     ca tions the reader that such
                                                                               s ch forward-looking
                                                                                    for ard looking statements involve
                                                                                                               in ol e known
                                                                                                                       kno n and unknown
                                                                                                                                   nkno n risks,
                                                                                                                                            risks uncertainties
                                                                                                                                                   ncertainties and other factors that may
                                                                                                                                                                                        ma
cause actual financial results, performance or achievements of Franco-Nevada to be materially different from the Company's estimated future results, performance or achievements
expressed or implied by those forward-looking statements and the forward-looking statements are not guarantees of future performance. These risks, uncertainties and other factors
include, but are not limited to: fluctuations in the prices of the primary commodities that drive the Company’s Net Revenue (gold, platinum group metals, copper, nickel, oil and gas);
fluctuations in the value of the Canadian and Australian dollar, Mexican peso, and any other currency in which the Company generates revenue, relative to the US dollar; changes in
national and local government legislation, including taxation policies; regulations and political or economic developments in any of the countries where the Company holds interests
in mineral and oil and gas properties; influence of macroeconomic developments; business opportunities that become available to, or are pursued by us; reduced access to debt and
equity
    it capital;
            it l litigation;
                 liti ti     titl disputes
                             title di  t related
                                            l t d to
                                                  t our interests
                                                        i t    t or any off the
                                                                            th properties;
                                                                                       ti  operating
                                                                                                 ti or technical
                                                                                                        t h i l difficulties
                                                                                                                 diffi lti on any off the
                                                                                                                                      th properties;
                                                                                                                                                ti   risks
                                                                                                                                                      i k and
                                                                                                                                                            d hazards
                                                                                                                                                              h     d associated
                                                                                                                                                                             i t d with
                                                                                                                                                                                     ith the
                                                                                                                                                                                         th
business of development and mining on any of the properties, including, but not limited to unusual or unexpected geological formations, cave-ins, flooding and other natural disasters
or civil unrest; completion of acquisition of Gold Wheaton Gold Corp, including approval of the listing of the Franco-Nevada shares by the Toronto Stock Exchange; and necessary
security holder and court approvals; integration of the assets following completion of the acquisition. The forward-looking statements contained in this presentation are based upon
assumptions management believes to be reasonable, including, without limitation, the ongoing operation of the properties by the owners or operators of such properties in a manner
consistent with past practice, the accuracy of public statements and disclosures made by the owners or operators of such underlying properties, no material adverse change in the
market price of the commodities, and any other factors that cause actions, events or results to differ from those anticipated, estimated or intended. Accordingly, readers should not
place undue reliance on forward-looking statements because of the inherent uncertainty. For additional information with respect to risks, uncertainties and assumptions, please also
refer to the “Risk Factors” section of our most recent Annual Information Form filed with the Canadian securities regulatory authorities on www.sedar.com, as well as our annual and
interim MD&As. The forward-looking statements herein are made as of the date of this presentation only and Franco-Nevada does not assume any obligation to update or revise
them to reflect new information, estimates or opinions, future events or results or otherwise, except as required by applicable law.
Non-GAAP Measures
Net Revenue, Free Cash-Flow, EBITDA, Margin and Adjusted Net Income are intended to provide additional information only and do not have any standardized meaning prescribed
by GAAP and should not be considered in isolation or as a substitute for measures of performance prepared in accordance with GAAP.GAAP Definitions and reconciliations to GAAP can
be found in our financial disclosures. These measures are not necessarily indicative of operating profit or cash flow from operations as determined under GAAP. Other companies
may calculate these measures differently. The following notes are standardized for the attached presentation.

1   Net Revenue is defined by Franco-Nevada as cash received or receivable from operating royalty and stream assets, net of any cash outlays required to purchase stream production.
2   Free Cash Flow is defined by the Company as operating income plus depletion and depreciation, non-cash charges, and any impairment of investments and royalty interests.
3   Margin is defined as Free Cash Flow as a percentage of Net Revenue.
4   Adjusted Net Income is defined by the Company as net income excluding impairment charges related to royalties, working interests and investments; fair value changes for royalties
    accounted for as derivative assets; foreign currency gains/losses; gains/losses on sale of investments; and the impact of taxes on all these items. See Reconciliation of Non-GAAP
    Measures in the Appendix for calculation.
5   Includes fair value gains on derivative assets.
                                                                                                                                                                                         2
BMO Conference February 2011
Dow vs Gold:
                                                                   45

           32                                                      40

                                                                   35

           16
                                                                   30

                Logarithmic Scale
DOW/Gold

                                                                   25
            8

                                                                   20

            4
                                                                   15

                                                                   10
            2

                                            Arithmetic Scale       5

            1                                                      0

                                    Financial vs hard assets
                                                               3
BMO Conference February 2011
Franco-Nevada

A gold focused royalty & streaming company generating growing cash
    flow and dividends from a diversified portfolio of quality assets

                                  Gold ETF   Franco-Nevada   Operators
 Yield                               0%            1%
                                                  ~1%           0 1%
                                                                0-1%
 Leverage to Gold Price              1            >1            >1

 Exploration & Expansion Upside      0%           100%         100%
 Exposure to Opex, Capex &
                                     0%           0%           100%
 Environmental Costs (NSR)

          Franco-Nevada provides yield and more upside
          than a gold ETF with less risk than an operator

                                                                         4
BMO Conference February 2011
Franco-Nevada

     Dec. 2007 IPO of new Franco-Nevada for $1.26B (C$15.20/sh.)
     Since IPO,, Franco-Nevada has delivered:
        >100% share price increase
        >$435m of Free Cash Flow(2)*                                 250%

        >$86m in dividends p
                           paid                                                                                 FNV
        >300 royalty interests                                       200%

        $3.6B in market cap**
                                                                     150%

     GLW announced Dec
                   Dec. 2010:
        • Acquisition of 37% GLW                                     100%

        • Purchase of $100m GLW notes                                                               S&P / TSX

        • Bid for balance of GLW                                      50%

        • Expect March 14th close
        • Expect ~$200m cash post close                                0%

* Actual Free Cash Flow up to September 30, 2010 and Q4 2010 estimated at 90% of public guidance.                     5
** As at February 23, 2011
BMO Conference February 2011
Growing Pipeline of Mineral Royalties

       135 oil & gas royalties and 156 undeveloped oil & gas interests not shown

           Over 300 mineral and oil & gas royalties
                                                                                   6
BMO Conference February 2011
Quality Operators:

       Core Operators:                                     Up and Comers:
                           Goldstrike                                          Palmarejo
                                                                                      j
                           B ld Mountain
                           Bald M     t i
                           Hemlo
                                                                               Mesquite
                                                                               Cerro San Pedro
                           Gold Quarry
                           S bik
                           Subika                                              Holloway
                                                                               Hollo  a
                                                                               Hislop
                                                                               Holt
                           Marigold
                           Musselwhite
                           Stillwater                                          D t
                                                                               Detour L
                                                                                      Lake
                                                                                        k
                           East Boulder
                                                                               Duketon
                           Tasiast                                             Garden Well

    Goldstrike ‐ Barrick             Marigold ‐ Goldcorp   Tasiast ‐ Kinross          Detour – Detour Gold

                                                                                                        7
BMO Conference February 2011
Secure & Diverse Revenue*

                       By Country                                                    By Asset
                                  Australia
                  Other             3%                                      Midale
                   2%                                                        2%
                                                                                      O&G
                                                                                      Other
                                                                             Edson     5%
                                                                              8%
                                                                                                  Palmarejo
             Mexico                                                  Weyburn                         23%
                                                      Base Metals
              25%                                US                    6%
                                                        & Other
                                                45%       2%

                                                                    Stillwater                         Goldstrike -
                                                                        7%                                NPI
                                                                                                          17%
                        Canada
                        C    d                                               G
                                                                             Gold
                          25%                                                Other
                                                                             13%
                                                                                              Goldstrike
                                                                                                - NSR
                                                                                                  9%

                                                                    Gold Quarry
                                                                        3%            Marigold
                                                                                        5%

                                        95% off revenue ffrom N
                                                              North
                                                                 th A
                                                                    America
                                                                        i
                                               80% precious metals**
* Net Revenue(1) - 9 Months to September 30, 2010                                                                     8
** November guidance for 2010.
BMO Conference February 2011
Net Revenue(1) by Commodity
               80

               70

               60

               50
($ millions)

               40

                              Oil + Gas
               30
                              & Other
               20             PGM

               10             Gold

               0
                    Q1        Q2           Q3           Q4           Q1           Q2           Q3           Q4           Q1   Q2          Q3   Q4*
                                    2008                                               2009                                        2010

                               Diversified Portfolio with Growing Precious Metals
                                                                                                                                                     9
          *    Represents top end of November guidance reflecting Q4 commodity prices and guidance on Gold Quarry minimum.
BMO Conference February 2011
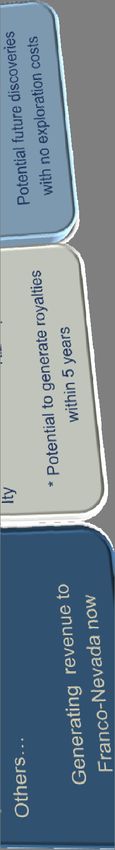
Key Long Life Assets*

                                                                                                    - Major Net Revenue                                      ~10 years
 Goldstrike                                                                                         - Stock pile revenue potential                           ~20 years

Gold Quarry                                                                                         - New layback potential                                  ~ 20 years

 Palmarejo                                                                                          - Guadalupe development                                  > 10 years

  Stillwater                                                                                                       - Existing reserves                       > 25 years

                                                                                                                                       - Existing reserves     11 years
  Oil & Gas                                                                                                                            - Weyburn potential   > 40 years

  Falcondo                                                                                          - Existing resources                                     > 20 years

        Tasiast                                                                                      - Expanding reserves                                    > 20 years

        Detour                                                                                              - Expanding reserves                             > 15 years

                 2010                 2015                2020                2025           2030               2035                 2040+

                                                   Most key asset lives > 20 years
   *     Management expectation based on current public information provided by operators.                                                                     10
   **    See Appendix for references & assumptions.
A Long Life Portfolio with Growing Value

                                           11
Near Term Growth

Tasiast Mine 2% NSR - Mauritania

      Kinross acquisition of Red Back valued at
      $7.1 B
      Scoping
          p g studyy indicates expansion
                                 p       up
                                          p to
      1.5 Moz in future years*
      Study based on 16 year mine life
      Potential incremental annual revenue of
      $36m*
      Royalty becomes payable this year

                           Undiscounted
                           U di     t d in-situ
                                        i it royalty
                                                 lt value
                                                      l ~$0.5
                                                          $0 5 billion**
                                                               billi **
*    Based on Kinross Q4/10 press release dated February 16, 2011. Incremental revenue based on 1.5moz at $1,200/oz.
**   Based on Kinross Q4/10 press release dated February 16, 2011 total resources of 18.3 million ounces at $1,200/oz.   12
     In-situ value has no recovery rate applied.
Near Term Growth

Detour Lake 2% NSR- Canada

     Detour Gold has started construction with
     $1.0 billion of funding in place
     Total M+I p
               project
                  j    resources >20 Moz*
     (plus additional 2 Moz on adjacent Trade Winds Block A JV)

     Production of 660,000 oz/yr with potential for
     1m oz/yr**
     Potential incremental annual revenue of $17m
     to $24m***
     Royalty expected to start 2013

                     Undiscounted in
                                  in-situ
                                     situ royalty value >$0.5
                                                         $0.5 billion
                                                              billion***

* Based on press release dated January 31, 2011 from Detour Gold and February 3, 2011 from Trade Winds Block A.
** Based on February 2, 2011 BMO analyst projections.                                                             13
*** Based on $1,200/oz. No recovery rate applied.
The Next 20 Projects

       Category                                             Royalty*                                                   Operator
       New mines:                                           •   Duketon (2%)                                           •   Regis Resources
                                                            •   Lounge
                                                                    g Lizard ((2%)
                                                                                 %)                                    •   Kagara
                                                                                                                             g    Ltd
                                                            •   Peculiar Knob (production payment)                     •   WPG Resources
                                                            •   Red October (1.75%)                                    •   Saracen
       Project restarts:                                    • Falcondo (4.1% equity)                                   • Xstrata
                                                            • Holt (up to 10%)                                         • St Andrew Goldfields
       Royalties reaching hurdles:                          • Subika (2%)                                              • Newmont Mining
                                                            • Ity (1 – 1.5%)                                           • La Mancha
       NPI’s pending payout:                                • Hemlo (50%)                                              • Barrick Gold
                                                            • Musselwhite (5%)                                         • Goldcorp
       Permitting projects:                                 • Rosemont (1.5%)
                                                                        (1 5%)                                         • Augusta Resources
                                                            • Perama Hill (2%)                                         • Eldorado Gold
       Pre-feasibility stage:                               •   Sandman (0.5 – 5%)                                     •   Newmont/Fronteer Gold
                                                            •   Garden Well (2%)                                       •   Regis Resources
                                                            •   Goldfields (2%)                                        •   Brigus Gold
                                                            •   C
                                                                Courageous    L
                                                                              Lake
                                                                                 k (1%)                                •   S b id G
                                                                                                                           Seabridge Gold
                                                                                                                                        ld
                                                            •   Gurupi (1%)                                            •   Jaguar Mining
                                                            •   HBJ Superpit (1.75%)                                   •   Alacer Gold
                                                            •   Agi Dagi (2%)                                          •   Alamos Gold
                                                            •   Kiziltepe (1.5 – 2.5%)                                 •   Ariana Resources

                                       Potential royalty value > $1.0 billion**
*    Note: Certain royalties do not cover the entire property or are rounded. See Annual Information Form for further details.
**   Undiscounted value reflecting total in-situ resources disclosed by operators on or before January 18, 2011. Values are calculated             14
     at $1,200/oz Au, $4/lb Cu, $28/oz Ag and $15/lb Mo. No recovery rates are applied.
Gold Wheaton Combination

 December 11, 2010 – FNV agrees to purchase 34% of GLW from Quadra FNX
 December 13, 2010 – FNV & GLW agreed to friendly business combination
 December 31, 2010 – Purchased GLW secured notes from Sprott for C$110m
 January 5, 2011 – Closed acquisition of Quadra FNX block for C$262m
 J
 January 5,
         5 2011 – Entered
                  E t d into
                          i t ad
                               definitive
                                 fi iti agreementt tto acquire
                                                           i GLW ffor C$830
                                                                      C$830m
 Transaction expected to close in March, 2011
 FNV deploys
       p y $475m cash and increases shares outstanding
                                                     g by
                                                        y 8.4%
 Accretive on all measures
 FNV post transaction with no debt and ~$200m in cash

                                                                           15
Potential Net Revenue Growth

                   450
                                  Precious Metal
                   400
                                  Non‐Precious
                                  N P i        Metal
                                               M t l
                   350

                                                                                                                                       > $200m potential
                   300
                                                                                                                                       incremental
                                                                                                                                       revenue**
    ($ Millions)

                   250

                   200

                   150

                   100

                    50

                    0
                         2008A       2009A           2010E             GLW            Tasiast         Detour           Other   2015+

                                      23% CAGR in precious metal revenue**
*  Asset estimates reflect potential revenue for upcoming advanced assets and assumes top ranges for operator or analyst
   projections and $1,200/oz gold. Gold Wheaton estimate represents broker consensus estimate for 2011.
                                                                                                                                                 16
** Estimate of Compounded Annual Growth Rate from 2008 to 2015.
Franco-Nevada

                                               strike
 23% Annual Gold Growth (IPO to 2015)

                                           Golds
 Major New Discoveries (Tasiast, Detour)

                                                  arry
 G ld Wh
 Gold Wheaton
          t Catalyst
              C t l t ffor Re-rating
                           R    ti

                                           Gold Qua
 >90% Free Cash Flow Margins

                                           Palmarejo
 >$375m in Capital for Further Deals

 Record of Annual Dividend Increases

                                           GLW
 Gold Leverage at Lower Risk

 The strongest business model in gold
                                                         17
Appendices

  Goldstrike ‐ Barrick    Weyburn
                         Bald     ‐ Cenovus
                              Mountain ‐ Barrick      East Boulder ‐ Stillwater

  Palmarejo ‐ Coeur
                         Cerro San Pedro ‐ New Gold   Mesquite – New Gold

  Marigold ‐ Goldcorp
                         Robinson – Quadra FNX        Tasiast ‐ Kinross
  Marigold ‐ Goldcorp

                                                                                  18
Gold Wheaton Combination
A New Catalyst for Growth

       Enhances FNV position as the leading gold-focused royalty company
               Accelerated cash flow growth – continued industry leading free cash flow margin
               Increases near-term annual Net Revenue (1) by approximately $100 million*
               Pro forma contribution of precious metals to Net Revenue (1) greater than 85%
               Increases leverage to gold prices via stream structure

       Additi off significant
       Addition    i ifi    t assets
                                  t – Sudbury
                                      S db    F
                                              Footwall
                                                 t ll and
                                                        d MWS
               Acquiring 2 of top 5 assets pro forma*
               Long life production profiles with near-term growth prospects

       Diversified portfolio
               No asset greater than 15% of pro forma NAV*
               Adds further platinum and palladium exposure

       Capital available for growth
               Pro forma cash balance of US$200 million plus undrawn credit facility of US$175 million available for
               further acquisitions**

       A
       Accretive
            ti tot Franco-Nevada
                   F      N   d on allll per share
                                              h    metrics
                                                     ti

* Based on broker estimates
** Includes broker estimated cash flow for Q4/2010 and Q1/2011 cash flow to a mid-March, 2011 closing; includes purchase of GLW   19
   senior secured notes from Sprott and excludes proceeds from ITM options and warrants
Gold Wheaton Combination
Increased Diversification

         Pro‐forma NPV Breakdown                                    Pro‐forma NPV Breakdown
                                 Ezulwini
                        Detour     5%
                         5%
       Gold Quarry
           5%                               Other FNV
                                                                           Oil & Gas/
                                             Assets
                                                                             Other
 Stillwater                                   18%                             14%
     8%

                                                        Sudbury
                                                                     PGM
              Tasiast                                     12%        19%
               8%
                                                                                        Gold
                                                                                        67%
                   MWS                          Palmarejo
                    8%                             12%
                                        Gold
                           Oil & Gas   Strike
                              9%        10%

       Contributes two of the top five assets                     Increases precious metal contribution
                                                                  to 86%
       No asset greater than 15% by value
                                                                  PGM division to become larger than oil
       Increases precious metal value                             & gas
Source: Broker consensus estimates                                                                        20
Gold Wheaton Transaction
Summary

  Consideration:
      C$5.20 per Gold Wheaton common share
      23% premium based on the 20-day volume-weighted average price
      Transaction value of C$830 million

  Structure:
      Plan of Arrangement supported by both Boards of Directors and management
      Consideration payable approx. 60% in stock and 40% in cash with proration flexibility
      Shareholders can elect to receive either 0.1556 of a FNV share or C$5.20 in cash subjects to caps and
      p
      proration
      Capped at approximately 9.66 million FNV shares and C$215 million in cash
      Purchase of 34.5% of Gold Wheaton shares from Quadra FNX for C$4.65 per share for 100% cash
      (subject to top-up provision)
      C t
      Customary d
                deall protections
                         t ti     ffor Franco-Nevada
                                       F      N   d ((right
                                                       i ht tto match,
                                                                  t h C$25 million
                                                                            illi b break
                                                                                       k ffee))

  Conditions:
      662/3% shareholder approval by Gold Wheaton shareholders
      No shareholder vote is required by Franco-Nevada shareholders

  Closing of the proposed transaction is expected in March 2011
                                                                                                         21
Gold Wheaton Assets
Sudbury Footwall
                                                                                   Attributable Production (k Au Eq. oz)
       Operator: Quadra FNX                                                                                    (First 5 years)
                                                                                                                                 67    67
       Location: Sudbury, Canada                                                            60
                                                                                                                    64
                                                                                                        58
       Stream: 50% of Au, Pt, Pd contained in mined ore
       above $400/oz Au Eq
       Purchased byy GLW: C$400 million in June, 2008
       Net Revenue (9 Months to Sep 2010): $31 million                                    2011        2012         2013      2014     2015
                                                                                    Source: Broker Estimates
       Description:
               World class mining district

               3 separate operations exploiting 5 deposits

               High grade Cu-PGM assets

               Significant resource upside at Morrison

               Production Guidance for 2011: 60-80 koz TPM*

                                                                                   Source: Quadra FNX Website
                                                                                                                                             22
*   Quadra FNX 2011 guidance for payable TPM from January 24, 2011 Press Release
Gold Wheaton Assets
MWS
                                                                      Attributable Production (k Au oz)
       Operator: First Uranium
                                                                      33 34 32                    32 33                              33 33 32
       Location: South Africa                                                              29                   29 30 30                                  28 29

       Stream: 25% of Au produced above $400/oz               18

       Purchased by GLW: US$125 million in Nov, 2008
       N t Revenue
       Net R       (9 M
                      Months
                         th tto S
                                Sep 2010)
                                    2010): $12 million
                                                illi

                                                               2011
                                                                      2012
                                                                             2013
                                                                                    2014
                                                                                           2015
                                                                                                  2016
                                                                                                         2017
                                                                                                                2018
                                                                                                                       2019
                                                                                                                              2020
                                                                                                                                     2021
                                                                                                                                            2022
                                                                                                                                                   2023
                                                                                                                                                           2024
                                                                                                                                                                  2025
       Mine Life: 15 years *                                    Source: First Uranium Feb, 2011 Investor Presentation (March 31 Year End)

       Description:
                Uranium & gold tailings recovery operation

                3rd gold plant to be commissioned in 2011

                Low cost and low technical risk

                Annual production of ~120 koz/yr**

                                                             Source: First Uranium Website
                                                                                                                                                          23
* First Uranium Technical Report dated January 1, 2010
** FIU forecast when all three gold plants are operational
Gold Wheaton Assets
Ezulwini
                                                                Attributable Production (k Au oz)
    Operator: First Uranium                                                                         24 24 24 24 24 24 24
                                                                                            21 23                           23
    Location: South Africa                                 17                       18 19                                        18
                                                                15             16
                                                                          14
                                                                     12
    Stream: 7% of Au produced above $400/oz Au Eq                                                                                       7

    Purchased by GLW: US$50 million in Nov, 2009

                                                           2011
                                                           2012
                                                           2013
                                                           2014
                                                              4
                                                           2015
                                                           2016
                                                           2017
                                                           2018
                                                           2019
                                                           2020
                                                           2021
                                                           2022
                                                           2023
                                                           2024
                                                              4
                                                           2025
                                                           2026
                                                           2027
                                                           2028
                                                           2029
    Net Revenue (9 Months to Sep 2010): $10
                                        $ million
                                                            Source: First Uranium Feb, 2011 Investor Presentation (March 31 Year End)
    Mine life: 20 years*
    Description:
          p
             Rehabilitation of past producing mine

             Gold and uranium plants complete

             Shaft rehabilitation complete & ramping up

             Ramping up production over next 8 years

             Capacity to produce >300,000 oz/yr.

             Total Resource: 25.5 Moz (Dec, 2009)

             Minimum Payment: 19.5 koz in 2011            Source: First Uranium 2010 Annual Report

                                                                                                                             24
*   First Uranium Technical Report dated March 22, 2010
Strong Financial Position

                                                         Pre-GLW Transaction                                    Post-GLW Transaction
                                                            (September 30,
                                                                       30 2010)                                         (est at closing)
                                                                                                                        (est.

                   Cash                                US$610 million                                         US$200 million (1)

                   Debt                                None                                                   None (2)

                   Revolver Available                  US$175
                                                         $    million                                         US$175
                                                                                                                $    million

                   Total Available
                                                       US$785 million                                         US$375 million
                   Capital

                       Franco-Nevada has capital for further acquisitions

1. Includes broker estimated cash flow for Q4/2010 and Q1/2011 cash flow to a mid‐March, 2011 closing; includes purchase of
   GLW senior secured notes from Sprott and excludes proceeds from ITM options and warrants                                                25
2. Assumes remaining GLW debt called by the debt holder at 110% of face value
Asset Life Assumptions & References

Goldstrike ‐ Barrick 2009 Annual Report. December 2009 reserve of 12.2 moz and 2009 production of 1.36 moz implies
mine life of 9 years. Barrick 2009 Annual report states Barrick expects to fully process ore in stockpiles by 2035.
(www.barrick.com)

Gold Quarry – Newmont Investor Day Presentation from May 27, 2010. Gold Quarry West Wall Layback has potential to add
10 years of additional mine life beginning in 2019. (www.newmont.com)

Palmarejo ‐ Coeur d’Alene Mines, Palmarejo Technical Report, February 2011. States mine life of 8 years from 2011.
Assumption of 3 yrs of additional mine life based on 4.0 M tonne M&I resource mined at 1.4 M tonnes per year.
(
(www.coeur.com) )

Stillwater – Stillwater press release dating February 25, 2010. Reserve of 20.6 moz at December 31, 2009 and 2009
production rate of 530 koz. Implies mine life >25 yrs. (www.stillwatermining.com)

Oil & Gas – Oil & Gas Reserve Report by GLJ Petroleum Consultants Ltd.. (www.franco‐nevada.com).
Falcondo – Xstrata Nickel October 2009 reports a reserve of 74.2 Mt grading 1.29% Ni. Press release from Xstrata Nickel
dated October 12, 2010 indicates capacity at 50% of approximately 14,000 tonnes of Ni per annum or implied full capacity
of 28,000 tonnes of Ni per annum. Implies >20 yr mine life.

Tasiast – September
            p       22,, 2010 Denver Gold Forum Presentation byy Kinross. Estimate 425m tonnes of ore and p
                                                                                                          processingg of
60ktpd. Implies mine life of +19 years. (www.kinross.com)
Detour ‐ May 25, 2010 Feasibility Study for Detour Lake describes16 year mine plan. (www.detourgold.com).

Franco‐Nevada does not operate or explore but relies on others. Because it is not an operator, it must rely on decisions
made by others,
          others decisions on which it has little or no influence.
                                                        influence It must also assume that public disclosure by its operators
is accurate and true. Information contained herein is based on information made available by these operators.

                                                                                                                         26
Franco-Nevada Directors & Management

                                                                     Directors
              Pierre Lassonde                                             Director, Chairman
              David Harquail                                              Director, President & CEO
              Derek Evans(1)                                              Director
              Graham Farquharson(2)                                       Director
              Louis Gignac
                      g    (1)                                            Director
              Randall Oliphant(1)                                         Director
              Hon. David R. Peterson(2)                                   Director

                                                                    Management
              David Harquail                                              President & CEO
              Sandip Rana                                                 Chief Financial Officer
              Jacqueline Jones                                            Chief Legal Officer & Corporate Secretary
              Geoff Waterman                                              Chief Operating Officer
              Paul Brink                                                  SVP, Business Development
              Steve Alfers                                                Chief of U.S.
                                                                                   U S Operations

(1) Member of the Audit and Risk Committee
                                                                                                                      27
(2) Member of the Compensation and Corporate Governance Committee
Franco-Nevada Corporation

Capital Structure(2)                                        Analyst Coverage
      Shares Outstanding                        114.56m       BMO Capital Markets    David Haughton

      Warrants @ C$32/sh March 2012               5 75m
                                                  5.75m       BOA/Merrill Lynch
                                                                           y           Mike Jalonen
                                                              CIBC Capital Markets     Cosmos Chiu
      Warrants @ C$75/sh June 2017                5.75m
                                                              Credit Suisse               Anita Soni
      Options & other                             2.84m
                                                              GMP Securities             Craig West
                                                128.90m       Paradigm Capital         Don MacLean
                                                              RBC Capital Markets    Stephen Walker
                                                              Scotia Capital           David Christie
      Share Price Range(1)              C$35.79-C$25.37
                                                              TD Securities             Greg Barnes
      Market Capitalization(2)                     $3.6B
                                                              UBS Securities         Brian MacArthur
      Working Capital + Marketable
                                                $670.4m       Wellington West         Paolo Lostritto
      Investments(3)

      Available Credit Facilities                 $175m     Major Shareholders
      Debt or Hedges                                  Nil     Fidelity                           US
      2011 Dividends (Indicative) (4)              $35m       Invesco Trimark               Canada
                                                              T. Rowe Price                      US
      Management Ownership (3)                      5.0%
                                           (6.6% diluted)     Blackrock                      Europe
                                                              Oppenheimer                        US

(1)   Previous 52 weeks
(2)   As at February 23, 2011                                                                    28
(3)   As at September 30, 2010
(4)   @ $CAN/$US = 1.00
You can also read