Wells Fargo Energy Conference

Page created by Cecil Bennett
 
CONTINUE READING
Wells Fargo Energy Conference
“Charting a new course”

Wells Fargo Energy Conference

 June 2, 2021
Wells Fargo Energy Conference
Mac McFarland
President & CEO

Francisco Leon
EVP & CFO
Wells Fargo Energy Conference
Forward Looking / Cautionary Statements – Certain Terms
The information included herein contains forward-looking statements that involve risks and uncertainties that could materially affect our expected results of operations, liquidity, cash flows and business prospects. Such
statements include those regarding our expectations as to our future:
•    financial position, liquidity, cash flows and results of operations                                            •     budgets and maintenance capital requirements
•    business prospects                                                                                             •     reserves
•    transactions and projects                                                                                      •     type curves
•    operating costs                                                                                                •     expected synergies from acquisitions and joint ventures
•    operations and operational results including production, hedging and capital investment
Actual results may differ from anticipated results, sometimes materially, and reported results should not be considered an indication of future performance. While we believe assumptions or bases underlying our expectations
are reasonable and make them in good faith, they almost always vary from actual results, sometimes materially. We also believe third-party statements we cite are accurate but have not independently verified them and do not
warrant their accuracy or completeness. Factors (but not necessarily all the factors) that could cause results to differ include:
•    our ability to execute our business plan post-emergence                                                              •    joint ventures and acquisitions and our ability to achieve expected synergies
•    the volatility of commodity prices and the potential for sustained low oil, natural gas and natural gas              •    the recoverability of resources and unexpected geologic conditions
     liquids prices                                                                                                       •    incorrect estimates of reserves and related future cash flows and the inability to replace reserves
•    impact of our recent emergence from bankruptcy on our business and relationships                                     •    changes in business strategy
•    debt limitations on our financial flexibility                                                                        •    production-sharing contracts' effects on production and unit operating costs
•    insufficient cash flow to fund planned investments, interest payments on our debt, debt repurchases or               •    the effect of our stock price on costs associated with incentive compensation
     changes to our capital plan                                                                                          •    effects of hedging transactions
•    insufficient capital or liquidity, including as a result of lender restrictions, unavailability of capital markets   •    equipment, service or labor price inflation or unavailability
     or inability to attract potential investors                                                                          •    availability or timing of, or conditions imposed on, permits and approvals
•    limitations on transportation or storage capacity and the need to shut-in wells                                      •    lower-than-expected production, reserves or resources from development projects, joint ventures or
•    inability to enter into desirable transactions including acquisitions, asset sales and joint ventures                     acquisitions, or higher-than-expected decline rates
•    our ability to utilize our net operating loss carryforwards to reduce our income tax obligations                     •    disruptions due to accidents, mechanical failures, power outages, transportation or storage constraints,
•    legislative or regulatory changes, including those related to drilling, completion, well stimulation,                     natural disasters, labor difficulties, cyber attacks or other catastrophic events
     operation, maintenance or abandonment of wells or facilities, managing energy, water, land, greenhouse               •    pandemics, epidemics, outbreaks, or other public health events, such as the COVID-19
     gases (GHGs) or other emissions, protection of health, safety and the environment, or transportation,                •    factors discussed in Item 1A, Risk Factors in CRC's Annual Report on Form 10-K available at www.crc.com.
     marketing and sale of our products

Words such as "anticipate," "believe," "continue," "could," "estimate," "expect," "goal," "intend," "likely," "may," "might," "plan," "potential," "project," "seek," "should," "target, "will" or "would" and similar words that reflect the
prospective nature of events or outcomes typically identify forward-looking statements. Any forward-looking statement speaks only as of the date on which such statement is made, and we undertake no obligation to correct or
update any forward-looking statement, whether as a result of new information, future events or otherwise, except as required by applicable law.

See the Investor Relations page at www.crc.com for additional information about 3P reserves and other hydrocarbon resource quantities, PV-10 and standardized measure, finding and development (F&D) costs, recycle ratio
calculations, reserve replacement ratios, debt-adjusted shares calculations, drilling locations and reconciliations of non-GAAP measures to the closest GAAP equivalent.

                                                                                                                                                                                                                                                3
Wells Fargo Energy Conference
Key Quarterly Highlights – Underlining Solid Business Fundamentals

                        ADJ. EBITDAX1                                                                      FREE CASH FLOW1                                                                                NET DEBT1

                           $189MM                                                                                $120MM                                                                                 $470MM

 1st Quarter
    2021
                          PRODUCTION                                                                           OPERATIONS                                                                                        HSE

                                                                                     17 Drilled | 15 Online | 40 Workover
                         99 Mboe/d                                                                                      Wells                                                                 0.00 LTIR2 | 0.27 IIR3
                                61% Oil                                                        1 Drilling | 30 Maintenance                                                                        No Major Incidents
                                                                                                                         Rigs

                      (1) FCF, Adj. EBITDAX and Net Debt are non-GAAP measures and are at March 31, 2021. For all historical non-GAAP financial measures, please see the Investor Relations page at www.crc.com for a reconciliation to the closest GAAP measure and
       June 2, 2021   other additional information. See slide 19 for a reconciliation of Net Debt. (2) LTIR: Lost Time Injury Rate applies to CRC employees only. (3) CRC’s IIR applies to both CRC employees, suppliers and vendors while working on our operations.   4
Wells Fargo Energy Conference
Trending to High-End of 2021 FCF Guidance & Initiating Share Repurchase Program
                                                          PRIOR                                  REVISED                                                                                             IMPROVING
                                                         GUIDANCE                               GUIDANCE                                                                                             G&A COST                       ~ $5/boe
                                                                                                                                                                                                     STRUCTURE
                                                         FY   2021E1                             FY   2021E1                                                                       E2021 G&A cost per boe2 is trending down toward low end of range
       Total Production                                                                          Reaffirmed
                                                            96 – 99
       (Mboepd)                                                                               Trending to high end                                                                                   STRONG
       Oil Production
                                                                                                                                                                                                     LIQUIDITY                      ~$680MM
                                                            60 – 62                              Reaffirmed
       (Mbopd)                                                                                Trending to high end
                                                                                                                                                                                      Estimated YE21 Liquidity1,3 , includes cash & borrowing capacity
                                                         $600 - $615                            $615 - $630
       Operating Costs ($MM)                           $16.60 - $17.55 $/boe                   $17.01 - $17.98 $/boe                     SHIFTING $15MM
                                                                                                                                         FROM CAPITAL TO                                             LEADING
       Capital Spend ($MM)                               $200 - $225                            $185 - $210                                    OPEX                                                  LEVERAGE                       0.3x - 0.6x
                                                                                                                                                                                                     POSITION
       G&A ($MM)                                         $180 - $190                             Reaffirmed                                                                                      Estimated YE21 NET DEBT to Adj. EBITDAX2,3
                                                        $4.98 - $5.42 $/boe                    Trending to low end

       Free Cash Flow2                                                                           Reaffirmed
       ($MM)
                                                         $250 - $350
                                                                                              Trending to high end                                                                                   ROBUST FCF
                                                                                                                                                                                                     YIELD2,3
                                                                                                                                                                                                                                        ~18 %
       Free Cash Flow Yield3                                                                     Reaffirmed
                                                          13% - 18%
       (%)                                                                                    Trending to high end                                                                            E2021 FCF Yield2,3 is trending toward high end of range

                                                                                             Return Cash to Shareholders
                                                                                        $150 million Share Repurchase Program
                                                                                                      Approved in 2Q 2021; in place through 1Q 2022
                                                                                                   Representing ~8% of the outstanding shares as of April 30, 2021

(1) 2021E Forecast uses $60 per barrel Brent pricing, $38.75 per barrel for NGLs and $2.75 per mcf NYMEX gas. (2) FCF, Adj. EBITDAX and net debt are non-GAAP measures. For all historical non-GAAP financial measures please see the Investor Relations page at www.crc.com for a
reconciliation to the closest GAAP measure and other additional information. 2021E and 2021E-2025E are based on forecast amounts which were included in the Strategy Day presentation (slide 12 & 19) and can be found in the Investor Relations page on crc.com. 1Q21 net debt to 21E Adj.
EBITDAX is calculated as net debt as of 3/31/21 over 2021E Adj. EBITDAX. See slide 19 for reconciliation. (3) FCF Yield reflects Free Cash Flow divided by market cap, estimated as of May 6, 2021. FCF used in calculation assumes the high end of the range.

                      June 2, 2021                                                                                                                                                                                                                                                            5
Wells Fargo Energy Conference
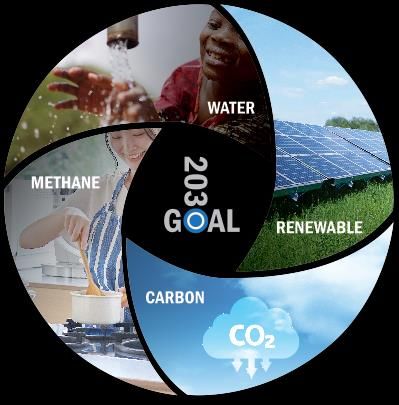
CRC’s Reserves Value at Current Prices Provides Equity Upside
                         CURRENT OIL PRICING OFFERS ROBUST UPSIDE                                                                                                             RESERVES MULTIPLE COMPARED TO PEERS4 SHOWS
                                                                                                                                                                                    STRONG INVESTMENT OPPORTUNITY
                                                                                                                                                                   8.0x

                                                                                                                                                                   7.0x
                                                                                             $5,720      MM3                                                       6.0x
                         PV-10 Reserves

                                                                                                                                                        EV/SMOG5
                                                                                               ~10% PUD                                                            5.0x
                         Value1 and Metrics
                                                                                                                                                                   4.0x
                         At SEC Price Deck
                         and Today’s Prices                                                                                                                        3.0x
                                                                                                ~96%                                                               2.0x
                                                                                              of PV-101
                                                                                              from Core                                                            1.0x
                                                                                                Fields6                                                            0.0x

                                                                                                                                                                                                                                                                            CRC
                                                                                                                                                                                   2
                                                                                                                                                                            1

                                                                                                                                                                                          3

                                                                                                                                                                                                4

                                                                                                                                                                                                    5

                                                                                                                                                                                                               6

                                                                                                                                                                                                                   7

                                                                                                                                                                                                                         8

                                                                                                                                                                                                                               9
                                                                                                                                                                                                        Avg.

                                                                                                                                                                                                                                     10

                                                                                                                                                                                                                                            11

                                                                                                                                                                                                                                                  12

                                                                                                                                                                                                                                                         13

                                                                                                                                                                                                                                                               14

                                                                                                                                                                                                                                                                     15
                                               $2,426 MM1,2
                                                                                                ~90% PDP
                                                                                                                                                                                                                                SEC Price Deck2                 $60 Brent3
                                                                                                                                                       Total Proved Reserves / 2020 Exit Production                                 11.8 years                  13.6 years
                                                                                                                                                       PV-101             ($MM)                                                       $2,426                      $5,720
                                                                                                                                                       PV-101             / Net   Debt1   ($)                                            5.2x                       12.2x
                                                                                                                                                       Net Debt1 / Total Proved Reserves ($/boe)                                       $1.06                        $0.92

                                         SEC 2020 Price Deck2                                 $60 Brent3                                               EV5/Total Proved Reserves ($/boe)                                               $5.57                        $4.83
                                                 442 MMboe                                      509 MMboe                                              PV-101             /Total Proved Reserves ($/boe)                               $5.49                      $11.24
                                                                                                                                                       EV5/PV-101             ($)                                                        1.0x                        0.4x
(1) PV-10 is as of December 31, 2020. Net Debt is as of March 31, 2021. PV-10 and Net Debt are non-GAAP measures. For all historical non-GAAP financial measures please see the Investor Relations page at www.crc.com for a reconciliation to the closest GAAP measure and other additional
information. (2) Represents FY2020 Reserves at SEC prices as of December 31, 2020 and after factoring in price realizations reflect average realized pricing of $42.35 per barrel for oil, $26.42 per barrel for NGLs and $2.28 per Mcf for natural gas. (3) Average realized prices used to estimate
our PV-10 of proved reserves were $60 per barrel for oil, $38.75 per barrel of NGLs and $2.50 per Mcf for natural gas. GAAP does not prescribe a standardized measure of reserves on a basis other than SEC pricing. As such, no standardized measure of our PV-10 of proved reserves using $60
per barrel for oil, $38.75 per barrel of NGLs and $2.50 per Mcf for natural gas has been provided (4) Peers consist of AR, BRY, COG, CPE, CRC, CRK, KOS, MGRY, MTDR, MUR, PDCE, RRC, SM, SWN, VET, XEC. Source FactSet as of April 29, 2021. (5) Enterprise Value estimated as of April 29,
2021. SMOG as of December 31, 2020. (6) See Strategy Day presentation (slide 14) for core field description.

                        June 2, 2021                                                                                                                                                                                                                                                                    6
Wells Fargo Energy Conference
First Quarter 2021 Results Comparison
                                                                                                                                                                                                         1Q21 SNAPSHOT
                                                                    1                          1                          1
                                                          1Q20                      4Q20                       1Q21
                                                       Predecessor                 Non-GAAP                   Successor
                                                                                                                                                                                                                                 Sacramento Basin
 Net Oil Production (MBbl/d)                                  77                         63                         60
                                                                                                                                                                                                                                  ~3,000 BOE per day

 Total Net Production (MBoe/d)                               121                        103                         99

 Realized Oil Price w/ Hedge ($/Bbl)                      $55.50                     $44.39                      $53.73                                                                                                                 San Joaquin Basin
                                                                                                                                                                                                                                       ~73,000 BOE per day
 Realized NGL Price ($/Bbl)                               $29.28                     $35.45                      $48.77

 Realized Natural Gas Price ($/Mcf)                         $2.25                      $3.03                      $3.29

 Adjusted Net (Loss) 2 Income
                                                          ($0.16)                          -                      $1.22
 per Share – Diluted ($/share)

 Adjusted EBITDAX2 ($MM)                                    $251                       $116                       $189

 Internally Funded Capital Investments                                                                                                                         Ventura Basin
                                                             $30                        $10                        $27
 ($MM)
                                                                                                                                                            ~3,000 BOE per day
 Cash Provided (Used) by Operating
                                                            $228                       ($35)                      $147
 Activities ($MM)

 Free Cash Flow2 ($MM)                                      $198                       ($45)                       $120

 One-time bankruptcy related fees
                                                                                                                                                                       Los Angeles Basin
                                                              $5                        $39                         $2                                               ~20,000 BOE per day
 ($MM)
 Free Cash Flow2, excluding one-time
                                                            $203                        ($6)                      $122
 bankruptcy related fees ($MM)
                                                                                                                                                                                                                                                                                   Oil
                                                                                                                                                                                                                 71%
                                                                                                                                                                                                               61%                     12%9% 27%
                                                                                                                                                                                                                                              20%                                  NGLs
                                                                                                                                                                                                                                                                                   Gas
                         (1) Periods subsequent to October 31, 2020 (Successor period) and ending on or prior to October 31, 2020 (Predecessor period) are distinct reporting periods as a result of the adoption of fresh start accounting upon emergence from Chapter 11 bankruptcy and as such,
          June 2, 2021   1Q21 is not comparable to prior periods. For further information, consult the 2020 10K, Part II, Item 8 – Financial Statements and Supplementary Data, Note 3 Fresh Start Accounting. (2) FCF, Adj. net income and Adj. EBITDAX are non-GAAP measures. For all historical non-   7
                         GAAP financial measures, please see the Investor Relations page at www.crc.com for a reconciliation to the closest GAAP measure and other additional information.
Wells Fargo Energy Conference
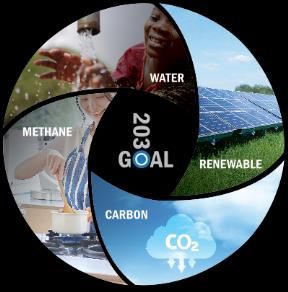
First Quarter 2021 Cost Comparison
                                                                                   1Q201                     4Q201                     1Q211
                                                                                Predecessor                 Non-GAAP                  Successor                                                    INTEGRATED BUSINESS MODEL & OPERATIONAL PERFOMANCE
 Energy operating costs2 ($/Boe)                                                     $3.71                      $4.39                     $4.70                                                                     DRIVING CASH FLOWS
                                                                                                                                                                                            $250
 Gas processing costs ($/Boe)                                                        $0.67                      $0.59                     $0.53

 Non-energy operating costs2 ($/Boe)                                                $13.00                     $12.44                   $13.10
                                                                                                                                                                                                                                                                             $19                $7
                                                                                                                                                                                            $200
 Operating costs ($/Boe)                                                            $17.38                     $17.42                   $18.33                                                                                                               $11
                                                                                                                                                                                                                                            $1

                                                                                                                                                                  Adjusted EBITDAX1 ($MM)
 Energy operating costs, excluding effects of
                                                                                     $3.42                      $4.01                     $4.14
 PSC-type contracts2,3 ($/Boe)
                                                                                                                                                                                            $150
 Gas processing costs ($/Boe)                                                        $0.67                      $0.59                     $0.53
                                                                                                                                                                                                                           $76
 Non-energy operating costs, excluding effects
                                                                                    $12.39                     $11.69                   $12.05                                              $100               $27
 of PSC-type contracts2,3 ($/Boe)                                                                                                                                                                                                                                                                              $189
 Operating costs, excluding effects of PSC-type
                                                                                    $16.48                     $16.29                   $16.72
 contracts3 ($/Boe)
                                                                                                                                                                                                    $116
                                                                                                                                                                                            $50
 G&A ($MM)                                                                             $60                       $59                       $48

 Taxes other than on income ($MM)                                                      $41                       $23                       $40
                                                                                                                                                                                             $0                                    4
 Exploration expense ($MM)                                                              $5                        $2                        $2                                                       4Q20 1   Volume       Price         Operating           G&A            Asset     5
                                                                                                                                                                                                                                                                                               Other 6         1Q21
                                                                                                                                                                                                   Non-GAAP                               Costs                          Optimization
 Interest expense, net ($MM)                                                           $87                       $17                       $13

 DD&A ($MM)                                                                           $119                       $66                       $52
                                                                                                                                                                                                         CRC plans to maintain recent cost savings and
 Other & transportation costs                  ($MM)7                                  $18                       $43                       $42                                                         implement further cost reduction measures in 2021
(1) Periods subsequent to October 31, 2020 (Successor period) and ending on or prior to October 31, 2020 (Predecessor period) are distinct reporting periods as a result of the adoption of fresh start accounting upon emergence from Chapter 11 bankruptcy and as such, 1Q21 is not comparable to prior periods. For
further information, consult the 2020 10K, Part II, Item 8 – Financial Statements and Supplementary Data, Note 3 Fresh Start Accounting. (2) Energy operating costs include purchases of fuel gas and electricity used in our operations and internal costs to produce electricity used in our fields. Non-energy operating costs
equal total operating costs less energy operating costs and gas processing costs. (3) Operating costs excluding effects of PSC-type contracts is a non-GAAP measure. For all historical non-GAAP financial measures, please see the Investor Relations page at www.crc.com for a reconciliation to the closest GAAP measure and
other additional information. (4) Price change includes settled hedges. (5) Represents changes in trading income. (6) Other predominantly includes changes in taxes other than on income. (7) Other costs include accretion, severance and other expenses.

                        June 2, 2021                                                                                                                                                                                                                                                                                                8
Hedging Program Protects Cash Flow

               STRATEGY                                                                                                                           OIL HEDGE PROTECTION1 as of April 30, 2021
               ▪ CRC hedging strategy typically utilizes a mixture of Puts, Collars                                                                                                     2Q21             3Q21            4Q21           1H22            2H22             Jan-Oct   23
                 and Swaps to protect cash flow and to ensure CRC’s ability to
                 live within cash flow, and is also aligned with CRC’s RBL                                                                                   Barrels per Day            33,537           36,688          37,037         33,842          27,773            17,758
                 requirements
                                                                                                                                       SOLD CALLS
                                                                                                                                                            Weighted-Average
                                                                                                                                                                                        $48.73           $50.47          $60.75         $60.00          $58.62            $58.01
                                                                                                                                                             Price per Barrel
               CASH FLOW PROTECTED

               ▪ CRC has hedges in place for ~80% of anticipated oil production                                                                              Barrels per Day            37,872           36,943          35,820         33,842          27,773            17,758
                 through December 2021 and ~65% through December 2022,                                                                 PURCHASED
                                                                                                                                       PUTS
                 and thereafter ~44% through 3Q 2023                                                                                                        Weighted-Average
                                                                                                                                                                                        $40.00           $40.18          $40.19         $40.00          $40.00            $40.00
                                                                                                                                                             Price per Barrel

                                                                                                                                                             Barrels per Day            15,149           14,647          14,193          3,416           2,674                -
         HEDGE CONTRACT SETTLEMENTS EXPECTED TO SIGNIFICANTLY                                                                          SOLD PUTS
                      DECREASE IN 2022 & 2023                                                                                                               Weighted-Average
                                                                                                                                                                                        $31.41           $30.00          $32.00         $32.00          $32.00                -
                                                                                                                                                             Price per Barrel

                                                                                                                      Jan –Oct
                 1Q21     2Q21E     3Q21E       4Q21E         2021E         1H22E         2H22E         2022E                                                Barrels per Day             9,639           10,063          10,922          7,763           6,386             5,919
                                                                                                                       2023E

   Hedge                                                                                                                               SWAPS
  Contract                                                                                                                                                  Weighted-Average
                 ($39)    ($72)     ($67)        ($26)        ($204)        ($38)         ($31)          ($69)         ($33)                                                            $46.35           $49.09          $51.11         $48.17          $46.34            $47.57
Settlements2                                                                                                                                                 Price per Barrel
   ($MM)

                                    (1) Hedges are based on weighted-average Brent prices per barrel. (2) Represents estimated net cash settlement payments for derivative contracts as of 4/30/2021, except 1Q21 which is actual for the three months ended March 31,             9
                     June 2, 2021   2021.
Maintaining Balance Sheet Strength, Liquidity, and Financial Flexibility
                                            ESTIMATED LIQUIDITY ROLL FORWARD1                                                                                                                             3/31/21 DEBT SNAPSHOT
              $800
                                                                                                                              ~$680 MM
              $700                                                                                                                                                          ($ in millions)
              $600              $545 MM                                                                                                                                     Revolving Credit Facility (RCF)                                                      $                 0
              $500                                                                                                                                                          7.125% Senior Notes                                                                                  600
$ Millions

              $400                                                                                                                                                              Face Value of Debt                                                               $               600
              $300                                                                                                                                                          Less Available Cash                                                                              (130)

              $200                                                                                                                                                              Net Debt                                                                         $               470

              $100

                $0
                           3/31/21 Liquidity            Scheduled RCF Step- 2Q21-4Q21E Increase in                        12/31/2021 YE
                                                              Down 2            Available Cash                               Liquidity

                                          NO SIGNIFICANT MATURITIES UNTIL 2026                                                                                                               MULTIPLES DEMONSTRATE FLEXIBILITY3
              $800
                                                                                                                                                                           ($ in millions)
              $600
                                                                                         Undrawn4                                                                          RCF Borrowing Base                                                                                $      1,200
 $ Millions

              $400
                                                                                                                                                                           2021E Free Cash Flow3                                                                         $250 – $350
              $200                                                                                                                                                         YE 2021E Net Debt3 / 2021E Adjusted EBITDAX3                                                     0.3x – 0.6x
                 $0                                                                                                                                                        2021E Adjusted           EBITDAX3      / 2021E Interest         Expense3                     10.4x – 14.5x
                           3/31/21                 2022                 2023                 2024                 2025                 2026
                           Liquidity

                 3/31/2021 Revolver Availability                  Cash          Revolver Availability at Maturity               Senior Notes

              (1) Prior to share repurchases. (2) The Revolving Credit Facility had a scheduled step-down in elected commitments in April 2021. (3) Net Debt, Adj. EBITDAX and Free Cash Flow reflect non-GAAP financial measures. For all historical non-GAAP financial measures, please see the
              Investor Relations page at www.crc.com for a reconciliation to the closest GAAP measure and other additional information. 2021E are based on forecast amounts which were included in the Strategy Day presentation (slides 9 & 12) and can be found in the Investor Relations
              page on crc.com. (4) Undrawn revolver as of April 30, 2021.

                           June 2, 2021                                                                                                                                                                                                                                                             10
ESG Strategy Evolving to Reflect the Energy Transition to Net Zero

                   CRC’S MANAGEMENT AND THE BOARD OF DIRECTORS ARE UNDERGOING A THOROUGH REVIEW OF CRC’S ESG
                                      STRATEGY TO ENHANCE ITS DECARBONIZATION INITIATIVES

CONTINUE TO STRENGTHEN 2030                  MAINTAIN REPORTING TRANSPARENCY         FOCUS ON DECARBONIZATION &
SUSTAINABILITY GOALS                         AND DISCLOSURE                          ENERGY TRANSITION
SIGNIFICANT PROGRESS MADE ON WATER
AND METHANE GOALS                                                                    CARBON CAPTURE UTILIZATION AND STORAGE
                                                                                           ▪ Elk Hills CCUS
                                                                                           ▪ Other assets / fields CCS
                                                                                     RENEWABLE SOLAR POWER
                      Focus areas of                                                       ▪ Grid Supply (Front-of-the-meter)
                   strategic evaluation
                                                                                           ▪ Self Supply (Behind-the-meter)
                                                                                     OTHER RENEWABLE OPPORTUNITIES
                                                                                           ▪ Energy Production
                                                                                           ▪ Incorporation into CAISO
FUTURE FOCUS GEARED TOWARDS
CARBON AND RENEWABLES

                                                                                                                                11
        June 2, 2021
CRC’s Strong Foundation Provides Quality Investment Opportunity

                                                      New Strategic Direction

                                                      Strong Financial Position

                                                      Cash-Advantaged Portfolio

                                                      Integrated Model

                                                      Committed to ESG Advancement

                                             California Resources Corporation

                                                                                     12
     June 2, 2021
SUPPLEMENTAL MATERIALS
Introducing a New Chair of the Board

                                                                       ▪ Appointed Chair of the Board in April 2021; Director since 2020
                                                                       ▪ 26 years of energy experience in both financial and operational appointments
                                Tiffany (TJ) Thom Cepak                ▪ Serving as Director of Patterson-UTI since August 2014 and as a Director of Penn Virginia
                                Chair of the Board                       Corporation since September 2019; previously a Director of Yates Petroleum Corporation
                                                                       ▪ Previously the CFO of Energy XXI Gulf Coast Inc., KLR Energy and EPL Oil & Gas. While at
                                Chair of the Audit Committee             EPL Oil & Gas, served in many different leadership roles involving engineering, treasury
                                Member of the Operations &               and investor relations; prior to that, held multiple operational roles at Exxon Production
                                Sustainability Committee                 Company and ExxonMobil Company
                                                                       ▪ MBA from Tulane University and a Bachelor of Science in Engineering from the University
                                                                         of Illinois

       “
                                                     “
           I am proud to be appointed as CRC’s Chair of the Board and look forward to providing oversight and guidance as CRC
           moves in the new strategic direction.
                                                                                                           – TJ Thom Cepak, Chair of the Board

       “
                                                                                                               “
           With 26 years of experience in the energy industry, Ms. Cepak is both well-known and well-respected in the industry, TJ brings
           brings tremendous expertise to the role and we look forward to her leadership of our board.
                                                                                                           – Mac McFarland, President and CEO

                                                                                                                                                                      14
CRC : Focused on Decreasing GHG Emissions
                                                                                                                                                                                                                 TOTAL 2020 EMISSIONS CONTINUE TO FALL…
              California has the most stringent air quality laws and regulations

                                                                                                                                       Total GHG Emissions from Integrated Operations
                                                                                                                                                                                                           4.0
              governing oil and natural gas production, transportation, and
              other commercial and industrial development

                                                                                                                                                (Million Metric Tonnes CO2e)
                                                                                                                                                                                                           3.5

              CRC accounts for and reports its GHG emissions to CARB under
              California’s pioneering Cap-and-Trade program                                                                                                                                                3.0

                                                                                                                                                                                                           2.5
              CRC’s total GHG emissions further decreased in 2020 and are
              now ~20%1 below our 2013 levels
                                                                                                                                                                                                           2.0
                                                                                                                                                                                                                  2017        2018       2019        2020 1
              In 2020, CRC further surpassed its 2030 Methane Sustainability
              Goal, reducing methane emissions from our operations by nearly                                                                                                                                     …AND 2020 METHANE EMISSIONS FOLLOWED
                                                                                                                                                                                                         9,000

                                                                                                                                                                     Methane Emissions (Metric tonnes)
              68%1 since 2013
                                                                                                                                                                                                         8,000
                                                                                                                                                                                                         7,000
                                                                                                                                                                                                         6,000
                                                                                                                                                                                                         5,000
                                                                                                                                                                                                         4,000
                                                                                                                                                                                                         3,000
                                                                                                                                                                                                         2,000
                                                                                                                                                                                                         1,000
                                                                                                                                                                                                            0
                                                                                                                                                                                                                                                            1
                                                                                                                                                                                                                  2017        2018       2019        2020

                                                                                                                                                                      Attained CDP’s highest 2020 climate disclosure ranking among all U.S. oil
For additional information, please refer to CRC’s Sustainability Report which references both Sustainability
Accounting Standards Board (SASB) and Global Reporting Initiative (GRI) standards at crc.com/esg.
                                                                                                                                                                      and gas companies with an A-, tying for first with one other U.S.-based E&P

                                  (1) 2020 internal emissions are as reported to the California Air Resources Board. CRC is required to undergo third-party verification of these figures and they are subject to change based on the results of an expected    15
             June 2, 2021         audit in August 2021.
Shifting Capital to Improve Capital Efficiency

 STRONG FOCUS ON BEST OPPORTUNITIES INCREMENTAL                                                          2021E REVISED CAPITAL PROGRAM OF $185MM - $210MM
 BARRELS THROUGH MAINTENANCE
 ▪ ~90% of CRC’s net active wells are on artificial lift. Due to a backlog of wells                              Infrastructure
   accumulated in 2020, CRC has the ability to increase uptime and production                                      and Other
   through high impact well work and OPEX maintenance capital                                                     $45-$50MM

                                                                                                                                      Total
 ▪ Through rapid technical identification & commercial analysis, well remediation
                                                                                                                                  $185-$210MM
   work is prioritized to bring the highest impact wells back online first
                                                                                                                                   90% of D&C / WO
                                                                                                                                  Capital in core fields1
 ▪ Discretionary OPEX can be used to bring offline barrels back into production and
   represents the most efficient use of capital and fastest return of the PDP                               Capital Workovers
   production                                                                                                 $35-$40MM                                        Drilling
                                                                                                                                                            $105-$120MM
 ▪ CRC optimized investment dollars by shifting $15 MM from 2021 drilling and
   completions capital to downhole maintenance projects which provide efficiencies
   and faster payouts

                             ((1) See Strategy Day presentation (slide 14) for core field description.
            June 2, 2021                                                                                                                                                  16
CRC Price Realizations Remained Strong in CA’s Improving Market Dynamics
                                            OIL PRICE REALIZATION (WITH HEDGES)                                                                                         NATURAL GAS PRICE REALIZATION
                                                                            WTI             Realizations              Brent
                     $80                                                                                                                            $4.00                                        NYMEX           Realizations
                     $70                                                                                      $61.10

                                                                                                                                  $/MMBtu & $/Mcf
                                                                                                                                                    $3.50                                                              $3.29
                                     $55.50                                                                                                                                                              $3.03
                     $60                                                                                            $57.84
 $/Bbl

                            $50.96                                  $43.37              $45.24                                                      $3.00
                     $50                                            $42.15              $44.39
                                                                                                                   $53.73
                                                $33.27                                                                                              $2.50       $2.25                $2.22                             $2.72
                     $40        $46.17                                                                                                                                                                   $2.66
                                                $30.82              $40.93                                                                                                 $1.77
                                                                                        $42.66
                     $30                                                                                                                            $2.00                 $1.65

                      -    ≈                              $27.85                                                                                            ≈   $2.05                        $1.93
                     $20                                                                                                                                -
                                                                                                                                                    $1.50
                                 1Q20            2Q20                3Q20                 4Q20                 1Q21                                             1Q20      2Q20          3Q20             4Q20          1Q21

Realization                                                                                                                    Realization
                                 120%            111%               103%                 104%                   93%            % of NYMEX
                                                                                                                                                                110%       93%          115%             114%           121%
 % of WTI1

                                     NGL PRICE REALIZATION - % OF WTI & BRENT                                                                 ▪ California refiners continued to import waterborne cargoes to fill the majority
                                                                                                                                                of their crude requirement; as a result, CRC physical crude realizations reflect
                      90%                                                                        WTI            Brent                           strong global crude differentials and a premium over WTI
                                                   76%                                 83%                               84%
                      80%                                                                                                                     ▪ Realized gas prices remain strong vs NYMEX due to cooler temps, limited
  % of WTI & Brent

                                     63%                                                                          80%                           withdrawal capacity on SoCal Gas, and lower production in the West
                      70%                                               61%                  78%

                      60%                                                                                                                     ▪ NGL price realizations remained strong through the first quarter, benefiting
                                                   63%                                                                                          from well negotiated sales differentials and strong NGL values relative to
                      50%            57%                                58%
                                                                                                                                                crude
                      40%

                      30%
                            ≈                                                                                                                        CRC realizations for all hydrocarbon streams remained strong vs
                       -
                                     1Q20         2Q20                 3Q20                 4Q20                 1Q21                                benchmarks

                                June 2, 2021     (1) Oil price realization without hedges as a % of WTI was 100% for 1Q21.                                                                                                         17
Integrated Assets and Ancillary Businesses Further Support Financials

               STRATEGIC INTEGRATION AND OPERATIONAL STREAMLINING                                                                                         INCREMENTAL REVENUE CAPTURE
                ▪ Elk Hills Power Plant reduces OPEX ~$100MM/year, allows for more                                                                          ▪ Additional liquids by processing off spec gas
                  efficient operation of asset                                                                                                              ▪ Sale of excess power to third parties
                ▪ Gathering Systems provide access to multiple delivery points                                                                              ▪ Existing power sales contract through 2023, capturing more
                ▪ Gas compression, tank battery and oil processing facilities consolidations,                                                                 favorable pricing
                  operations optimization and chemical treatment program optimization
                ▪ Water and Steam Infrastructure lowers OPEX by self-supplying softened
                  water for steam

                                                              IMPRESSIVE MIDSTREAM AND POWER GENERATION CAPACITY
                                                                                                                                                         CAPACITY

                                                  Description                          Quantity             Unit1            San Joaquin Basin                Other Basins                Total
                                           Gas Processing Plants                            8             MMcf/d                      525                            40                   565
                                                 Power Plants                               3                MW                       595                            48                   643
                                         Steam Generators/Plants                          >30              MBbl/d                     150                             -                   150
                                                 Compressors                             >300               MHp                       320                            31                   351
                                      Water Management Systems                              -              MBw/d                     1,900                         2,055                 3,955
                                               Water Softeners                             16              MBw/d                      125                             -                   125
                                            Oil and NGL Storage                             -              MBbls                      408                           271                   679
                                             Gathering Systems                              -               Miles                        -                            -                 >8,000

      June 2, 2021       (1) MW refers to megawatts of power; MBbl/d refers to thousand barrels of steam per day; MHp refers to thousand horsepower; MBw/d refers to thousand barrels of water per day; MBbl refers to thousands of barrels.   18
Leverage Reconciliation

  Leverage and Net Debt
  We calculate the leverage ratio by dividing net debt by adjusted EBITDAX for                                                                              (in millions)                                                                     Low            High
  the applicable period. We define net debt as the face value of our debt less
                                                                                                                                                            Face value of debt                                                              $600            $600
  available cash. We believe the leverage ratio is an important metric of the
  operational and financial health of our Company and is useful to investors                                                                                Available cash                                                                  (130)           (130)
  as an indicator of our ability to incur additional debt and to service our                                                                                Net Debt as of March 31, 2021                                                   $470            $470
  existing debt. The following table presents a reconciliation of our leverage
                                                                                                                                                            2021E Adjusted EBITDAX                                                          $725            $625
  ratio. The leverage ratio is a supplemental measure of our performance
  that is not required by or presented in accordance with U.S. generally                                                                                    1Q21E Leverage Ratio                                                             0.6x            0.8x
  accepted accounting principles (“GAAP”).

                       Note: Adj. EBITDAX and net debt are non-GAAP measures. For all historical non-GAAP financial measures please see the Investor Relations page at www.crc.com for a reconciliation to the closest GAAP measure and other additional information.   19
        June 2, 2021   2021 estimates and 2021E Adj. EBITDAX are based on forecast amounts which were included in the Strategy Day presentation (slides 12 and 27, respectively) and can be found in the Investor Relations page on crc.com.
Joanna Park (Investor Relations)   Richard Venn (Media)

818-661-3731                       818-661-6014

Joanna.Park@crc.com                Richard.Venn@crc.com
You can also read