Investor Presentation - Nareit - June 2018 - Park Hotels & Resorts
←
→
Page content transcription
If your browser does not render page correctly, please read the page content below

Investor Presentation
                          Nareit – June 2018

Waldorf Astoria Orlando           Hilton Chicago   Hilton Hawaiian Village Waikiki Beach Resort
Mission
              To be the preeminent lodging REIT,
          focused on consistently delivering superior,
        risk-adjusted returns for stockholders through
     active asset management and a thoughtful external
         growth strategy, while maintaining a strong
                  and flexible balance sheet

2|
Pillars of our Corporate Strategy
Aggressive Asset Management
Continually improve property level operating performance
Consistently implement revenue management initiatives to optimize market pricing /
segment mix
Hilton Chicago
Prudent Capital Allocation
Allocate capital effectively by leveraging scale, liquidity and M&A expertise to create value
throughout all phases of the lodging cycle
Employ an active capital recycling program—expanding our presence in target markets with
a focus on brand and operator diversification, while reducing exposure to slower growth
assets/markets
Hilton Waikoloa Village
Target value enhancement projects with strong unlevered ROI yields
Strong and Flexible Balance Sheet
Preserve a strong and flexible balance sheet, with a targeted leverage ratio of 3x to 5x
Maintain strong liquidity across lodging cycle and access to multiple types of financing
Aspire to achieve investment grade rating
Juniper Hotel Cupertino, Curio Collection
3|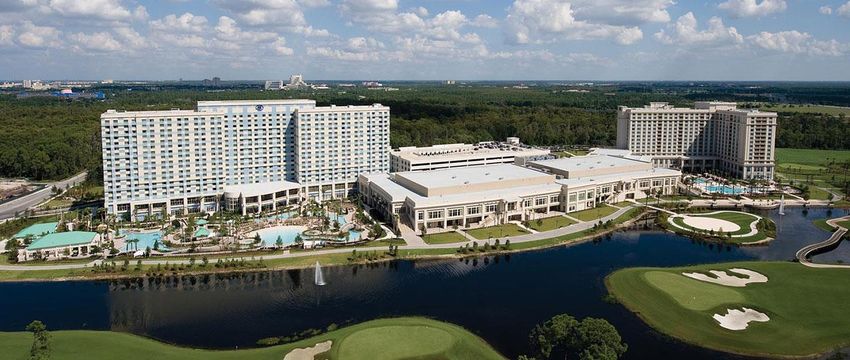
Park Hotels & Resorts Investment Thesis
•1 High Quality Portfolio – Strong total stockholder return
performance YTD, but still trading at a discount
•2 Solid Fundamentals - Supported by improving macro
trends and limited new supply
•3 Significant Growth Profile - Through aggressive asset
management, ROI initiatives and single asset opportunities
•4 Capital Recycling – Improving the portfolio through
prudent capital allocation
•5 Strong Balance Sheet - With ample liquidity available to
execute on strategic plan Following a 13.7% total stockholder return in 2017,
YTD Park has continued its strong performance.
•6 Well covered, Above Average Dividend Yield However, Park still trades at a discount to its peers
(12.7x estimated ‘18 EBITDA vs 14.0x for peers)
•7 Developing a Track Record of Near-Term Success:
Prudent • 13 non-core assets sold for over $500M in 2018
Capital • Repurchased 14M shares at a significant discount to NAV
Allocation • Special Dividend of $0.45/share from sale of Hilton Berlin
• Improved relative EBITDA margin by 48 bps in 2017
Asset Mgmt
Initiatives
• Additional 75 bps anticipated for 2018 and 100 bps
anticipated for 2019
• Successfully transitioned off Hilton systems and
Infrastructure implemented proprietary Park systems and software
4|
(1) Year-to-date 2018 Total Returns as of 5/30/18
(2) Park’s 2018 EBITDA multiple assumes midpoint of EBITDA guidance ($730M) as of 5/3/18
Capital Recycling / HNA Secondary
Opportunistically repurchased 14M shares at a significant discount to NAV
Former stockholder HNA announced the secondary offering of its approximately 40M Park shares on March 5th
Utilizing proceeds from the recent completion of Phase I of the capital recycling program, Park purchased 14M
shares from HNA for $24.85 at a significant discount to NAV
Since the HNA secondary was announced, Park has outperformed its peers by 620bps, with the stock up 30%, or
760bps when excluding M&A target LHO(1)
The transaction entirely eliminated the HNA overhang, while broadening Park’s shareholder base to include a
deeper base of REIT dedicated and long-only shareholders
Lodging REIT Peer Performance Since March 5, 2018
5 | (1) Year-to-date as of 5/30/18
Capital Recycling: Hilton Berlin JV Sale
Pro Rata Gross Proceeds to Park of $140M; ~$350M gross sale price ~20x Hotel’s 2017 EBITDA
In May 2018, Park completed the opportunistic sale of its joint venture interest in the 601-room Hilton Berlin along
with its JV partner
Sale represented disposition of a non-core asset based on location (international market) and ownership interest
(unconsolidated joint venture), further simplifying Park’s portfolio
Park will pay a special dividend of $0.45 per share in relation to the sale
Transaction Details:
~$350M in gross proceeds,
or ~$583,000 per key
Park sold its 40% joint
venture interest for gross
proceeds of ~$140M
Sale price represented
~20x multiple of Hotel’s
2017 EBITDA
Estimated capex savings of
$24M (pro rata)
13th hotel sold since
beginning of 2018 and 10th
international hotel sale
6|
Park Team

                                                Chairman, President
                                                      & CEO
                                                   Tom Baltimore

Executive Management
       EVP, CFO &                                    EVP, HR                                   EVP, Asset
        Treasurer             EVP, GC                                    EVP, CIO             Management
                              Tom Morey             Jill Olander         Matt Sparks
       Sean Dell’Orto                                                                         Rob Tanenbaum

Senior Management
        SVP, FP&A              VP, D&C              SVP, CAO             SVP, Strategy           SVP, Tax
        Diem Larsen           John Leary            Darren Robb           Ian Weissman          Scott Winer

Park Management                                       Board of Directors
➢ 25 years average experience among senior             ➢ Best-in-class board including former CEOs and
  leadership                                             CFOs of Fortune 500 Companies
➢ Total of ~85 employees at Park Headquarters          ➢ Significant REIT experience across industries

 7|
Company Highlights
      Park Hotels & Resorts is a leading lodging real estate investment trust with a diverse portfolio of iconic and
          market-leading hotels and resorts with significant underlying real estate value in top U.S. markets

                                                                                                                                         TTM
 Leading Properties(3)                                                                                                             Performance(1)(2)
  54 premium-branded hotels and iconic resorts                                    with over 32,000 well-maintained rooms                  80%
                                                                                                                                         Total
  85%+ of rooms in luxury and upper-upscale segments                                                                                   Occupancy
  28 properties with 25k+ sq. ft. of meeting space and 10 properties with 125k+ sq. ft. of
  meeting space                                                                                                                          $209
                                                                                                                                        Total ADR

                                                                                                                                         $167
                                                                                                                                      Room RevPAR

                                                                                                                                         $202
                                                                                                                                        Avg. Room
                                                                                                                                         RevPAR
Hilton Miami Airport                                                Conrad Dublin                                                    of Top 10 Assets

                               Hilton Boston Logan Airport                                               Waldorf Astoria Orlando

      (1)   Total consolidated Hotel Occupancy, ADR and RevPAR; excludes unconsolidated joint ventures
  8 | (2)   Trailing twelve months (“TTM”) data is for the twelve months ended 3/31/18
      (3)   As of 5/18/18
Strong 1Q18 Performance and ’18 Outlook
1Q18 Operating Results

             1.1%                                       10bps                              +$5M   +3.6%                   +6.8%
        Comp      Comp       Asset Mgmt                                                           ’18 Group               ’19 Group
       RevPAR    EBITDA       Initiatives                                                            Pace                    Pace
                 Margin
2018 Outlook as of May 3, 2018
                          Metric                                                      Guidance       Change from Prior
 Comp RevPAR Growth:                                                          +0.5% to +2.5%                    +50bps
 Comp EBITDA Margins:                                                        -70bps to +30bps                   +10bps
 Adjusted EBITDA:                                                             $710M to $750M                     +$5M
Note: Guidance is no being updated or reconfirmed via this presentation.

  New York Hilton Midtown                                                  Hilton Caribe              Hilton Atlanta Airport

 9|
Portfolio Diversification(1)
Location Type(2): Markets(2): Revenue Segmentation:
Suburban, 5% Contract, 7%
Other, 21%
Honolulu, 21%
Airport, 15% San Diego, 1%
International, 1%
Resort, 44%
Key West, 3% Group, 28%
Orlando, 12%
DC Metro, 3%
Transient,
Urban, 36% 65%
Waikoloa, 5%
San Francisco,
New 12%
New
Chicago, 6% York,
Orleans,
7%
8%
80% Urban / Resort Nearly 50% exposure to Park’s “Grouping Up”
exposure Hawaii, Orlando, New strategy targets 400 bps shift
Orleans and Key West – all in Group demand
Reducing Airport /
Suburban exposure via with less than 2% projected Transient strategy of 50/50
capital recycling supply growth split between Leisure and
initiatives Target markets include DC, Corporate demand
Boston, Miami and SoCal
International exposure at just
1%, down from 5% at
beginning of 2018
(1) Calculated using results for the year ended 12/31/17 for the consolidated hotels we currently own
10 | (2) Total Hotel Adjusted EBITDA. See Appendix for definitions and reconciliations of these measures to comparable GAAP measuresPark’s Top 10 Portfolio in Focus
Park’s Top 10 Portfolio Accounts for 65% of Adjusted EBITDA, or $493M of Adjusted EBITDA (FY17)
2017
Rank Park's Top 10 Hotels EBITDA (M)
1 Hilton Hawaiian Village $154
2 Hilton San Francisco $58
3 Hilton New York $52
4 Hilton New Orleans $51
5 Hilton Bonnet Creek $43
6 Hilton Waikoloa $38
7 Hilton Chicago $30
$757M 8 Parc 55 $29
9 Waldorf Astoria Orlando $21
10 Waldorf Astoria Casa Marina $17
Other
Subtotal: $493
Total 2017 Adjusted EBITDA: $757
Top 10
Hotels
Source: S&P Global Market Intelligence
11 |Park Portfolio: Well Insulated from Supply
~2.5% Supply Growth for Park Supply Growth Exposure for Lodging REITs(1)
Against a backdrop of increased US supply Full-service REIT Supply Exposure
growth, Park is well positioned relative to its
peers 3.5% Average: 3.0%
Weighted Avg Supply
3.2% 3.1%
With outsized exposure to Orlando, Oahu, San 3.1% 3.0%
Growth '18 - '19
3.0% 3.0% 2.9%
Francisco and New Orleans, Park anticipates just
2.5% supply growth per annum through 2019, 2.5%
or 50bps lower than its peer group average
Favorable Supply Picture for Park’s Hotels(2) CHSP PEB DRH BHR HST XHR LHO SHO PK
20.4%
20.0% National Supply
Growth: 2.0%
15.0% 12.7%
11.7%
10.0%
6.8% 7.4%
6.1%
5.0% 4.1%
2.1% 2.2% 2.7%
1.0% 1.6%
0.0% 0.0% 0.0% 0.0% 0.4% 0.0%
0.0%
Supply Growth PK 2017 Adjusted EBITDA (%) National Supply Growth
Note: Charts presented above based on CBRE and Park estimates
12 | (1) Comparable full-service lodging REIT peers selected based on similar portfolio composition; includes data from CBRE’s Hotel Horizons forecasts
(2) Supply Growth data from CBRE’s March – May 2018 Hotel Horizons forecasts for Upper Priced hotels; represents average of 2018 and 2019 supply
forecasts. Park EBITDA represents 2017 data and includes pro rata share of unconsolidated JVsSize and Scale: Park ~2.5x the Size of Most Lodging REITs(1)
Park is the second largest publicly traded Lodging REIT
Full Service
Mixed & Limited Service
Source: Public company filings as of 3/31/18 and S&P Global. Market data as of 5/30/18
13 | (1) Assumption excludes HST from calculationDiversified Asset Types & Markets
High Barrier to Entry Urban Select Suburban and
and Convention Hotels Landmark Resorts Strategic Airport Hotels
Hilton Hawaiian
New York Hilton Hilton San Francisco Hilton Waikoloa Hilton Boston Logan
Village Waikiki Beach Hilton Short Hills
Midtown Union Square Village Airport
Resort
305 Rooms
1,878 rooms 1,921 rooms 1,110 rooms (1) 599 rooms
2,860 rooms
Waldorf Astoria
Hilton New Orleans Casa Marina, a Orlando/ Hilton McLean Tysons
Hilton Chicago Hilton Miami Airport
Riverside Waldorf Astoria Resort Hilton Orlando Corner
1,544 rooms Bonnet Creek 508 rooms
1,622 rooms 311 rooms 458 rooms
1,511 rooms
Note: room count as of 3/31/18
(1) Includes approximately 470 rooms that became part of HGV as part of the spin-off and that we reserved exclusive rights to occupy and operate. On various dates until December 2019, we are
required to release these rooms back to HGV for its renovation and use
14 |Additional Internal Growth Opportunities Remain
Maximize each asset’s full potential through a focused approach on revenue management and cost
containment initiatives, while purposefully addressing capital needs including ROI opportunities
TTM 1Q18 Comparable Hotel Adjusted EBITDA Margin(1)
Opportunity: Focus on narrowing margin gap with peers. For every 50bps of
relative margin improvement, EBITDA increases by ~$14 million, accounting
34.0% for approximately $175 million of value creation (2)
33.0% 32.7%
31.8% 31.6%
32.0%
30.9%
31.0% 30.6% 30.6% Peer Average: 30.5%
30.0%
29.0%
28.2% 28.0%
28.0%
27.0%
26.0%
25.0%
RHP CHSP BHR DRH XHR SHO PK HST
(1) See Appendix for our definitions and for reconciliations to comparable GAAP measures. Our definition of Hotel Adjusted EBITDA margin may not
15 | be comparable to similarly titled measures of our peers
(2) Assumes an EBITDA multiple of 12.5xAsset Management: Initiatives Overview
We estimate there is 175bps of embedded margin growth in the portfolio to be captured by YE2019
16 |Case Study: Bonnet Creek Complex
Asset Management partnered with property team to further drive awareness of the resort given the unique
attributes of the 1,009-room Hilton and 502-room Waldorf Astoria (WA)
• WA Orlando Focus on Luxury: Hired 2 luxury sales managers & instituted cross-selling with Casa Marina
Sales/ • Implemented lead-sharing platform with other Park Orlando hotels
Mktg • Opportunity to upbrand Hilton to a more upscale brand upon introduction of new brand by Hilton - similar
to a JW Marriott or Marriott Marquis
Revenue • Created 250 “Fireworks View” room types with premium rates
Mgmt
• Created 12 additional keys - 8 at the Hilton and 4 at the Waldorf in early 2017: $400K incremental EBITDA
• Created 5 new Jr. Suites at the Hilton by splitting Parlor Rooms: $150K incremental EBITDA
Oper. • LED Lighting: $600K savings per year and 40% IRR
Analysis • Laundry: $150K of annual savings
• Re-bid parking contract: incremental $700K annually
Waldorf Astoria Orlando Hilton Orlando Bonnet Creek
17 |Completed ROI Project: Hilton Santa Barbara Beachfront Resort
Conversion from a DoubleTree to a Hilton
360-room beachfront resort situated across 24 acres in Santa Barbara, CA
Resort benefits from its prime location in Santa Ynez wine country and in-house winery
Upbranding to a Hilton potentially allows the hotel to attract higher-rated group business and better yield transient business
$14M renovation cost(1) ($38,000/key) completed in April 2018
Scope
Guestrooms: case goods, soft goods
Guest bathrooms: conversion of 160 bathtubs to walk-in showers; case goods, soft goods
Public space: lobby; meeting space (mainly soft goods); and repositioning of F&B to include new Grab ‘N Go
Current lobby: Renovated lobby:
18 | (1) Park owns a 50% interest in the Hilton Santa Barbara Beachfront Resort; as such its pro-rata investment in the renovation was $7M.Future ROI Project: Bonnet Creek Meeting Space Addition
Bonnet Creek: Development Rights
Complex currently offers a combined 174,000 sq. ft. of
indoor and outdoor meeting space
Opportunity: Additional Meeting Space
Current plans call for the construction of ~92,000 gross sq.
ft. across 2 new meeting space platforms including:
~35,000 sq. ft. ballroom and ~10,000 sq. ft. of meeting
space adjacent to existing Hilton meeting space
complex
~9,000 sq. ft. ballroom adjacent to the Waldorf Astoria
Estimated $70M investment in ’18 -’20 expected to
generate an additional ~$13.5M of EBITDA/year once
stabilized
Proposed Hilton Ballroom
and meeting space
Proposed Waldorf Ballroom
19 |Capital Recycling Efforts Improve Portfolio Quality
Sales: 13 Hotels; $519M; $40M of EBITDA; 13.0x ’17 EBITDA (pre capex)
Transformation of the Park Portfolio Asset Sales:
2017(1) 2017 Pro-Forma(2)
# of Hotels 67 54
# of Rooms ~35,300 ~32,000
Adjusted EBITDA
Top 10 Hotels 65% 69% Hilton Durban
Top 25 Hotels 86% 91%
Consolidated Comparable Portfolio
Room RevPAR(1) $163 $169
(1) RevPAR excludes unconsolidated joint ventures
(2) 2017 Pro-Forma view excludes the 13 assets Park has sold in 2018
Overall capex savings of $156M Hilton Coylumbridge
Hilton Rotterdam Hilton Milton Keynes Embassy Suites San Rafael Marin County
20 |Strong and Flexible Balance Sheet
Debt Capital Structure Overview(1) Debt Maturity Schedule
$ % of Weighted Avg.
Debt
Amount Total Cost of Debt Fixed $1,437
CMBS (secured) $2,000 68% 4.2% Floating
Term Loan A (Unsecured) (2) 750 25% 3.3% $750 $725
Consolidated JV Debt 207 7% 4.1%
$12 $33
(secured)
Revolver(2) 0 0 3.4% 2018 2019 2020 2021 2022 2023 2024 2025 2026+
$236 million of unconsolidated JV debt (pro rata)
Total Debt $2,957 100% 4.0%
Liquidity Profile Fixed vs. Floating Net Debt to EBITDA(4)
Ample liquidity with $280 million of cash
available as of 3/31/18
Floating
43 unencumbered hotels, or 65% of Adjusted 25%
EBITDA(3)
In addition to cash, Park has access to an Fixed,
undrawn $1 billion revolving credit facility 75%
(1) As of 3/31/18. Figures exclude pro rata share of Unconsolidated JVs, unamortized deferred financing costs and discounts
Source: FactSet
(2) Term Loan A (L + 1.45%) and Revolver (L + 1.50%) as of 3/31/18
(3) For the trailing twelve months ended 3/31/18
21 | (4) Park’s 2018 EBITDA multiple assumes midpoint of EBITDA guidance ($730M) as of 5/3/18. See Appendix for definitions and reconciliations of these
measures to comparable GAAP measuresAttractive, Well Covered Dividend
Park’s Quarterly Dividends and Respective Yield(1,4) Peer REITs: Current Dividend Yield(3)
5.9%
Source: FactSet Source: FactSet
Dividend and Payout Ratio Analysis
On April 27th, Park declared a quarterly cash dividend of $0.43 per share to be paid on July 16th to stockholders of record as of
June 29th
In addition to the quarterly dividend, Park announced a special dividend following the sale of the Hilton Berlin on May 18th of
$0.45/share which will be paid on July 16th (to stockholders of record as of June 29th) in addition to the quarterly cash dividend
In 2017, Park paid a total of $1.84 in regular cash dividends, equating to a 6.4% dividend yield(2)
Targets 65% to 70% Adjusted Payout Ratio
(1) 4Q17 dividend includes a $0.12 per share ‘top-off’, which translated into an AFFO payout ratio of 67.5%.
(2) Based on 12/31/17 closing price of $28.75
(3) Based on 5/30/18 closing prices; For PK, the 5.5% yield assumes a quarterly dividend run-rate of $0.43/share, or $1.72 on an annualized basis, while the 5.9% yield includes the 4Q17 incremental top-off
dividend of $0.12/share, or $1.84/share on an annualized basis
22 | (4) Yield chart excludes the $0.45 per share special dividend yield announced on 5/18/18Brand Strategy Maximizes Revenue and Profitability
Brands Matter: Park will focus on owning hotels and resorts in the luxury and upper upscale segments
Benefits of Partnering with Brands
Consistent quality through a branded product should
allow Park to achieve higher RevPAR and margins as a
result of:
Worldwide
Group Sales
Recognizable product compared to independent hotels
struggling to differentiate their offerings
Worldwide reservation systems
Strong
Loyalty programs help to drive recurring sales, while RevPAR
lowering new customer acquisition costs Loyalty
Premiums
Programs
Hilton (~74mn members) and Marriott,
including Starwood (~100mn members), have
over 50% of sales stemming from customers
within loyalty programs
Ability to achieve increased direct-to-consumer sales
minimizing OTA / wholesale commissions and
increasing revenue to Park Effective Worldwide
Significantly lower distribution costs for OTA business Brand Reservation
given negotiating power of brands Segmentation Systems
More effective competition against Airbnb, particularly
with respect to frequent travelers who appreciate the
reliability and security of branded hotels
23 |Appendix
Hilton Sao Paulo
24 |Non-GAAP Financial Measures
Adjusted EBITDA Excluding Sold Hotels and Comparable Hotel Adjusted EBITDA
Year Ended Three Months Ended TTM
(unaudited, in millions) Decem ber 31, March 31, March 31,
2017 2018 2017 2018
Net income $ 2,631 $ 149 $ 2,350 430
Depreciation and amortization expense 288 70 70 288
Interest income (2) (1) — (3)
Interest expense 124 31 30 125
Income tax benefit (2,346) — (2,281) (65)
Interest expense, income tax and depreciation and amortization included in
equity in earnings from investments in affiliates 24 7 5 26
EBITDA 719 256 174 801
Gain on sales of assets, net (1) (89) — (90)
Loss (gain) on foreign currency transactions 4 (1) (1) 4
Transition expense 9 2 1 10
Transaction expense 2 — — 2
Severance expense 1 — — 1
Share-based compensation expense 14 4 3 15
Casualty and impairment loss, net 26 — — 26
Impairment loss included in equity in earnings from investments in affiliates — — — —
Other items (17) 2 — (15)
Adjusted EBITDA 757 174 177 754
Less: Adjusted EBITDA from hotels disposed of 40 3 5 38
Adjusted EBITDA excluding sold hotels 717 171 172 716
Less: Adjusted EBITDA from investments in affiliates 38 11 8 41
Less: All other(1) (46) (12) (12) (46)
Hotel Adjusted EBITDA excluding sold hotels 725 172 176 721
Less: Adjusted EBITDA from non-comparable hotels 43 13 16 40
Comparable Hotel Adjusted EBITDA(2) $ 682 $ 159 $ 160 $ 681
(1) Includes other revenue and other expense, non-income taxes on REIT leases and corporate general and administrative expense.
(2) Based on Park’s comparable hotels as of 3/31/18.
25 |Non-GAAP Financial Measures (cont’d)
TTM Comparable Hotel Adjusted EBITDA Margin
Year Ended Three Months Ended TTM
December 31, March 31, March 31,
2017 2018 2017 2018
Total Revenues $ 2,791 $ 668 $ 684 $ 2,775
Less: Other revenue 64 17 13 68
Less: Revenues from hotels disposed of 131 17 26 122
Less: Revenues from non-comparable hotels (1) 181 44 57 168
Comparable Hotel Revenues(2) $ 2,415 $ 590 $ 588 $ 2,417
TTM
March 31,
2018
Comparable Hotel Revenues $ 2,417
Comparable Hotel Adjusted EBITDA 681
Comparable Hotel Adjusted EBITDA margin 28.2%
(1) Includes revenues from Park’s non-comparable hotels, excluding hotels disposed of, and rental revenues from office space and antenna rent leases.
(2) Based on Park’s comparable hotels as of 3/31/18.
Net Debt and Net Debt to Adjusted EBITDA Ratio
(unaudited, in millions)
March 31, 2018
Debt $ 2,946
Add: unamortized deferred financing costs 11
Long-term debt, including current maturities and excluding
unamortized deferred financing costs 2,957
Add: Park's share of unconsolidated affiliates debt,
excluding unamortized deferred financing costs 236
Less: cash and cash equivalents (172)
Less: restricted cash (108)
Debt, net $ 2,913
Adjusted EBITDA (1) $ 730
Net debt to Adjusted EBITDA ratio 4.0x
(1) Based on the mid-point of Park’s 2018 Adjusted EBITDA guidance.
26 |Guidance
EBITDA and Adjusted EBITDA
Year Ending
(unaudited, in millions) Decem ber 31, 2018
Low Case High Case
Net income $ 336 $ 369
Depreciation and amortization expense 283 283
Interest income (4) (4)
Interest expense 125 128
Income tax expense 12 16
Interest expense, income tax and depreciation and amortization included in equity
in earnings from investments in affiliates 24 24
EBITDA 776 816
Loss on foreign currency transactions — —
Transition expense 6 6
Share-based compensation expense 16 16
Casualty loss, net — —
Gain on sale of assets, net (89) (89)
Other items 1 1
Adjusted EBITDA $ 710 $ 750
27 |Definitions
EBITDA, Adjusted EBITDA, Hotel Adjusted EBITDA and Hotel Adjusted EBITDA Margin
Earnings before interest expense, taxes and depreciation and amortization (“EBITDA”), presented herein, reflects net income excluding depreciation and amortization, interest income, interest
expense, income taxes and interest expense, income tax and depreciation and amortization included in equity in earnings from investments in affiliates.
Adjusted EBITDA, presented herein, is calculated as EBITDA, as previously defined, further adjusted to exclude:
• Gains or losses on sales of assets for both consolidated and unconsolidated investments;
• Gains or losses on foreign currency transactions;
• Transition expense related to the Company’s establishment as an independent, publicly traded company;
• Transaction expense associated with the potential disposition of hotels or acquisition of a business;
• Severance expense;
• Share-based compensation expense;
• Casualty and impairment losses; and
• Other items that management believes are not representative of the Company’s current or future operating performance.
Hotel Adjusted EBITDA measures hotel-level results before debt service, depreciation and corporate expenses of the Company’s consolidated hotels, including both comparable and non-comparable
hotels but excluding hotels owned by unconsolidated affiliates, and is a key measure of the Company’s profitability. The Company presents Hotel Adjusted EBITDA to help the Company and its
investors evaluate the ongoing operating performance of the Company’s consolidated hotels.
Hotel Adjusted EBITDA margin is calculated as Hotel Adjusted EBITDA divided by total hotel revenue.
Comparable Hotels
The Company presents certain data for its consolidated hotels on a comparable hotel basis as supplemental information for investors. The Company defines its comparable hotels as those hotels
that: (i) were active and operating in the Company’s portfolio since January 1st of the previous year; and (ii) have not sustained substantial property damage, business interruption, undergone large-
scale capital projects or for which comparable results are not available. The Company presents comparable hotel results to help the Company and its investors evaluate the ongoing operating
performance of its comparable hotels. Of the 46 hotels that are consolidated as of March 31, 2018, 44 hotels have been classified as comparable hotels. Due to the conversion, or planned
conversions, of a significant number of rooms at the Hilton Waikoloa Village in 2017 to HGV timeshare units, and due to the effects of the hurricane at the Caribe Hilton in Puerto Rico and the
expected continued effects from business interruption in 2018, the results from these properties were excluded from comparable hotels. The Company’s comparable hotels also exclude the 12 hotels
that were sold in January and February 2018.
Net Debt
Net debt, presented herein, is a non-GAAP financial measure that the Company uses to evaluate its financial leverage. Net debt is calculated as (i) long-term debt, including current maturities and
excluding unamortized deferred financing costs; and (ii) the Company’s share of investments in affiliate debt, excluding unamortized deferred financing costs; reduced by (a) cash and cash
equivalents; and (b) restricted cash and cash equivalents.
The Company believes Net debt provides useful information about its indebtedness to investors as it is frequently used by securities analysts, investors and other interested parties to compare the
indebtedness of companies. Net debt should not be considered as a substitute to debt presented in accordance with U.S. GAAP. Net debt may not be comparable to a similarly titled measure of other
companies.
Net Debt to Adjusted EBITDA Ratio
Net debt to Adjusted EBITDA ratio, presented herein, is a non-GAAP financial measure and is included as it is frequently used by securities analysts, investors and other interested parties to compare
the financial condition of companies. Net debt to Adjusted EBITDA ratio should not be considered as an alternative to measures of financial condition derived in accordance with U.S. GAAP and it
may not be comparable to a similarly titled measure of other companies.
* Please see Park’s periodic filings with the SEC for additional definitions
28 |About Park and Safe Harbor Disclosure About Park Hotels & Resorts Inc. Park (NYSE: PK) is a leading lodging real estate company with a diverse portfolio of market-leading hotels and resorts with significant underlying real estate value. Park’s portfolio consists of 54 premium-branded hotels and resorts with over 32,000 rooms, a majority of which are located in prime U.S. markets with high barriers to entry. Visit www.pkhotelsandresorts.com for more information. Forward-Looking Statements This presentation contains forward-looking statements within the meaning of Section 27A of the Securities Act of 1933, as amended, and Section 21E of the Securities Exchange Act of 1934, as amended. Forward-looking statements include, but are not limited to, statements related to Park’s current expectations regarding the performance of its business, financial results, liquidity and capital resources, the effects of competition and the effects of future legislation or regulations, the expected completion of anticipated acquisitions and dispositions, the declaration and payment of future dividends and other non-historical statements. Forward-looking statements include all statements that are not historical facts and, in some cases, can be identified by the use of forward-looking terminology such as the words “outlook,” “believes,” “expects,” “potential,” “continues,” “may,” “will,” “should,” “could,” “seeks,” “projects,” “predicts,” “intends,” “plans,” “estimates,” “anticipates” or the negative version of these words or other comparable words. Forward-looking statements involve risks, uncertainties and assumptions. Actual results may differ materially from those expressed in these forward-looking statements. You should not put undue reliance on any forward-looking statements in this presentation and Park urges investors to carefully review the disclosures Park makes concerning risk and uncertainties in Item 1A: “Risk Factors” in Park’s Annual Report on Form 10-K for the year ended December 31, 2017, as such factors may be updated from time to time in Park’s periodic filings with the SEC, which are accessible on the SEC’s website at www.sec.gov. Except as required by law, Park undertakes no obligation to update or revise publicly any forward-looking statements, whether as a result of new information, future events or otherwise. Supplemental Financial Information Park refers to certain non-generally accepted accounting principles (“GAAP”) financial measures in this presentation, including Earnings before interest expense, taxes and depreciation and amortization (“EBITDA”), Adjusted EBITDA, Hotel Adjusted EBITDA, Hotel Adjusted EBITDA margin, Net debt and Net debt to Adjusted EBITDA ratio. These non-GAAP financial measures should be considered along with, but not as alternatives to, net income (loss) as a measure of its operating performance. Please see the schedules included in this presentation including the “Definitions” section for additional information and reconciliations of such non-GAAP financial measures. 29 |
You can also read