FY20 Half Year Results - This slide must be copied from pre-formatted slide to retain the lines and logo - Fastly
←
→
Page content transcription
If your browser does not render page correctly, please read the page content below
FY20 Half Year Results
5 December 2019

   Championing Successful Independents
  This slide must be copied from pre-formatted slide to retain the lines and logo.
Group update and
    divisional results

    Jeff Adams
    Group Chief Executive Officer

1   1H20 Half Year Results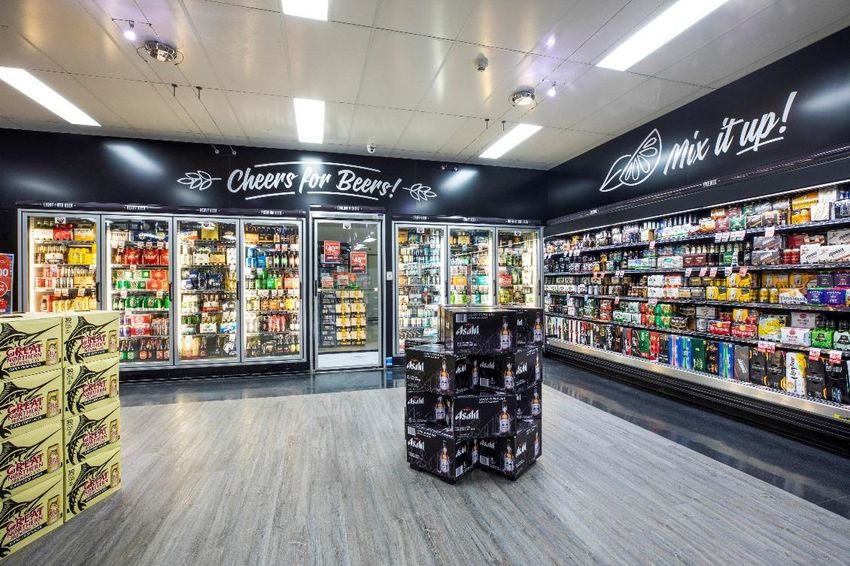
Our purpose      Our vision                         Our values

                               Best store in town              We believe:
    Championing                                                Independence is worth fighting
                                                               for; in treating our people,
    Successful                 Passionate about independents
                                                               retailers and suppliers the way
                                                               we like to be treated; and in
    Independents               A favourite place to work       giving back to the communities
                                                               where we live and work

                               Business partner of choice

                               Support thriving communities

2
2   1H20
    1H20 Half
         Half Year
              Year Results
                   Results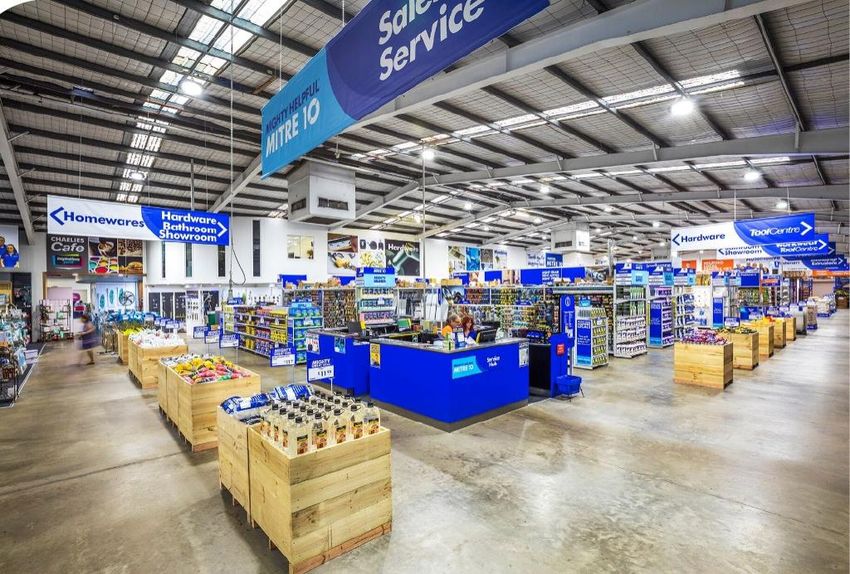
Group overview
Group highlights:
Total Food pillar sales (including charge-through) increased 1.2%, with Supermarkets wholesale
sales ex tobacco being positive1 for the first time since FY12
Liquor delivered its sixth consecutive year of earnings growth
Our Trade-focused Hardware pillar continued to perform well despite difficult trading conditions
MFuture programs progressing across all pillars
Statutory results for 1H20 reflect adoption of the new Accounting Standard AASB16 Leases.
Prior period comparatives not restated for impact of AASB16. To enable comparison, the results
for 1H20 have been adjusted, where appropriate, to exclude the impact of AASB16
Group sales (including charge-through sales) increased 0.5% to $7.2bn, reflecting sales growth
in the Food and Liquor pillars, partly offset by a decline in Hardware sales
Reported loss after tax of $151.6m includes an impairment of $237.4m (post tax) following the
loss of the 7-Eleven contract (1H19 Pre AASB16: Reported profit after tax of $95.8m)
Underlying profit after tax (pre AASB16) was $95.7m (1H19: $100.3m)2
Contribution from resolution of onerous lease obligations ~$10m higher in 1H19
Ceasing to supply Drakes in SA from 30 September 2019
1. Metcash ceased supply to Drakes in SA from 30 September 2019. Sales growth has been calculated by removing Drakes sales from the prior period (1 October 2018 to 31 October 2018).
2. In 1H20 underlying profit after tax excludes MFuture restructure costs of $4.8m (post tax) and asset impairment of $237.4m (post tax). In 1H19 underlying profit after tax excludes
Working Smarter restructure costs of $4.5m (post tax).
3 1H20 Half Year Results
Group overview continued
Group underlying EBIT (pre AASB16) declined by $8.4m to $149.7m
Food EBIT decreased by $7.8m to $85.2m – contribution from resolution of onerous leases
higher in 1H19 and ceasing to supply Drakes from 30 September 2019
Liquor EBIT increased by $0.5m to $29.6m – flow through from higher sales
Hardware EBIT decreased by $0.5m to $37.3m – impacted by lower Trade sales
Corporate EBIT was -$2.4m (1H19: -$1.8m)
Underlying EPS (pre AASB16) declined by 0.9% to 10.5 cents
Operating cash flows lower than 1H19 reflecting increased investment in working capital
Strong balance sheet
Interim dividend of 6.0 cents per share, fully franked
4 1H20 Half Year Results
Results overview by pillar
                                                                                    1H20          1H19     Change
                                                                                      $m            $m          %
                                                                                                                          Sales revenue (%)
    Sales revenue (including charge-through sales)                                                                   (including charge-through)
    Food                                                                          4,381.1       4,330.9      1.2%
    Liquor                                                                        1,784.2       1,753.9      1.7%            14%
    Hardware                                                                      1,044.2       1,089.6     (4.2%)                                Food
    Total sales revenue (including charge-through sales)                          7,209.5       7,174.4      0.5%      25%          61%           Liquor
    Less: Charge-through sales                                                     (919.7)       (985.2)    (6.6%)                                Hardware
    Total sales revenue (Statutory Accounts)                                      6,289.8       6,189.2      1.6%

                                                                                     1H20          1H19
                                                                               Pre AASB16    Pre AASB16    Change
                                                                                       $m            $m         %
    Underlying EBIT
    Food                                                                             85.2          93.0     (8.4%)
                                                                                                                       Underlying EBIT (%)
    Liquor                                                                           29.6          29.1      1.7%
    Hardware                                                                         37.3          37.8     (1.3%)
    Business Pillars                                                                152.1         159.9     (4.9%)        25%
                                                                                                                                                  Food
    Corporate                                                                        (2.4)         (1.8)   (33.3%)                  56%           Liquor
    Total underlying EBIT (pre AASB16)                                              149.7         158.1     (5.3%)      19%                       Hardware
    Add: AASB16        adjustment1                                                    6.0              -
    Total EBIT (Statutory Accounts)                                                 155.7         158.1

    1. An analysis of AASB16 adjustments by Pillar is shown in the Appendix.

5   1H20 Half Year Results
Food – sales
Food 1H20 1H19 Change
$m $m %
Total Food sales (including charge-through) increased 1.2% to $4.4bn (1H19: $4.3bn)
Food
Supermarkets
Supermarkets revenue (including charge-through) 3,596.5 3,568.0 0.8%
Total sales (including charge-through) increased 0.8% to $3.6bn (+1.2% ex Drakes impact1)
Charge-through sales (472.2) (470.8) 0.3%
Wholesale sales (ex tobacco) improved from -1.9% in 1H19 to -0.3% in 1H20 (+0.3% ex
1 Supermarkets revenue (excluding charge-through) 3,124.3 3,097.2 0.9%
Drakes impact )
Sales improvement supported by successful execution of growth initiatives and a reduction Convenience revenue 784.6 762.9 2.8%
2
in price deflation to -0.1% (1H19: -1.3%) despite continued price investment in ‘Winning Total revenue as per Statutory Accounts 3,908.9 3,860.1 1.3%
Range’
Wholesale sales trajectory improved in all states Wholesale sales (ex tobacco)
Qld was the strongest performing state
2.0%
Sales growth in SA (ex Drakes impact1) with Foodland stores performing well
1.0%
Significant improvement in WA sales trajectory, with sales now broadly in line with 1H19 0.3%
0.0%
IGA retail LfL3 sales growth of +0.4% (1H19: -0.2%)
Rate of decline (%)
-1.3% -0.3%
-1.0% -1.9%
Net IGA store closures of 10 (9 openings, 19 closures). Net store openings expected in 2H20 -2.0% -4.4%
-3.8% -3.5%
Teamwork score increased to ~74% (1H19: ~72%) -3.0%
Continued improvement in retailer and supplier satisfaction scores -4.0%
-5.0%
Convenience
-6.0%
Total sales increased 2.8% to $784.6m due to sales growth from larger customers, mainly 2H17 1H18 2H18 1H19 1 2H19 1H20
higher tobacco sales As reported Excluding Drakes (SA)
1. Metcash ceased to supply Drakes in SA from 30 September 2019. Sales growth has been calculated by removing Drakes sales from the prior period (1 October 2018 to 31 October 2018).
2. Excludes tobacco and produce.
3. Scan data from 1,093 IGA stores.
6 1H20 Half Year Results
Food – EBIT
1H20 1H19 Change
Food $m $m %
Reported EBIT of $88.4m includes a positive AASB16 adjustment of $3.2m Total revenue1 (including charge-through) 4,381.1 4,330.9 1.2%
EBIT (pre AASB16) declined $7.8m (-8.4%) to $85.2m mainly due to: EBIT (Statutory Accounts) 88.4 93.0 (4.9%)
A ~$10m decline in the EBIT contribution from the resolution of onerous lease Less: AASB16 adjustment (3.2) — —
obligations; and EBIT (Pre AASB16) 85.2 93.0 (8.4%)
Ceasing to supply Drakes from 30 September 2019 (~$1.5m) EBIT margin² 1.9% 2.1% (20bps)
Partly offset by:
Improved wholesale sales (ex tobacco);
Cost savings which more than offset the impact of inflation;
Improved earnings from joint ventures and corporate stores; and
A positive contribution from the Convenience business.
1. Total revenue includes charge-through sales of $472.2m (1H19: $470.8m).
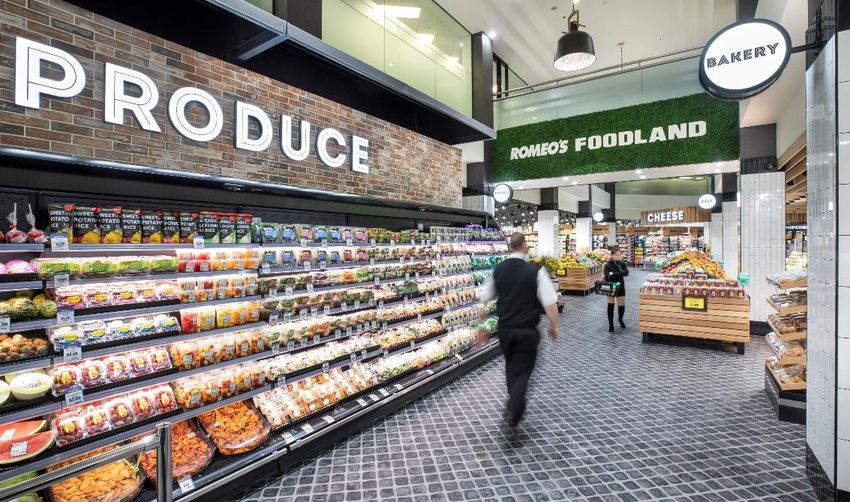
2. EBIT margin: EBIT (pre AASB16) / Total revenue (including charge-through sales). New DSA store: Romeo’s Foodland, Rundle Mall, SA
7 1H20 Half Year Results
Food – MFuture initiatives
Brand Clarity Diamond Store Accelerator Small format offer Community Co Systems & Logistics
Three year re-branding program Program accelerated through Trial of next generation IGA A further ~70 products added, Automated charge-through now
(right brand, right offer, right location) process simplification and Xpress stores bringing total products in trading
Enforced standards to protect funding assistance option Focus on Fresh including meal Community Co private label IGA rewards being rolled out to all
integrity of brand and better pricing A further 45 stores completed solutions, while also catering for range to ~350 states following successful trials in
for retailers that comply with the program (1H19: 9 stores) with full grocery shop New products include: specialty WA and QLD
promotional programs an additional 36 in progress Each store offer tailored for local cheeses, gluten free biscuits, New tailored promotional platforms
Retailer engagement delivering strong Brings total stores through the demographic value added meats, dishwashing to be available 1H21 supporting the
products and an expanded range
support. Working closely with program to ~450 Trial stores opened at Bondi, Brand Clarity initiative
of eggs and fresh ready meals
National Retail Council Average retail sales growth of NSW (May 2019), Chatswood, Partnership with Australia Post to
Branding of large format store ~15%. Sales improvement post NSW (Oct 2019) and North Community Co sales increased help create Australia’s largest collect
(SupaValue). First trial store to open in upgrade maintained Sydney, NSW (Nov 2019). Trial ~50% over 1H19 & return network
NSW in 2H20 DSA program integral component delivering significant learnings for Community Co Tomato Sauce Supermarkets and Convenience
Branding of small format store of brand strategy broader network was determined the best tomato logistics networks integrated
complete (The Fresh Pantry by IGA) Trial to be completed by end of sauce by CHOICE
Construction of new DC in SA
and trial underway FY20 progressing with completion
Focus now on core IGA brand expected in the 3rd quarter of 2020
Focus is on further improving competitiveness of retailer network
8 1H20 Half Year Results
Liquor – sales
1H20 1H19 Change
Total sales (including charge-through) increased 1.7% to $1.8bn $m $m %
‘Premiumisation’ trend continued to drive value growth Total revenue as per Statutory Accounts 1,781.0 1,749.9 1.8%
LfL sales to IBA network increased 1.7% (1H19: 2.0%) supported by continued Charge-through sales 3.2 4.0 (20.0%)
investment in the network Total revenue (including charge-through) 1,784.2 1,753.9 1.7%
Increase in wholesale sales to contract customers and non-bannered stores
Growth in customer base
Increase in ‘on-premise’ sales
Proportion of sales through the IBA bannered network in line with last year at 54%
National rollout of Porters Liquor gaining momentum
WA Container Deposit Scheme to commence June 2020. Will result in schemes
being in place in all states other than Victoria and Tasmania
IGA Liquor store, Strathfieldsaye, VIC
9 1H20 Half Year ResultsLiquor – EBIT
1H20 1H19 Change
Reported EBIT of $30.7m includes a positive AASB16 adjustment of $1.1m $m $m %
EBIT (pre AASB16) increased $0.5m (1.7%) to $29.6m Total revenue1 (including charge-through) 1,784.2 1,753.9 1.7%
EBIT (Statutory Accounts) 30.7 29.1 5.5%
The contribution from increased sales more than offset an increase in costs
Less: AASB16 adjustment (1.1) — —
EBIT margin2 maintained at 1.7%
EBIT (Pre AASB16) 29.6 29.1 1.7%
EBIT margin² 1.7% 1.7% —
1. Total revenue includes charge-through sales of $3.2m (1H19: $4.0m).
2. EBIT margin: EBIT (pre AASB16) / Total revenue (including charge-through). New Porters Liquor store: North Narrabeen, NSW
10 1H20 Half Year ResultsLiquor – MFuture initiatives
Store Investment Porters expansion Private & exclusive labels On-premise Digital
Continuation of ‘Best Store in Three-year national roll-out Expansion of the private label Significant opportunity to Strategic focus on accelerating
Town’ initiatives including program to grow share of range continued to be a priority address historical under-indexing opportunities through digital
investment to further improve the premium/higher value market to help leverage the in ‘on-premise’ market capability
quality of the store network and Total stores in network at end of ‘premiumisation’ trend Launched ALM Agora, an online E-Commerce platform to be
shopper experience 1H20 increased to 25, mostly in Additional SKUs were added market place that connects ‘on- trialled in Porters network in 2H20
There were 36 stores ‘refreshed’ in NSW across the wine, beer and spirit premise’ venues directly with Establishment of loyalty program
the half, bringing total stores New stores at Balmain East and categories in the half. There suppliers. Good support from being accelerated. Significant
through the program to ~370 Glebe NSW, and first Victorian were a total of ~90 SKUs in the suppliers engagement and support for
Cool rooms continued to be store opened at Moonee Ponds category at the end of 1H20 Addition of new customers and retailer network
upgraded with investment in a Expansion into WA and TAS Sales of private label wine channel specific supply Preparation completed for pilot
further 29 stores resulting in a total planned for 2H20 continued to grow, increasing agreements supported sales store trial of integrated POS
of ~640 upgrades at the end of ~20% on 1H19. Private label wine growth of ~10% in 1H20
1H20
Total of 10 stores expected to be
accounts for ~5% of total IBA
system
added to Porters network in 2H20
wine sales and provides a
Commenced program with
7 stores completed a ‘refresh’ significant growth opportunity
Complexica to incorporate artificial
program in 1H20 intelligence into promotional
platforms
Prioritising growth opportunities in private & exclusive label, on-premise and digital
11 1H20 Half Year ResultsHardware – sales
1H20 1H19 Change
• Total sales (including charge-through) decreased 4.2% to $1.04bn, mainly $m $m %
reflecting the impact of the slowdown in construction on Trade sales Total revenue as per Statutory Accounts 599.9 579.2 3.6%
• Excluding the loss of a large HTH customer in QLD in 1H19, total sales Charge-through sales 444.3 510.4 (13.0%)
decreased 2.5% Total revenue (including charge-through) 1,044.2 1,089.6 (4.2%)
• Total wholesale LfL sales to IHG banner group decreased 2.6%1
• LfL retail sales in IHG banner group decreased 3.2%2
• Trade sales account for 64% of total sales (1H19: 65%)
• Decline in Trade sales was partly offset by an improvement in DIY sales
supported by an acceleration of the Sapphire program, core range and
expansion of the digital platform
1. Includes sales to independent retailers and company-owned stores.
2. Based on a sample of 190 network stores that provide scan data (represents >50% of sales). Recent Sapphire store: Mitre 10 Mackay, QLD
12 1H20 Half Year ResultsHardware – EBIT
1H20 1H19 Change
Reported EBIT of $38.9m includes a positive AASB16 adjustment of $1.6m $m $m %
EBIT (pre AASB16) decreased by $0.5m to $37.3m Total revenue 1 (including charge-through) 1,044.2 1,089.6 (4.2%)
EBIT (Statutory Accounts) 38.9 37.8 2.9%
Impact of decline in Trade sales, partly offset by:
Less: AASB16 adjustment (1.6) — —
Contribution from improved DIY sales
EBIT (Pre AASB16) 37.3 37.8 (1.3%)
Cost efficiencies (supply chain and overheads); and
EBIT margin² 3.6% 3.5% 10bps
Full synergy benefits from HTH acquisition
IHG wholesale sales margin of 2.9%
Total IHG EBIT margin increased 10bps to 3.6% (1H19: 3.5%) reflecting an
increase in the proportion of retail sales (additional JV/company-owned stores)
1. Total revenue includes charge-through sales of $444.3m (1H19: $510.4m).
2. EBIT margin: EBIT (pre AASB16) / Total revenue (including charge-through). Recent Sapphire store: TM&H Mitre 10 MOE, VIC
13 1H20 Half Year ResultsHardware – MFuture initiatives
Sapphire program Build Trade Grow Retail network Digital & Trade technology Cost efficiencies
Delivers modern leading edge Potential to leverage IHG network Retail joint venture/company- Customer uptake continuing to Strong focus on all costs in
stores to grow supply of house build owned network increased to 102 grow response to slowdown in
Total stores through the program from 30% to 70% through ‘Whole (1H19: 92) (37 company-owned/ Online sales up ~50% over 1H19 construction activity
and in progress increased to 75 of House’ strategy 65 JV stores) Significant increase in SKUs Further rationalisation of DC
Targeting ~200 stores to be Acquired two Frame and Truss Additions include Keith Timber in available online to ~11,300 (FY19: network with closure of NSW DC
upgraded by 2022 plants through acquisition of SA (5 stores), Portland HTH VIC ~3,000) Cost resets in JV/company-
Strong average retail sales growth Keith Timber in SA. Frame and and St George QLD Loyalty members up 4% to ~1m owned stores most exposed to
of >15% Truss offer now available in all Acquired existing minority Strong growth in retailer uptake of slowdown
states interest in G.Gay & Co in VIC (3 Labor cost management
IHG contribution up to 50% Truck Tracker, Trade Online and
(between $50k - $200k depending Increased number of supply and stores) Trade+ supporting our Trade initiatives
on store size) install alliances to 15. Alliances in Company-owned/JV stores business
place with key players across all represent ~15% of total stores
stages of a house build
Expanded trial of ‘Connected
and ~40% of total IHG sales Home’ to 15 stores. New digital
Continued rollout of Hardings technology offer to access, manage
through IHG network and monitor homes
IHG remains well positioned as the second largest player in the market
14 1H20 Half Year ResultsFinancials
Brad Soller
Group Chief Financial Officer
15 1H20 Half Year ResultsAASB16 Leases
Metcash adopted AASB16 on 1 May 2019 which has resulted in the recognition of ‘right of use’ assets, lease receivables and lease liabilities.
Balance Sheet
• Recognition of ‘right of use’ asset, sublease receivable and offsetting liability
• Initial asset value of $936.8m (includes ‘right of use’ assets of $601.5m and sublease receivable of $335.3m)
• Initial liability of $939.1m (includes both Metcash occupied properties and back to back retail lease obligations)
Profit and Loss
• The new standard results in a 1H20 increase in EBIT of $6m and an increase in EBITDA of $55.4m
• This is offset by higher depreciation of $49.4m and net finance costs of $13.2m
• The impact on Net Profit After Tax in 1H20 was to reduce profit by $5.1m
Cashflows
• No impact on net cashflows
• Increase in reported operating cashflows offset by higher investing and financing cashflows
Comparatives
The prior comparative half has not been restated in the statutory accounts
Further details are contained in Appendix B of the 1H20 statutory financial report
16 1H20 Half Year ResultsAsset impairment
7-Eleven contract
• Metcash announced on 22 November 2019 that 7-Eleven will not be renewing the current supply agreement when it concludes on 12 August 2020
• Metcash determined that it could not meet 7-Eleven’s supply requirements on an economic basis
• Discussions with 7-Eleven are continuing in relation to supply in Western Australia and a number of smaller categories on the east coast
• Total annualised sales to 7-Eleven are ~$800m and comprise predominantly lower-margin tobacco sales
• Estimated annualised EBIT impact of ~$15m from 12 August 2020, after adjusting for mitigating cost savings
Impairment of goodwill and other assets
• Assessment of carrying value of assets is regularly undertaken as part the accounts preparation process
• Change to assumptions concerning future cash flows following the advice from 7-Eleven
• An impairment of goodwill and other assets in the Food pillar of $237.4m (post tax) has been recognised in the 1H20 accounts
• In accordance with Australian Accounting Standards, the carrying value of goodwill cannot take into account future mitigating cost savings
• The impairment is non-cash in nature and has no impact on debt facilities or compliance with banking covenants
17 1H20 Half Year ResultsProfit & Loss
1H20 1H20 1H19 Change
(Post AASB16) (Pre AASB16) (Pre AASB16) (Pre AASB16)
$m $m $m %
Sales revenue 6,289.8 6,289.8 6,189.2 1.6%
EBITDA 234.7 179.3 186.2 (3.7%)
Depreciation and amortisation (79.0) (29.6) (28.1) 5.3%
EBIT 155.7 149.7 158.1 (5.3%)
Net finance costs (27.0) (13.8) (14.5) 4.8%
Profit before tax and NCI 128.7 135.9 143.6 (5.4%)
Tax (37.6) (39.7) (42.5) 6.6%
Non-controlling interests (0.5) (0.5) (0.8) 37.5%
Underlying profit after tax 90.6 95.7 100.3 (4.6%)
MFuture restructure costs (post tax) (4.8) (4.8) —
Working Smarter restructure costs and HTH integration costs (post tax) — — (4.5)
Impairment of goodwill and other assets (post tax) (237.4) (237.4) —
Reported (loss)/profit after tax (151.6) (146.5) 95.8
EPS based on underlying profit after tax 10.0c 10.5c 10.6c (0.9%)
ROFE1 26.1% N/A 22.3% N/A
1. ROFE based on underlying EBIT and the average of opening and closing funds employed.
18 1H20 Half Year ResultsCashflows
1H20 1H20 1H19
(Post AASB16) (Pre AASB16) (Pre AASB16)
$m $m $m
Net cash from operating activities 88.8 59.3 120.3
Net cash used in investing activities (29.8) (51.2) (26.8)
Capital expenditure (30.5) (30.5) (24.7)
Acquisitions of businesses (23.2) (23.2) (3.4)
Proceeds from sale of businesses/assets and net loan movements 2.5 2.5 1.3
Receipts from subleases 21.4 - -
Dividends paid (63.6) (63.6) (68.3)
Payments for lease liabilities (50.9) - -
Other financing activities (4.3) (4.3) (0.9)
Off-market share buy-back - - (150.3)
Increase in net debt (59.8) (59.8) (126.0)
Cash realisation ratio (CRR) 1 52.4% 47.3% 93.7%
AASB16 has no impact on net cashflows but does require significant reclassifications. Comparatives are on a pre AASB16 basis
Operating cashflows in 1H20 reflect increased investment in working capital in the half
Capital expenditure broadly in line with depreciation and amortisation (pre AASB16). MFuture capital expenditure weighted to 2H20 and FY21
The outflow from acquisitions of businesses relates to acquisitions in the Hardware pillar
1. Cash realisation ratio (CRR) = Cash flow from operations/underlying NPATDA (depreciation and amortisation not tax effected).
19 1H20 Half Year ResultsBalance Sheet
31 October 2019 30 April 20191 31 October 20181
(Post AASB16) (Pre AASB16) (Pre AASB16)
$m $m $m
Trade receivables and prepayments 1,526.2 1,472.5 1,492.5
Inventories 1,061.0 779.3 916.2
Trade payables and provisions (2,333.6) (2,051.5) (2,218.6)
Net working capital 253.6 200.3 190.1
Intangible assets 586.4 793.5 792.3
Property, plant and equipment 204.9 218.0 208.3
Equity accounted investments 78.4 87.7 88.6
Customer loans and assets held for resale 61.2 48.2 49.8
Capital investments 930.9 1,147.4 1,139.0
Total funds employed 1,184.5 1,347.7 1,329.1
Lease receivables 288.1 - -
‘Right of use’ assets 517.2 7.8 7.9
Lease provisions (71.6) (159.0) (151.7)
Lease liabilities (904.5) (7.4) (7.4)
Lease balances (170.8) (158.6) (151.2)
Net debt (95.3) (35.5) (77.8)
Tax, put options and derivatives 110.4 96.5 112.7
Net Assets / Equity 1,028.8 1,250.1 1,212.8
1. The Group revised the presentation of lease balances on its Balance Sheet upon adoption of AASB16. Comparative information has been reclassified to align with the current presentation.
20 1H20 Half Year ResultsNet debt
Net debt of $95.3m (FY19: $35.5m) 1H20 FY19
$m $m
Average net debt of ~$368m (FY19: ~$310m)
Net debt1
Average tenor of debt 2.4 years
Gross debt (218.5) (178.1)
Balanced debt maturity profile
Cash and cash equivalents 123.2 142.6
No debt maturities until FY21 Net debt (95.3) (35.5)
Debt metrics and ratios
Current Debt Maturity Profile
Weighted average debt maturity 2.4 years 2.9 years
250
Weighted average cost of debt2 3.1% 3.4%
200
% Fixed debt 47% 50%
150
Interest coverage3 25.4x 25.2x
$m
100 Gearing ratio4 8.5% 2.8%
50 Underlying EBITDAR coverage5 3.6x 3.8x
Gross debt coverage6 0.6x 0.5x
0
FY21 FY22 FY23 FY24 FY25
1. The Group revised the presentation of Net debt on its Balance Sheet upon adoption of AASB16. Net debt
Syndicated Facility Working capital excludes all liabilities related to AASB16 and lease liabilities. Finance lease obligations which were
previously classified as net debt are now separately disclosed as Lease Liabilities on the Balance Sheet
under the new standard (FY19: $7.4m).
2. Weighted average cost of debt over the period (excludes line fees).
3. Underlying EBITDA/Net Interest Expense (pre AASB16; on a 12-month rolling basis).
4. Net Debt/(Shareholders’ Equity + Net Debt).
5. Underlying EBITDAR/(Net Interest Expense + Net Rent Expense) (pre AASB16; on a 12-month rolling basis).
6. Gross Debt/Underlying EBITDA (pre AASB16; on a 12-month rolling basis).
21 1H20 Half Year ResultsDividends
FY20 interim dividend
6.0 cents per share, fully franked
Ex-dividend date: 17 December 2019
Record date: 18 December 2019
Payment date: 23 January 2020
Dividend payout ratio of ~60% of underlying earnings per share
22 1H20 Half Year ResultsGroup Outlook
Jeff Adams
Group Chief Executive Officer
23 1H20 Half Year ResultsGroup outlook
The growth in Supermarkets wholesale sales ex tobacco reported in 1H20 has continued in the first five weeks of 2H20, excluding the impact of Drakes
Supermarkets sales in 2H20 will, however, be negatively impacted by ceasing to supply Drakes in South Australia
While the Group will continue to look for opportunities to exit onerous lease contracts the contribution to profit in future periods is expected to reduce
Food
A continued focus on costs is expected to help offset the impact of cost inflation over the remainder of FY20
We expect market growth over the remainder of FY20 to continue to be influenced by the ‘premiumisation’ trend (higher quality but lower consumption)
The business is continuing to progress its growth initiatives under the MFuture program with opportunities in private and exclusive label, the ‘on-premise’
Liquor market and digital being prioritised under the new Liquor CEO
Trade sales over the remainder of FY20 are expected to continue to be impacted by the slowdown in construction activity
Our non-trade sales are expected to be less impacted than Trade sales due to the level of DIY activity and acceleration of the Sapphire store upgrade program
The business continues to have a strong focus on costs to help offset the impact of the slowdown in construction activity
Hardware The medium to long-term market fundamentals remain positive with construction activity expected to be underpinned by population growth and an
undersupply of housing
24 1H20 Half Year ResultsAppendices
1. Financial history
2. AASB16 reconciliation
3. Bannered store numbers
25 1H20 Half Year Results1. Financial history
1H20 1H20 1H191 1H181 1H171 1H161
(Post AASB16) (Pre AASB16) (Pre AASB16) (Pre AASB16) (Pre AASB16) (Pre AASB16)
Financial Performance
Sales revenue ($m) 6,289.8 6,289.8 6,189.2 6,054.8 5,743.7 5,698.5
EBIT ($m) 155.7 149.7 158.1 156.3 132.1 140.7
Net finance costs ($m) (27.0) (13.8) (14.5) (15.2) (16.9) (19.8)
Underlying profit after tax ($m) 90.6 95.7 100.3 99.1 82.8 86.9
Reported (loss)/profit after tax ($m) (151.6) (146.5) 95.8 93.0 74.9 122.0
Operating cash flows ($m) 88.8 59.3 120.3 161.4 130.6 3.1
Cash realisation ratio (%) 2 52.4% 47.3% 93.7% 127.3% 114.2% 2.6%
Financial Position
Shareholder’s equity ($m) 1,028.8 N/A 1,212.8 1,633.9 1,538.4 1,275.2
Net (debt)/cash ($m) (95.3) N/A (77.8) 19.9 (189.7) (425.9)
Gearing ratio ³ (%) 8.5% N/A 6.0% (1.2%) 11.0% 25.0%
Return on funds employed 4 (%) 26.1% N/A 22.3% 18.8% 15.3% 13.4%
Share Statistics
Fully paid ordinary shares 909.3 909.3 909.3 975.6 975.6 928.4
Weighted average ordinary shares 909.3 909.3 947.9 975.6 941.3 928.4
Underlying earnings per share (cents) 10.0 10.5 10.6 10.2 8.8 9.4
Reported (loss)/earnings per share (cents) (16.7) (16.1) 10.1 9.5 8.0 13.1
Dividends declared per share (cents) 6.0 6.0 6.5 6.0 – –
1. Other than 1H20, no prior periods have been restated for the impact of AASB16.
2. Cash flows from operations / Underlying NPAT + Depreciation and Amortisation (depreciation and amortisation not tax effected)
3. Net Debt / (Shareholders’ Equity + Net Debt)
4. Underlying EBIT / Average funds employed
26 1H20 Half Year Results2. Impact of AASB16 – Profit & Loss
1H20
AASB16
Pre AASB16 adjustment¹ Post AASB16
$m $m $m
Food 85.2 3.2 88.4
Liquor 29.6 1.1 30.7
Hardware 37.3 1.6 38.9
Total Pillar EBIT 152.1 5.9 158.0
Corporate (2.4) 0.1 (2.3)
Total underlying EBIT 149.7 6.0 155.7
Net finance costs (13.8) (13.2) (27.0)
Tax (39.7) 2.1 (37.6)
Non-controlling interest (0.5) – (0.5)
Underlying profit after tax 95.7 (5.1) 90.6
1H20
$m
Total underlying EBIT pre AASB16 149.7
Add: Net rent 59.1
Less: Depreciation of ‘Right of Use’ assets (49.4)
Less: Other movements (3.7)
Total underlying EBIT post AASB16 155.7
1. Details relating to the change are included in Appendix B of the 1H20 statutory financial report.
27 1H20 Half Year Results2. Impact of AASB16 – Balance Sheet
30 April 2019 AASB16 AASB16 1 May 2019
(As reported) reclassifications adjustments (Post transition)
$m $m $m $m
Trade receivables and prepayments 1,472.5 - - 1,472.5
Inventories 779.3 - - 779.3
Trade payables and provisions (2,210.5) 159.0 - (2,051.5)
Net working capital 41.3 159.0 - 200.3
Intangible assets 793.5 - - 793.5
Property, plant and equipment 225.8 (7.8) - 218.0
Equity accounted investments 87.7 - - 87.7
Customer loans and assets held for resale 48.2 - - 48.2
Capital investments 1,155.2 (7.8) - 1,147.4
Total funds employed 1,196.5 151.2 - 1,347.7
Lease receivables - - 316.0 316.0
‘Right of use’ assets - 7.8 546.7 554.5
Lease provisions - (159.0) 74.1 (84.9)
Lease liabilities - (7.4) (939.1) (946.5)
Lease balances - (158.6) (2.3) (160.9)
Net debt (42.9) 7.4 - (35.5)
Tax, put options and derivatives 96.5 - 0.7 97.2
Net Assets / Equity 1,250.1 - (1.6) 1,248.5
28 1H20 Half Year Results3. Bannered store numbers
October April
2019 2019
Pillar
Supermarkets 1,623 1,673
Campbells 16 17
Liquor 2,699 2,667
Hardware 653 668
Total 4,991 5,025
Supermarkets Campbells Liquor Hardware Total
Store movement
Number of stores at April 2019 1,673 17 2,667 668 5,025
Stores opened / joined banner group during the period 29 - 262 2 293
Stores closed / left banner group during the period (79) (1) (230) (17) (327)
Number of stores at October 2019 1,623 16 2,699 653 4,991
29 1H20 Half Year Results3. Bannered store numbers
October April
2019 2019
Supermarkets
Supa IGA 362 373
IGA 753 792
IGA-Xpress 222 220
Total IGA bannered stores 1,337 1,385
Friendly Grocer / Eziway 286 288
Total Supermarkets 1,623 1,673
Liquor
Cellarbrations 566 557
Bottle-O & Bottle-O Neighbourhood 244 237
IGA Liquor 469 467
Porters 25 22
Thirsty Camel (NSW/ACT, QLD, TAS, SA/NT) 153 150
Big Bargain 48 54
Other 1,194 1,180
Total Liquor 2,699 2,667
Hardware
Mitre 10 306 308
Home Timber & Hardware and related brands 288 300
True Value Hardware 59 60
Total Hardware 653 668
30 1H20 Half Year ResultsDisclaimer
This presentation contains summary information about Metcash Limited (ABN 32 112 073 480) (Metcash) and its activities current as at the date of this presentation. The information in this presentation is of general background and does
not purport to be complete. It should be read in conjunction with Metcash’s other periodic and continuous disclosure announcements filed with the Australian Securities Exchange, which are available at www.asx.com.au.
This presentation is for information purposes only and is not a prospectus or product disclosure statement, financial product or investment advice or a recommendation to acquire Metcash shares or other securities. It has been prepared
without taking into account the objectives, financial situation or needs of individuals. Before making an investment decision, prospective investors should consider the appropriateness of the information having regard to their own
objectives, financial situation and needs and seek legal and taxation advice appropriate to their jurisdiction. Metcash is not licensed to provide financial product advice in respect of Metcash shares or other securities. Past performance is no
guarantee of future performance.
No representation or warranty, expressed or implied, is made as to the fairness, accuracy, completeness or correctness of the information, opinions and conclusions contained in this presentation. To the maximum extent permitted by law,
none of Metcash and its related bodies corporate, or their respective directors, employees or agents, nor any other person accepts liability for any loss arising from the use of this presentation or its contents or otherwise arising in
connection with it, including, without limitation, any liability from fault or negligence on the part of Metcash, its related bodies corporate, or any of their respective directors, employees or agents.
This presentation may contain forward-looking statements including statements regarding our intent, belief or current expectations with respect to Metcash’s business and operations, market conditions, results of operations and financial
condition, specific provisions and risk management practices. When used in this presentation, the words “likely”, “estimate”, “project”, “intend”, “forecast”, “anticipate” ,”believe”, “expect”, “may”, “aim”, “should”, “potential” and similar
expressions, as they relate to Metcash and its management, are intended to identify forward-looking statements. Forward looking statements involve known and unknown risks, uncertainties and assumptions and other important factors
that could cause the actual results, performance or achievements of Metcash to be materially different from future results, performance or achievements expressed or implied by such statements. Readers are cautioned not to place undue
reliance on these forward-looking statements, which speak only as of the date thereof.
Contact details
For additional information contact:
Steve Ashe
Head of Corporate Affairs & Investor Relations
Phone: +61 408 164 011
E-mail: steve.ashe@metcash.com
Charmaine Lim
Investor Relations Manager
Phone: +61 427 219 871
Email: charmaine.lim@metcash.com
Visit our website: www.metcash.com
31 1H20 Half Year ResultsChampioning Successful Independents
You can also read


