Q2 2021 Results August 4, 2021 - 2023 CADILLAC LYRIQ - GM Investor Relations website
←
→
Page content transcription
If your browser does not render page correctly, please read the page content below

Q2 2021 Results
   August 4, 2021

                    2023 CADILLAC LYRIQ
Information Relevant to This Presentation
Cautionary Note on Forward-Looking Statements: This presentation and related comments by management may include “forward-looking statements” within the
meaning of the U.S. federal securities laws. Forward-looking statements are any statements other than statements of historical fact. Forward-looking statements
represent our current judgement about possible future events and are often identified by words such as “aim”, “anticipate,” “appears,” “approximately,” “believe,”
“continue,” “could,” “designed,” “effect,” “estimate,” “evaluate,” “expect,” “forecast,” “goal,” “initiative,” “intend,” “may,” “objective,” “outlook,” “plan,” “potential,”
“priorities,” “project,” “pursue,” “seek,” “should,” “target,” “when,” “will,” “would,” or the negative of any of those words or similar expressions. In making these
statements we rely upon assumptions and analysis based on our experience and perception of historical trends, current conditions and expected future developments, as
well as other factors we consider appropriate under the circumstances. We believe these judgements are reasonable, but these statements are not guarantees of any
future events or financial results, and our actual results may differ materially due to a variety of important factors, many of which are described in our Annual report on
Form 10-K and our other filings with the Securities and Exchange Commission. We caution readers not to place undue reliance on forward-looking statements. Forward-
Looking statements speak only as of the date they are made, and we undertake no obligation to update publicly or otherwise revise any forward-looking statements,
whether as a result of new information, future events or other factors that affect the subject of these statements, except where we are expressly required to do so by law.

Non-GAAP Financial Measures: See our most recent Annual Report on Form 10-K and our other filings with the Securities and Exchange Commission for a description of
certain non-GAAP measures used in this presentation, including EBIT-adjusted, EPS-diluted-adjusted, ETR-adjusted, ROIC-adjusted and adjusted automotive free cash
flow, along with a description of various uses for such measures. This presentation also includes GMF’s return on tangible common equity, which is used by GMF’s
management and can be used by investors to measure GMF’s contribution to GM’s enterprise profitability and cash flow. Return on average tangible common equity is
calculated as GMF’s net income attributable to common shareholder for the trailing four quarters divided by GMF’s average tangible common equity for the same period.
Our calculation of these non-GAAP measures are set forth within these reports and the Select Supplemental Financial Information section of this presentation and may
not be comparable to similarly titled measures of other companies due to potential differences between companies in the method of calculation. As a result, the use of
these non-GAAP measures has limitations and should not be considered superior to, in isolation from, or as a substitute for, related U.S. GAAP measures. When we
present our total company EBIT-adjusted, GMF is presented on EBT-adjusted basis.

Additional Information: In this presentation and related comments by management, references to “record” or “best” performance (or similar statements) refer to General
Motors Company, as established in 2009 on a continuing operations basis. In addition, certain figures included in the charts and tables in this presentation may not sum
due to rounding.

                                                                                                                                                                               2
Generate Profitable Growth
  As we execute our vision of zero crashes, zero emissions and zero congestion

                ALL-IN AND INVESTING TO LEAD
                                                                            STRONG AND GROWING FRANCHISES
                THE FUTURE OF MOBILITY

> $35B allocated to EV & AV investment through 2025          > Leading full-size pickup & full-size SUV market share
> EV franchise goals                                         > Leveraging our heritage, iconic brands and industry-leading
      > #1 EV market share in North America                    customer loyalty

      > Margins similar to or higher than ICE                > OnStar, Super Cruise and other connected services will
                                                               drive recurring revenue growth and differentiation
      > Selling 1M+ vehicles globally by 2025
                                                             > Internally generated cash is funding electric vehicles,
> Committed to safely deploying self-driving technology at     autonomous vehicles, and other growth opportunities
  scale through GM’s majority-owned subsidiary Cruise

              100+ YEARS IN CORE COMPETENCIES                               DISCIPLINED CAPITAL ALLOCATION

> Customer knowledge, leading design and engineering         > The top priority is to invest in new and existing businesses,
> Vehicle validation, safety and testing                       including CapEx of $9 - $10B this year to accelerate growth
                                                               opportunities, as well as other initiatives
> World-class manufacturing and design capabilities
                                                             > Sustaining investment grade balance sheet and long-term
> Building new core competencies in software as a service      shareholder returns
  and transportation of people and goods as a service

                                                                                                                               3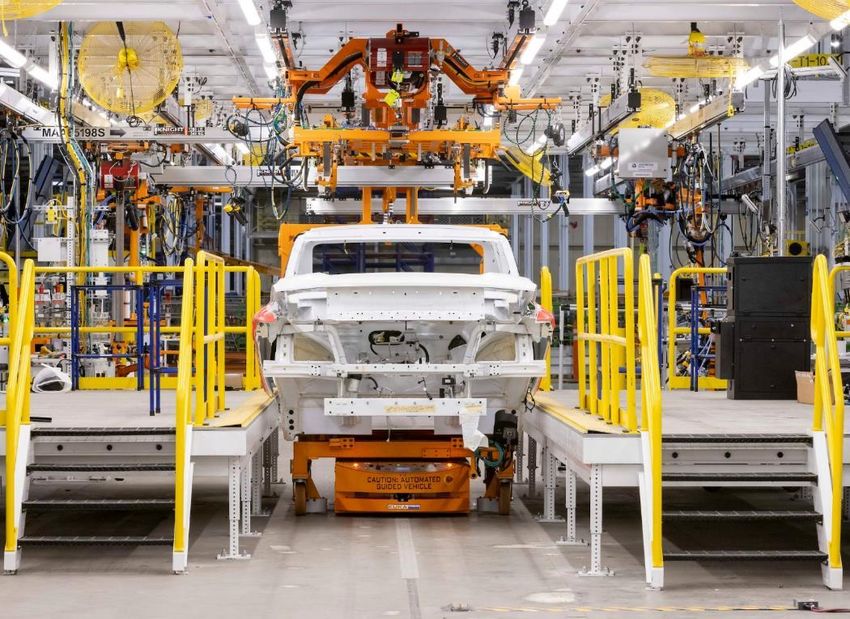
Our Business Future Is Deeply Rooted in Our ESG Values

             ENVIRONMENTAL                                           SOCIAL                                      GOVERNANCE

> Plan to be carbon neutral in our global          > Ambition to be the world’s most inclusive     > Diverse and independent Board - 12 directors
  products and operations by 2040                    company - committed to use the power            of which 7 are women and 11 are independent
                                                     of our voice to advocate internally and
> Our emission reduction targets approved by         externally for a future with equity and       > ESG performance factored as part of each
  the Science Based Targets Initiative (SBTi)        inclusion for all                               named executive officer’s strategic goals,
  are aligned with the Paris Agreement                                                               which impacts the executive’s short-term
                                                   > Publicly released our federal equal             incentive compensation
> Aspire to eliminate tailpipe emissions for new     employment opportunity report starting
  light-duty vehicles by 2035                        in 2021                                       > Supported and continue to support public
                                                                                                     policies that drive the achievement of our
> Goal to source 100% of power from renewable      > Recently created a new Climate Equity           long-term sustainable growth
  sources by 2035, and by 2030 in the U.S.           Fund, dedicated to helping close equity
> Committed to reduce operational water              gaps in the transition to electric vehicles
  intensity by 35% by 2035 against a 2010            and other sustainable technology
  baseline

                            For more information on our progress, initiatives and commitments as we
                                  transform our industry, see our 2020 Sustainability Report:
                                            https://www.gmsustainability.com/                                                                       4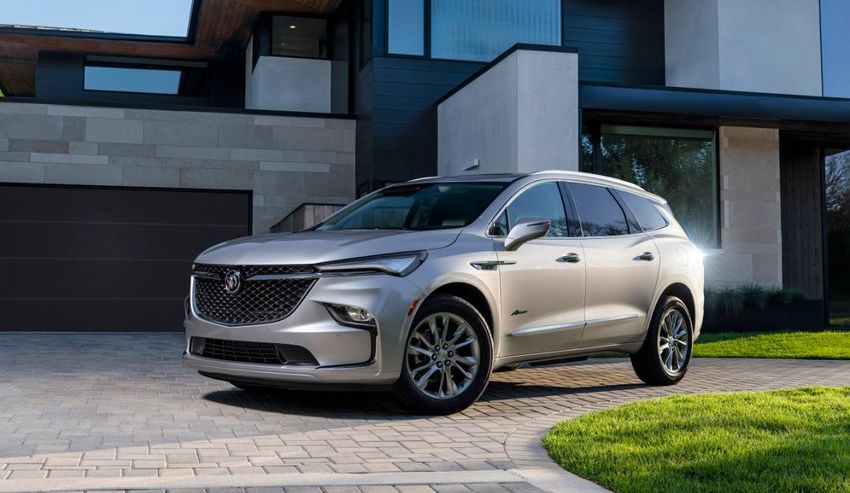
$35 Billion EV and AV Investment
                                  From 2020 through 2025

                                                                     Cruise
                                                                   Engineering

Incremental investment from $27B to $35B to      Battery-Related                 EV & Battery

                                                                   $35B
                                                  Capital Spend                  Engineering
accelerate battery and EV assembly capacity
and ensure GM leads in all aspects of the
transformation to a more sustainable future                        Allocation

                                                             EV/AV & Manufacturing
                                                                 Capital Spend

                                                                                                5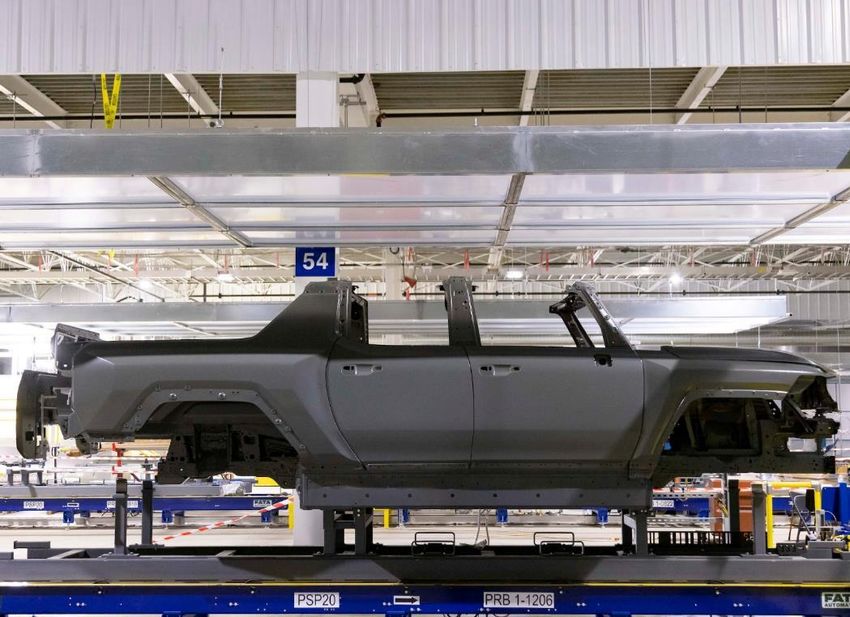
Growth Opportunities and Initiatives

Super Cruise                                                         OnStar Guardian

> Select models of the                                               > OnStar Guardian
  2022 GMC Sierra, and                                                 subscribers and family
  post-launch, the 2022                                                members can access
  Cadillac Escalade and                                                critical OnStar safety
  GMC HUMMER EV, will                                                  services from their
  include the capability to                                            compatible phones,
  trailer a boat, camper,                                              whether they are at home,
  and more while driving                                               out walking, or traveling in
  hands free on                                                        any vehicle
  compatible roads

HYDROTEC                                                             Ultium Charge 360

> GM continues to                                                    > Announced a
  collaborate on                                                       comprehensive EV fleet
  developing solutions                                                 charging solution
  leveraging HYDROTEC                                                  designed to make the
  Fuel Cell technology in                                              switch to electric
  transportation and                                                   seamless for fleet and
  other industries                                                     BrightDrop customers by
                                                                       connecting them with
                                                                       services, features and
                                                                       resources

                                                                                                  6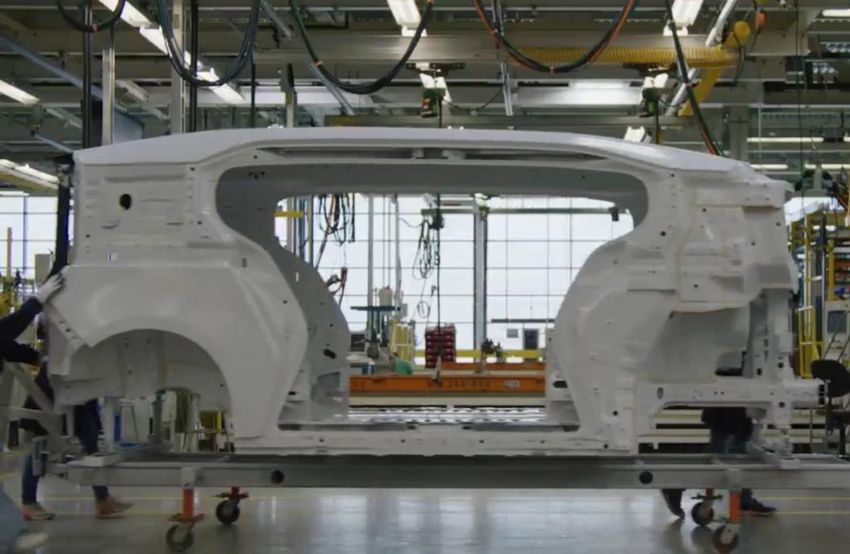
Growth Opportunities and Initiatives

                     Cruise
                    > Cruise continues to make excellent progress toward launching its
                      first fully driverless commercial service
                    > GM remains a major accelerator of Cruise's mission, with the
                      purpose-built Origin giving Cruise a huge competitive advantage

                     BrightDrop
                    > Synergies created by GM’s design, engineering, manufacturing and
                      sourcing expertise are driving rapid growth at BrightDrop, a new
                      business that is pioneering connected and electrified first-to-last
                      mile delivery solutions
                    > To meet expected demand, we are pulling forward the transition of
                      our CAMI Assembly plant in Canada from building gas-powered
                      vehicles to assembling the BrightDrop EV600

                                                                                            7
Pre-production GMC HUMMER EV Pickup at Factory Zero

GM is completing the transformation at Factory ZERO to our flagship EV assembly plant that will build the GMC
 HUMMER EV, Cruise Origin, and electric versions of Chevrolet and GMC full-size pickups beginning this fall
                                                                                                                8
Construction at Ultium Cells LLC battery cell manufacturing facility in Lordstown, Ohio

GM has announced plans to build two new battery cell manufacturing
   plants in addition to the two Ultium plants under construction
                                                                                            9
Financial
Information

              2022 GMC Canyon AT4

                                    10
Second Quarter Performance
EPS-DILUTED-ADJ. ADJ. AUTO FREE CASH FLOW EPS-DILUTED-ADJ.; EBIT-ADJ. & MARGIN
> Higher primarily due to the non-recurrence
of the 2020 production stoppage as a result
of the pandemic, strong pricing on full-size
$2.5B Adj. Auto pickups and full-size SUVs and high used
$1.97 Free Cash Flow vehicle prices, partially offset by increased
warranty, material and commodity costs
$11.5B YOY
($0.50) > EPS-diluted-adjusted includes $0.122 impact
Q2-20 Q2-21 from revaluation on equity investments in
Q2 2021 and $0.083 in Q2 2020
ADJ. AUTO FREE CASH FLOW
EBIT-ADJ. & EBIT-ADJ. MARGIN
1 1 SHARE & DELIVERIES > Higher primarily due to non-recurrence of
the 2020 production stoppage as a result of
the pandemic and strong EBIT performance
12.0%
SHARE & DELIVERIES
$4.1 10.0% > GMNA: Market share decreased primarily
(3.2)% due to tight retail inventory
Market Share (90)bps YOY
($0.5) 1.8M
Q2-20 Q2-21 Deliveries +0.3M YOY
1 See slide 28 and 30 for description of special items.
2 Includes investments in Stellantis (formerly known as PSA), Lordstown Motors and Proterra. 11
3 Includes investments in Stellantis and Lyft. GM liquidated our remaining shares in Lyft, Inc. in the six months ended June 30, 2020.Second Quarter EBIT -adjusted
In $B
Q2-2020 Q2-2021
$4.1
$2.9
$1.6
$0.0 $0.2
($0.1) ($0.3) ($0.2) ($0.3) ($0.2) ($0.0)
($0.5)
GMNA GMI GM Financial Cruise Corp/Elims Total Company
STRONG RESULTS AS WE MANAGE THROUGH
THE FLUID SEMICONDUCTOR ENVIRONMENT
12Second Quarter EBIT -adjusted Performance
In $B
GM Financial: $1.3
FX: $0.3
Other Investments: $0.11
GMNA: 311k
GMI: 28k
VOLUME / MIX COST
> GMNA: Increased volume due to the non-recurrence of the > GMNA: Increased due to non-recurrence of the 2020 austerity
2020 production stoppage as a result of the pandemic and actions and production stoppage as a result of the pandemic,
higher mix due to prioritization of full-size pickup and full-size warranty expenses, commodity prices, material costs related to
SUV production as a result of the semiconductor shortage recent launches and higher engineering spend to accelerate our
PRICE EV portfolio
> GMNA: Increased primarily due to strong pricing and demand OTHER
for our full-size pickups and full-size SUVs in a tight inventory > GMF: Increase due to high used vehicle prices, strong credit
environment performance and the impact of the pandemic on Q2 2020
provision expense
> GMNA: Increased due the strengthening of the Canadian Dollar
1 Includes
revaluations on GM investments in Stellantis, Lordstown Motors, Proterra and Lyft; GM liquidated our remaining shares in Lyft, Inc. in the six months ended
13
June 30, 2020.GMNA Performance
NET REVENUE ($B) EBIT-ADJ. ($B)
799 802 15.0%
664 642
8.7% 12.1% 10.4%
331
$11.6
$29.1 $30.2 $26.0 $27.9 (0.9)% $4.4 $2.6 $3.1 $2.9
+14%
- YOY U.S. RETAIL ATP INCREASE
Q2-20 Q3-20 Q4-20 Q1-21 Q2-21
-
($0.1) -
Q2-20 Q3-20 Q4-20 Q1-21 Q2-21
Wholesales (000'S)
EBIT-Adj. Margin +351%
YOY U.S. RETAIL SALES GAIN IN
COMBINED CHEVROLET BOLT EV
U.S. DEALER INVENTORY (000’S)1 U.S. EV SALES (000’S)
AND BOLT EUV
9.3% 9.7%
444 492 7.2% 8.1% 8.2% COMMITED TO ACHIEVING #1 EV
411
335 MARKET SHARE IN NORTH
212 AMERICA
9.0 11.3
5.7 6.7
2.5
Q2-20 Q3-20 Q4-20 Q1-21 Q2-21 Q2-20 Q3-20 Q4-20 Q1-21 Q2-21
2
GM's Share of the U.S. EV Market
1 Amounts as of quarter end.
2 GM
14
estimates.GMI Performance – Excluding GM China JV
NET REVENUE ($B) EBIT-ADJ. ($B)
$0.0 $0.0
$3.9
$3.1 ($0.3) ($0.3)
$2.7 $2.8
-
($0.4) 0.9% 0.0% -
- -
$1.7 -
-
(9.2)% (9.3)% -
-
Q2-20 Q3-20 Q4-20 Q1-21 Q2-21
-
- (26.2)% -
Q2-20 Q3-20 Q4-20 Q1-21 Q2-21
WHOLESALES (000’s) EBIT-Adj. margin from GMI ex. China EI
216 Q2 2021 HIGHLIGHTS
166 157
118 > EBIT-Adj. up YOY primarily due to strong mix and pricing
90
actions partially offset by semiconductor headwinds,
commodity costs and warranty expenses
Q2-20 Q3-20 Q4-20 Q1-21 Q2-21
15GM China Auto JV Performance
NET REVENUE ($B)1 EQUITY INCOME ($B)2
$14.1 5.9%
$11.0 $9.9 6.1% 4.9% 3.5% 5.9%
$9.2 $9.0
$0.3 $0.2 $0.3 $0.3
$0.2 -
-
Q2-20 Q3-20 Q4-20 Q1-21 Q2-21 Q2-20 Q3-20 Q4-20 Q1-21 Q2-21
Total China Auto JV NI/Rev
WHOLESALES (000’s)1
Q2 2021 HIGHLIGHTS
1,106
> Results slightly above our forecasted ~$0.2B quarterly run-
848
733 675 rate driven by strong mix, stabilization in pricing, and material
620
performance partially offset by semiconductor and
commodity headwinds
> Received a $0.6B3 dividend from our China automotive JVs in
Q2 2021
Q2-20 Q3-20 Q4-20 Q1-21 Q2-21
> Wuling MINI EV continued to be the top selling EV in China
1 China Auto JV Net Revenue and Wholesales not consolidated in GM financial results.
2 China Auto JV pro-rata share of earnings reported as equity income. 16
3 Dividends net of withholding tax.($B) Q2 H1
Financial Performance 2021 2020 2021 2020
Revenue1 0.0 0.0 0.1 0.1
EBIT-adjusted (0.3) (0.2) (0.6) (0.4)
Cash used in operating activities (0.3) (0.2) (0.5) (0.4)
GM IS NOW ASSEMBLING PRE-PRODUCTION CRUISE ORIGIN
VEHICLES FOR VALIDATION TESTING
GM FINANCIAL WILL PROVIDE CRUISE A $5B LINE OF CREDIT
TO FUND THE PURCHASE OF AVs FROM GM – BRINGING
CRUISE’S TOTAL LIQUIDITY TO MORE THAN $10B2 AS IT
ENTERS COMMERCIALIZATION
1 Primarilyreclassified to Interest income and other non-operating income, net in our condensed consolidated income statements in the three and six months ended
June 30, 2021 and 2020.
2 Includes $3.9B in cash, cash equivalents and marketable debt securities designated exclusively for the use of Cruise, $5.2B multi-year line of credit from GM Financial
17
and Softbank’s $1.35B obligation to purchase additional Cruise convertible shares when Cruise’s AVs are ready for commercial deployment.EBT-ADJUSTED ($B) ENDING EARNING ASSETS ($B)
35.5%
27.3% 53.0%
16.4% 20.5% 43.8%
42.6% 41.1% 43.1%
12.1% $1.6
$1.0 $1.2
$0.2 $1.2 $94.0 $96.5 $100.2 $100.8 $102.7
Q2-20 Q3-20 Q4-20 Q1-21 Q2-21
Q2-20 Q3-20 Q4-20 Q1-21 Q2-21
Return on Average Tangible Common Equity
GMF as % of GM U.S. Retail Sales (units)
LIQUIDITY ($B)
9.38x Q2 2021 HIGHLIGHTS
8.38x 8.00x 7.94x 7.66x > Paid $0.6B dividend to GM in the quarter, $1.2B cumulative
paid YTD
$28.1 $26.6 $29.2 $28.0 > ROTCE exceeds low-to-mid teens target due to recent
$24.0
earnings performance
> Sufficient capital and ample liquidity to support earning
Q2-20 Q3-20 Q4-20 Q1-21 Q2-21 asset growth and navigate economic cycles
Leverage Ratio
Note: Ending earning assets includes outstanding loans to dealers that are controlled and consolidated by GM in connection with our commercial lending program and
direct-finance leases from other GM subsidiaries. Return on average tangible common equity is defined as net income attributable to common shareholder for the 18
trailing four quarters divided by average tangible common equity for the same period. Liquidity excludes $1.0B GM Junior Subordinated Revolving Credit Facility.Adjusted Automotive Free Cash Flow
Q2 H1
($B) 2021 2020 2021 2020
Net Income (loss) 2.8 (0.8) 5.8 (0.5)
Income tax and net automotive interest expense 1.2 0.1 2.6 0.6
EBIT adjustments1 0.1 0.1 0.1 0.6
EBIT-Adjusted (loss) 4.1 (0.5) 8.5 0.7
GMF EBT-Adjusted (1.6) (0.2) (2.8) (0.5)
Cruise EBIT Loss-Adjusted 0.3 0.2 0.6 0.4
Automotive EBIT (loss)-Adjusted 2.9 (0.6) 6.3 0.7
Depreciation, amortization and impairments2 1.4 1.3 2.8 2.6
Pension / OPEB activities (0.6) (0.4) (1.2) (0.8)
Working Capital2 0.1 (5.1) (3.2) (5.9)
Accrued and other liabilities2 (0.4) (3.7) (2.7) (5.3)
Undistributed earnings of nonconsolidated affiliates 0.4 0.4 0.1 0.5
Interest and tax payments (0.6) (0.5) (0.6) (0.5)
Other2 0.8 0.5 1.4 1.1
Automotive net cash provided by (used in) operating activities 4.0 (8.0) 2.9 (7.7)
Capital expenditures (1.5) (1.1) (2.4) (2.3)
GMI restructuring - 0.1 0.0 0.1
Cadillac dealer strategy 0.0 - 0.0 -
Brazil indirect tax recoveries - - - (0.1)
Adjusted automotive free cash flow 2.5 (9.0) 0.5 (9.9)
1 See slide 28 for description of special items.
2 Excludes
19
EBIT adjustments.Automotive Liquidity and Debt
AUTOMOTIVE LIQUIDITY ($B) TOTAL AUTOMOTIVE DEBT ($B)
$40.5 $17.5 $17.3
$38.0
$18.2 $17.2
$17.5 $17.3
$22.3 $20.9
Dec 31, 2020 Jun 30, 2021 Dec 31, 2020 Jun 30, 2021
Available Credit Facilities
Senior Unsecured Notes and Other
Cash, Cash Equivalents and Marketable Debt Securities
Liquidity position remains strong
20Updated Full -Year Guidance
Current Prior
EBIT-ADJ. $11.5B - $13.5B $10.0B - $11.0B
EPS-DILUTED-ADJ. $5.40 - $6.40 $4.50 - $5.25
ADJ. AUTO FREE CASH FLOW $1.0B - $2.0B $1.0B - $2.0B
H2 VS. H1 EBIT-ADJ. KEY VARIANCE DRIVERS CURRENT GUIDANCE
> Decreased volumes of ~100K units in GMNA > The semiconductor shortage remains fluid and supply
> $1.5B-$2.0B increased commodity costs chain challenges continue in H2
> $1.0-$1.5B GM Financial: expect lower lease termination > Due to this uncertainty, our guidance assumes no year
volume and record high purchase rates capping gains at end work-in-process inventory related to vehicles
contract residual value, H1 allowance adjustments we produced without modules1
assume will not repeat and credit starting to normalize > Significant cash flows could shift from 2021 to 2022 if we
> $0.5B investments in growth initiatives have work-in-process vehicles produced without modules
held at year end
> $0.4B mark-to-market gains on equity investments in H1
we assume will not repeat
1 The value of the vehicles produced without modules held in inventory was approximately $1.4B at June 30, 2021. 21Summary
Q2 2021 RESULTS WHAT’S TO COME
> Generating consistently strong earnings despite > Focus on profitable growth opportunities and new revenue
industry-wide challenges, including record EBIT- streams
adjusted of $4.1 billion in the second quarter, and $8.5
billion in the first half > Developing a full EV portfolio that doesn’t depend on partial
solutions like hybrids and “electrified” ICE vehicles
> Results highlight the strength of our full-size pickup and
full-size SUV franchises, which we plan to leverage as we > Prioritizing speed to market as we launch more than 30 new
roll out our EV portfolio EVs in North America and China by 2025
> Results better than originally expected due to strong > Our upcoming EV launches including our GMC HUMMER EV
pricing and demand, record GM Financial results and and Cadillac LYRIQ are on track, and the construction in
improved near-term production from the pull forward of Lordstown, Factory ZERO, and Spring Hill is progressing with
semiconductors from the third quarter no delays
> October 6th-7th: plan to share additional insight into our EV &
AV strategy and growth opportunities, including software and
services and product and technology demonstrations
22Select Supplemental
Financial Information
2022 Buick Enclave
23Q2-2021 GAAP Results
(in $B except where noted) Q2 H1
F/(U) F/(U)
2021 2021
vs. 2020 vs. 2020
Net revenue 34.2 17.4 66.6 17.2
Operating income 2.9 4.1 6.2 6.7
Net income attributed to stockholders 2.8 3.6 5.9 6.3
EPS-diluted ($/share) $1.90 $2.46 $3.93 $4.32
Net cash provided by operating activities 7.2 10.0 8.4 9.7
24Regional Q2 EBIT -adjusted Performance
($B) GMNA ($B) GMI
YTD 2021 $2.1 $1.3 $3.6 $3.7 $(5.0) $0.4 $6.0 $(0.8) $(0.0) $0.4 $0.4 $(0.3) $0.6 $0.3
25Global Deliveries
(000's)
Q2 2021 Q1 2021 Q4 2020 Q3 2020 Q2 2020
North America 794 746 875 765 565
U.S. 688 642 771 665 492
Asia/Pacific, Middle East and Africa 875 880 1,082 903 845
China 751 780 954 771 714
South America 88 118 159 122 57
Brazil 50 75 115 88 40
Global Deliveries – in GM Markets 1,757 1,744 2,116 1,790 1,467
26Global Market Share
Q2 2021 Q1 2021 Q4 2020 Q3 2020 Q2 2020
North America 14.8% 15.7% 17.3% 15.9% 16.0%
U.S. 15.2% 16.0% 18.0% 16.6% 16.3%
Asia/Pacific, Middle East and Africa 7.7% 7.4% 8.3% 7.9% 8.8%
China 11.3% 11.7% 12.1% 11.5% 11.2%
South America 9.8% 13.3% 15.2% 14.3% 14.5%
Brazil 9.1% 14.2% 16.9% 15.6% 15.8%
Global Market Share - in GM Markets 10.0% 9.9% 11.0% 10.5% 10.9%
27Reconciliation of EBIT -adjusted
($B) Q2 Q1 Q4 Q3
2021 2020 2021 2020 2020 2019 2020 2019
Net income (loss) attributable to stockholders 2.8 (0.8) 3.0 0.3 2.8 (0.2) 4.0 2.4
Income tax expense (benefit) 1.0 (0.1) 1.2 0.4 0.6 (0.2) 0.9 0.3
Automotive interest expense 0.2 0.3 0.3 0.2 0.3 0.2 0.3 0.2
Automotive interest income (0.0) (0.1) (0.0) (0.1) (0.0) (0.1) (0.1) (0.1)
Adjustments
GM Korea wage litigation1 0.1 — — — — — — —
Cadillac dealer strategy2 0.0 — — — 0.1 — — —
GMI restructuring3 — 0.1 — 0.5 0.0 — 0.1 —
Ignition switch recall and related legal matters4 — — — — (0.1) — — —
Transformation activities5 — — — — — 0.2 — 0.4
FAW-GM divestiture6 — — — — — 0.2 — —
Brazil indirect tax recoveries7 — — — — — — — (0.1)
Total adjustments 0.1 0.1 — 0.5 (0.0) 0.4 0.1 0.3
EBIT (loss)-adjusted 4.1 (0.5) 4.4 1.2 3.7 0.1 5.3 3.0
1This adjustment was excluded because of the unique events associated with recent Supreme Court of Korea decisions related to our salaried workers.
2These adjustments were excluded because they relate to strategic activities to transition certain Cadillac dealers from the network as part of Cadillac's electric vehicle strategy.
3These adjustments were excluded because of a strategic decision to rationalize our core operations by exiting or significantly reducing our presence in various international markets to focus
resources on opportunities expected to deliver higher returns. These adjustments primarily consist of inventory provisions in the three months ended June 30, 2020, asset impairments,
dealer restructurings, employee separation charges and sales allowances in Australia, New Zealand and Thailand in the three months ended March 31, 2020, employee separation charges in
the three months ended December 31, 2020, and supplier claims in the three months ended September 30, 2020.
4This adjustment was excluded because of the unique events associated with the ignition switch recall, which included various investigations, inquiries and complaints from constituents.
5These adjustments were excluded because of a strategic decision to accelerate our transformation for the future to strengthen our core business, capitalize on the future of personal mobility
and drive significant cost efficiencies. The adjustments primarily consist of accelerated depreciation and employee separation charges in the three months ended December 31, 2019, and
supplier-related charges and pension curtailment and other charges in the three months ended September 30, 2019.
6This adjustment was excluded because we divested our joint venture FAW-GM Light Duty Commercial Vehicle Co., Ltd. (FAW-GM), as a result of a strategic decision by both shareholders,
allowing us to focus our resources on opportunities expected to deliver higher returns. 28
7This adjustment was excluded because of the unique events associated with decisions rendered by the Superior Judicial Court of Brazil resulting in retrospective recoveries of indirect taxes.Impact of Special Items on GAAP Reported Earnings
($B) Q2 2021 Q2 2020
Special Adjusted Special Adjusted
Reported Reported
items (Non-GAAP) items (Non-GAAP)
Total net sales and revenues 34.2 — 34.2 16.8 0.03 16.8
Costs and expenses
Automotive and other cost of sales 27.3 — 27.3 13.4 (0.1)3 13.4
GM Financial operating and other expenses 1.9 — 1.9 3.2 — 3.2
Automotive and other SG&A 2.1 (0.1)1,2 2.0 1.3 (0.0)3 1.3
Total costs and expenses 31.3 (0.1) 31.2 18.0 (0.1) 17.9
Operating income (loss) 2.9 0.1 3.0 (1.2) 0.1 (1.1)
Net automotive interest expense, interest income,
0.9 — 0.9 0.3 — 0.3
other non-operating income, and equity income
Tax expense (benefit) 1.0 0.02 1.0 (0.1) (0.0)3 (0.1)
Net Income 2.8 0.1 2.9 (0.8) 0.1 (0.7)
Net (loss) income attributable to noncontrolling
(0.1) 0.01 (0.0) (0.0) — (0.0)
interests
Net income attributable to stockholders 2.8 0.1 2.9 (0.8) 0.1 (0.7)
Memo: depreciation, amortization and impairments 3.0 — 3.0 3.3 (0.0) 3.3
1,2,3 Refer to the respective footnote on slide 28 for description. 29EPS-Diluted-adjusted Reconciliation
Q2 H1
2021 2020 2021 2020
Diluted earnings (loss) per common share $1.90 ($0.56) $3.93 ($0.39)
Adjustments1 0.07 0.06 0.06 0.41
Tax effect on adjustments2 — — — (0.05)
Tax adjustment3 — — 0.22 0.16
EPS-diluted-adjusted $1.97 ($0.50) $4.21 $0.13
1 Seeslide 28 for description of adjustments.
2 The tax effect of each adjustment is determined based on the tax laws and valuation allowance status of the jurisdiction to which the adjustment relates.
3 These adjustments consist of tax expense related to the establishment of a valuation allowance against deferred tax assets that are considered no longer realizable for
Cruise in the six months ended June 30, 2021 and for GM in Australia and New Zealand for the six months ended June 30, 2020. These adjustments were excluded 30
because significant impacts of valuation allowances are not considered part of our core operations.Effective Tax Rate -adjusted
($B) except where noted Q2 H1
2021 2020 2021 2020
Income Income Income Income
Income Income Income Income
before Effective before Effective before Effective before Effective
tax tax tax tax
income tax rate income tax rate income tax rate income tax rate
expense expense expense expense
taxes taxes taxes taxes
Effective tax rate 3.8 1.0 25.9% (0.9) (0.1) 12.6% 7.9 2.1 27.0% (0.2) 0.2 n.m.
Adjustments1 0.1 0.0 0.1 (0.0) 0.1 0.0 0.6 0.1
Tax adjustment2 (0.3) (0.2)
ETR-adjusted 3.9 1.0 25.2% (0.8) (0.1) 14.6% 8.1 1.8 22.8% 0.3 0.1 23.2%
n.m.= not meaningful
1 See slide 28 for description of adjustments. These adjustments include Net income attributable to noncontrolling interests where applicable. The tax effect of each
adjustment is determined based on the tax laws and valuation allowance status of the jurisdiction to which the adjustment relates. 31
2 Refer to footnote 3 on slide 30 for description.Calculation of ROIC -adjusted
($B) Four quarters ended June 30,
2021 2020
Numerator:
EBIT (loss)-adjusted 17.5 3.8
Denominator:
Average equity1 49.2 42.8
Add: Average automotive debt and interest liabilities (excluding finance leases) 20.3 23.6
Add: Average automotive net pension & OPEB liability 17.8 17.1
Less: Average automotive and other net income tax asset (23.2) (23.9)
ROIC-adjusted average net assets 64.1 59.6
ROIC-adjusted 27.3% 6.4%
1 Includes
equity of noncontrolling interests where the corresponding earnings (loss) are included in EBIT (loss)-adjusted.
Note: ROIC-adjusted average net assets over four quarters includes cash.
32GM Financial - Key Metrics
Q2 2021 Q2 2020 H1 2021 H1 2020
Revenue ($B) 3.4 3.4 6.8 7.0
Total retail originations ($B) 15.0 11.9 29.0 23.4
Retail finance delinquencies (>30 days) 2.0% 3.5% 2.0% 3.5%
Annualized net charge-offs as % of average retail
0.4% 1.5% 0.6% 1.6%
finance receivables
Tangible equity ($B) 13.3 9.9 13.3 9.9
Joint ventures equity income ($M) 50 42 104 67
Dividend to GM ($M) 600 400 1,200 800
33GM Financial - Return on Equity
Four quarters ended June 30,
($B) 2021 2020
Net income attributable to common shareholder 3.7 1.1
Average equity 13.2 12.1
Less: average preferred equity (1.9) (1.5)
Average common equity 11.3 10.6
Less: average goodwill (1.2) (1.2)
Average tangible common equity 10.2 9.4
Return on average common equity 31.9% 10.8%
Return on average tangible common equity 35.5% 12.1%
34Updated 2021 Guidance Reconciliation
($B) Year Ending
Dec 31, 2021
Net income attributable to stockholders $7.7 - $9.2
Income tax expense $2.8 - $3.3
Automotive interest expense, net $0.9
Adjustments1 $0.1
EBIT-adjusted $11.5 - $13.5
Year Ending
Dec 31, 2021
Diluted earnings per common share $5.12 - $6.12
Adjustments2 0.28
EPS-diluted adjusted $5.40 - $6.40
($B) Year Ending
Dec 31, 2021
Automotive net cash provided by operating activities $10.0 - $12.0
Less: Capital expenditures $9.0 - $10.0
Adjusted automotive free cash flow $1.0 - $2.0
Note: we do not consider the potential future impact of adjustments on our expected financial results.
1 See slide 28 for a description of adjustments.
35
2 See slide 30 for a description of adjustments.For Additional Information Please Visit:
https://investor.gm.com
investorrelations@gm.com
https://www.gmfinancial.com/en-us/investor-center.html
investors@gmfinancial.com
GM’s Investor Relations website contains a significant amount of information about GM, including financial and other
information for investors. GM encourages investors to visit our website, https://investor.gm.com,
as information is updated and new information is posted.
These materials are the intellectual property of GM and/or its affiliates or subsidiaries and may not be copied, reproduced,
modified, displayed, or incorporated into other materials, in whole or in part, without the express permission of GM Investor
Relations. Requests to use the materials should be sent to investorrelations@gm.com.
36You can also read


