GET CONNECTED - HGCAPITAL TRUST PLC
←
→
Page content transcription
If your browser does not render page correctly, please read the page content below

Get connected
                                     To a universe of software and service businesses

               Listed access to the 3rd largest software business in Europe

                                                         September 2019

 This document accompanies the Interim Report & Accounts for the half year ended 30 June 2019 and contains a summary of information set out in
that document. Reference should be made to the full Report & Accounts rather than relying on this summary. The reader’s attention is also drawn to
          the provisions on pages 30 and 31. References in this document to HgCapital Trust plc have been abbreviated to ‘the Company’.

                                                                                                                                © Copyright Hg 2019   1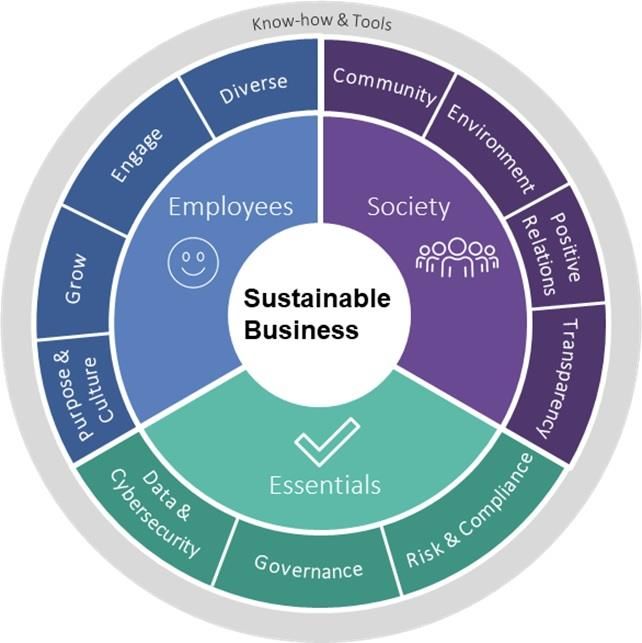
About the Manager

About
Building businesses that change how we all do business

   One of the largest dedicated tech teams in Europe
           with >90 executives and operators

   >170 people and >25 nationalities across 3 offices

   Most active global technology PE investor in 2018

  Realised returns of 2.6x / 34% gross IRR generated
              on >£7 billion of proceeds
Source: Hg                                               © Copyright Hg 2019   2
About the Manager
Single strategy across the funds - delivering broad sector
coverage
TARGET EVs FUND CHARACTERISTICS COMMON FEATURES
▪ Current vintage size: £1.5bn
>£1bn ▪ Deal Equity Requirement: >£500m ▪ Identical investment strategy
(Larger-cap) ▪ Typical fund hold: £350m - £450m
▪ Trust commitment £150m / 50% invested ▪ Dedicated execution teams per fund
▪ Current vintage size: £2.5bn
£250m - £1bn ▪ Deal equity requirements: £150m - £500m ▪ Integrated origination and coverage
(Mid-market) ▪ Typical fund hold: £100m - £250m
▪ Trust commitment £350m / 54% invested ▪ Investment Committee and Realisation
Committee
▪ Current vintage size: £595m
▪ Deal equity requirements: £30m - £120m
£50m - £250m ▪ Benefit from c. 50 person transaction
(Lower mid-market) support and Operations group
▪ Typical fund hold: £30m - £60m
▪ Trust commitment £80m / 44% invested
© Copyright Hg 2019 3About the Manager
Targeting Hg “sweet-spot” business models
Focused on specific characteristics across software and service businesses
Business critical need delivered as software,
service or component
Subscription or repeat revenue model
Utilising years of accumulated IP > high margins
Fragmented customer base
© Copyright Hg 2019 4About the Manager
…focused on eight distinct end-market ‘clusters’
End-market specialisation helps us to build deep know-how
GROSS
TOTAL
CLUSTER CURRENT PORTFOLIO REALISED
PROCEEDS
RETURNS
TAX & ACCOUNTING
£1,643m 3.0x / 36%
15 years
ERP & PAYROLL
£1,077m 3.0x / 34%
15 years
LEGAL & REGULATORY
COMPLIANCE £369m 2.1x / 39%*
12 years
AUTOMOTIVE
£767m 2.4x / 22%
10 years
SME TECH & SERVICES
£752m 2.5x / 24%
9 years
CAPITAL MARKETS &
WEALTH MANAGEMENT IT £616m 3.3x / 36%
6 years
INSURANCE
£363m 4.1x / 39%
5 years
HEALTHCARE IT
£212m 1.7x / 23%
4 years
As at 30 June 2019 pro forma for post period end events
* IRR excludes CS Group which would take realised IRR to > 500% © Copyright Hg 2019 5About the Manager
‘Hg Software Inc’
If ‘Hg Software Inc’ were listed as a single group, it would be the third largest and one of the fastest growing technology business in Europe
£22.3bn
5.4
4.3
+3%
REVENUE (£BN)
growth
2.3
£4.5bn
£4.0bn
£3.1bn £2.9bn
+5%
£1.9bn
+7%
+20% +8% (5%)
+7%
£0.7bn
+15%
5.4% 1.6% 26.5% 7.9% (6.0%) 6.4% 16.7%
“Scale” source: Factset, latest LTM revenue data available. Hg data as at 30 June 2019, adjusted pro forma for events post quarter end
“Competition” source: Preqin and internal Hg analysis © Copyright Hg 2019 6About the Manager
Operations group driving value
In 2018, 14 events enabled > 700 people from our portfolio companies to ‘harness the power of the Hg community’
Growth capabilities Platform
GROWTH TECHNOLOGY & TALENT FINANCE
PRODUCT
ANALYTICS OPERATING MODEL & RESPONSIBLE REPORTING &
SYSTEMS BUSINESS COMMUNITIES
© Copyright Hg 2019 7About the Manager
Growing sustainable businesses which are great
employers
>170 >25 4.5 27% AA+ 1%
Employees Nationalities Average Women in Hg’s 2018 UNPRI of LLP profit donated to
across three offices across Hg’s team Glassdoor score executive team rating charity annually
Three core tenets to Hg’s ESG and Sustainability strategy…
1. Charitable giving
• Hg donates 1% of firm profits to charitable causes
• In 2018, Hg broke a record for Impetus-PEF, committing the largest ever one-off donation;
a share of Hg’s profits arising from an investment fund are committed to the charity
2. Sustainable business practice
• Becoming carbon neutral
• Invest behind “sustainable” businesses, compliant with ESG framework and managed
for the long term
3. Job creation
• Building diverse teams, both internally and amongst portfolio companies
• Generate employment growth across our portfolio
…with the aim of becoming the most sustainable European private equity firm
© Copyright Hg 2019 8About the Company
HgCapital Trust plc is Hg’s largest single investor
Leading
Global
Institutional
c. £10bn £1.2bn
LPs Portfolio value, cash &
Invested capital and commitments to Hg
undrawn commitments
▪ Exposure to a network of highly cash generative software and service businesses with consistently strong trading growth
▪ Investments sourced by Hg using a deep sector focus to identify companies with specific business model types that can perform
across the economic cycle
▪ A fully independent NED Board that makes all decisions on the level of commitments made to Hg Funds (all investment decisions are
made by Hg)
▪ A ‘direct investor’ committed to multiple Hg funds and vintages, investing alongside Hg’s institutional investors
© Copyright Hg 2019 9About the Company
Listed access to unquoted software and services
A long-term investment delivering consistent, compounding growth continuing to outperform the FTSE All-Share Index
30 years old in 2019, 25 years managed by Hg
Entry into FTSE 250 October 2018
One of the top 10 performing investment companies*
10:1 share split in May 2019
£63 million share issue in June 2019
Note: All figures as at 30 June 2019, figures refer to share price performance on a total return basis, assuming all historic dividends have been reinvested. 10
© Copyright Hg 2019
*Source: AIC, based on ISA investment and assuming an investor had invested each year’s maximum ISA limit from 1999 to 2018, please refer to p.28 for further informationKey financial highlights
Long-term outperformance of the FTSE All-Share
Over the past 20 years strong trading and exits above book have continued to drive positive compounding performance
NAV per share +14% p.a ➔ £975 million net assets
Share price +15% p.a. ➔ £868 million market cap.
Over the past 20 years the share price has outperformed
the FTSE All-Share by > 9% p.a.
Note: As at 30 June 2019, all figures refer to performance on a total return basis, assuming all historic dividends have been reinvested. © Copyright Hg 2019 11
.About the Company
Long-term NAV growth
Over the past 10 years the NAV of the Trust has grown by c £630 million (14% p.a. CAGR) to £975 million
Note: As at 30 June 2019, all figures refer to performance on a total return basis, assuming all historic dividends have been reinvested. © Copyright Hg 2019 12
.Key financial highlights
Key financial highlights 2019 YTD
Share price reached record high in 2019
Share price +23% YTD ➔ £872 million market cap.
NAV per share +14%YTD ➔ £984 million net assets
Interim Dividend to be paid in October 1.8p (1.6p 2018)
£102 million returned to the Company
£108 million invested on behalf of the Company
Note: As at 31 August 2019, all figures refer to performance on a total return basis, assuming all historic dividends have been reinvested. © Copyright Hg 2019 13
.Key financial highlights
The balance sheet as at 31 August 2019
Levers have been put in place to manage liquid resources and outstanding commitments
Liquid resources £166 million (17% of NAV)
average over last 14 years 23%
Undrawn bank facility of £80 million
Outstanding commitments £342 million (35% of NAV)
Likely to be deployed over the next 12-18 months
Opt-out facility across all investing funds
© Copyright Hg 2019 14Key financial highlights
The top 20 trading performance
Top 20 currently represents 88% of the portfolio by value
LTM sales growth +26%
(25% 2018)
Aggregate sales of £3.7 billion
LTM EBITDA growth +35%
(27% 2018)
Aggregate EBITDA of £1.0 billion
➔
EV to EBITDA multiple 19.5x
(17.3x 2018)
Margins of 28%
Debt to EBITDA ratio 6.3x
(5.6x 2018)
Note: All figures as at 30 June 2019.
© Copyright Hg 2019 15
Note: Sales and EBITDA growth have been calculated on a weighted basis based on the respective values of the underlying investments.Portfolio activity
Historic realisation and investment activity
Continued strong realisation and investment activity, net seller environment
2006 – 2008 2009 – 2015 2016 – 2019
NET SELLERS NET BUYERS NET SELLERS
£272m
55%
£224m
£187m
£135m
£111m
£108m
£106m
£104m
£102m
£92m
£87m
£87m
£83m
£82m
£80m
£80m
£73m
£66m
£65m
£64m
£62m
£62m
£51m
£45m
£38m
£30m
£26m
£8m
2006 2007 2008 2009 2010 2011 2012 2013 2014 2015 2016 2017 2018 2019 YTD
Invested Realised Cash as % of NAV
© Copyright Hg 2019 16Portfolio activity
Significant realisations over the last 18 months
Gross £272m returned to the Company over 2018 (£217 million net), further £102 million returned 2019 YTD, Foundry sold at 80% uplift to BV (2.1x)
27% 47% 18% 56% 29% 22% 31% 66% 43% 37% 79%
4.9x
4.7x
4.3x 4.2x
3.6x 3.6x
3.0x 3.0x
2.6x
2.1x 2.1x
1.7x
1.4x 1.3x 1.3x
0.9x 1.0x 0.9x 0.9x 1.0x
0.6x 0.5x
£24m £20m £18m £15m £38m £93m n/a £17m £7m £10m £28m
35% IRR 50% IRR 0% IRR 4% IRR 26% IRR 26% IRR 29% IRR 39% IRR 0% IRR 0% IRR 22% IRR
Last valuation date Exit % Uplift to book value
Note: Figures relate to HgCapital Trust’s share of transactions
© Copyright Hg 2019 17Portfolio activity
Hg continues to selectively invest
Investing with a cautious and disciplined strategy into strategies we know well
Making repeatable investments in the types of companies and ‘clusters’ that we have invested in before
23%
of NAV
17% 11%
of NAV of NAV
18% 18%
of NAV 10%
of NAV
12% £188m
of NAV
of NAV
£104m £107m
£80m £87m
£65m £73m
2013 2014 2015 2016 2017 2018 Jun-19
Note: Figures relate to HgCapital Trust’s share of transactions, % figures show proportion of cash invested to net assets.
© Copyright Hg 2019 18Outlook
Outlook
Strong trading, combined with capital returns from exits above book value, will continue to drive value for our investors
▪ It has been another strong period of performance for the Company with the underlying businesses continuing to
see robust trading performance underpinning confidence in the ongoing growth of the strong and defensive
portfolio.
▪ Hg continues to selectively invest in “sweet-spot” software and service businesses in areas or ‘clusters’ where we
have many years of deep knowledge.
▪ Highly focused on making further accretive bolt-on acquisitions into our portfolio companies.
▪ A focus on operational improvement continues to drive performance and deliver significant network benefits.
▪ We expect to see further liquidity events over the next twelve months through both exits and refinancings.
Strong earnings, realisations at uplifts to book value and supporting the management teams of the underlying businesses
will continue to drive value for shareholders in HgCapital Trust plc
© Copyright Hg 2019 19Appendix:
Team
© Copyright Hg 2019 20About the Manager
Large and well-resourced investment “machine”
DEAL EXECUTION
Directors & Associates &
Partners Principals Analysts Total
5 5 8 18
10 11 22 43
3 5 7 15
Total: 76
OPERATIONS GROUP
32 professionals
TRANSACTION SUPPORT EXECUTIVES
Client Services - 9 Finance - 5 Legal - 3 Marketing & HR - 3
~60 further staff supporting Hg’s investment executives
© Copyright Hg 2019 21Appendix:
Portfolio (June 2019)
© Copyright Hg 2019 22Appendix
The top 20 portfolio at 30 June 2019
The top 10 buy-out investments represent 68% of the total value
Residual Total Portfolio Cumulative Change in
Year of Cost valuation value value value over
Investment investment Sector Location £’000 £’000 % % 2019 YTD
1 Visma 2014 Software Scandinavia 80,782 197,374 22.7% 22.7%
2 Sovos Compliance 2016 Software North America 26,177 85,570 9.8% 32.5%
3 IRIS 2018 Software UK 36,380 55,964 6.4% 38.9%
4 Access 2018 Software UK 30,491 45,654 5.2% 44.1%
5 Transporeon 2019 Software Germany 42,377 45,042 5.2% 49.3%
6 CogitalGroup 2016 Services UK 20,966 41,803 4.8% 54.1%
7 Mobility Holding 2018 Services Germany 33,967 37,856 4.3% 58.4%
8 Litera 2019 Software North America 34,284 35,188 4.0% 62.4% ➔
9 Commify 2017 Software UK 12,548 23,308 2.7% 65.1%
10 Mitratech 2017 Software North America 22,258 21,974 2.5% 67.6% ➔
340,230 589,733 67.6%
Top 10 Investments
© Copyright Hg 2019 23Appendix
The top 20 portfolio at 30 June 2019 (continued)
The top 20 buy-out investments represent 88% of the total value
Residual Total Portfolio Cumulative Change in
Year of Cost valuation value valuevalue over 2019
Investment investment Sector Location £’000 £’000 % % YTD
11 Register 2017 Software Italy 3,391 19,902 2.3% 69.9%
12 IT Relation 2018 Services Scandinavia 16,037 19,570 2.2% 72.1%
13 FE fundinfo 2018 Software UK 11,407 19,154 2.2% 74.3%
14 A-Plan 2015 Services UK 1,697 18,655 2.2% 76.5%
15 team.blue 2019 Software Benelux 18,718 18,200 2.1% 78.6%
16 Rhapsody 2018 Software North America 13,045 17,764 2.0% 80.6%
17 Citation 2016 Services UK 7,904 17,520 2.0% 82.6%
18 Allocate Software 2018 Software UK 13,959 16,594 1.9% 84.5%
19 BrightPay 2018 Software Ireland 14,864 15,522 1.8% 86.3% ➔
20 TeamSystem 2010 Software Italy 144 14,982 1.7% 88.0%
Top 20 Investments 441,396 767,596 88.0%
© Copyright Hg 2019 24Appendix
Asper renewable energy
High quality European renewable energy projects managed by Asper Investment Management currently representing
2.6% of the portfolio value (£23 million)
▪ The Company invested via LP interests in Asper’s two Renewable Energy
Funds, RPP1 (2006) and RPP2 (2010)
▪ Exposure to renewable power assets anticipated to deliver returns through
yield during operation and capital gain at exit
▪ By bringing individual investments together into platforms, Asper can
enhance value through economies of scale, shared expertise and aggregated
generation capacity In September 2019, the
▪ The UK wind portfolio was fully exited in 2013, resulting in an overall Company agreed the sale
investment multiple of 1.8x and a gross IRR of 17% p.a. of the Asper RPP II assets
▪ Three successful exits in 2017 (in Ireland, Sweden and the UK) and the robust
to two strategic buyers, as
operating performance of the rest of the portfolio contributed to a part of a wider secondary
substantial uplift of over 30% in the NAV of Asper RPP II over 2017. sale process.
▪ The NAV increased further in 2018, thanks to positive developments in the
arbitrations against Spain, including successful investor awards in similar
claims.
▪ In September 2019, the Company agreed the sale of the Asper RPP II assets
to two strategic buyers, as part of a wider secondary sale process.
Note: Asper Investment Management spun out of Hg in 2017
© Copyright Hg 2019 25
For further information please see http://asper-im.com/Appendix:
Miscellaneous
© Copyright Hg 2019 26Appendix
funds snapshot
All funds first or second quartile; improving as we have specialised
Gross
Fund % in Software & Services
Realised Total
Saturn I (2017)
100% - 1.4x / 53%
£1.5 billion
Mercury 2 (2017)
100% - 1.9x / 118%
£575 million
(Genesis)Hg8 (2017)
100% - 1.2x / 25%
£2.5 billion
(Genesis)Hg7 (2013)
100% 2.2x / 29% 2.2x / 27%
£2.0 billion
Mercury I (2012)
100% 3.2x / 44% 2.6x / 39%
£380 million
Hg6 (2009)
84% 2.2x / 18%
£1.9 billion
Hg5 (2006)
42% 2.0x / 16%
£958 million
Hg4 (2001)
41% 2.3x / 32%
£742 million
* These funds have utilised a subscription facility to fund initial investments. Note that Hg funds prior to the most recent vintage do not utilise a subscription facility,
which we believe would increase net IRR by approximately 2-4%. Returns are as at 30 June 2019, adjusted pro forma for events post-period end. © Copyright Hg 2019 27
Benchmarked against Cambridge Associates Q2 2018 ex-US developed markets Private EquityAppendix
One of the top 10 performing ISA eligible investment
companies over the last 20 years
The AIC’s research shows that if an investor had invested each year’s maximum ISA limit from 1999 to 2018 – an investment of £206,560 in total – HgCapital
Trust would have turned it into £873,222.
Company name AIC sector Investment value at 31/01/2019 if the
full ISA limit had been invested
annually from 06/04/1999
1 Aberdeen New Thai Country Specialists: Asia Pacific £1,070,583
2 Aberdeen Standard Asia Focus Asia Pacific - Excluding Japan £966,042
3 Scottish Oriental Smaller Companies Asia Pacific - Excluding Japan £956,981
4 Rights & Issues UK Smaller Companies £950,500
5 Scottish Mortgage Global £932,615
6 BlackRock Smaller Companies UK Smaller Companies £903,804
7 Baillie Gifford Shin Nippon Japanese Smaller Companies £888,326
8 HgCapital Trust Private Equity £873,222
9 Worldwide Healthcare Sector Specialist: Biotechnology & Healthcare £860,491
10 TR Property Property Securities £845,173
Source: Association of Investment Companies (AIC) / Morningstar © Copyright Hg 2019 28Appendix
Contact
For further information on HgCapital Trust plc, please visit our website:
www.hgcapitaltrust.com
Or contact Laura Dixon
+44 (0)20 7089 7888
investorrelations@hgcapitaltrust.com
© Copyright Hg 2019 29Appendix
Disclaimer
NOT FOR RELEASE, PUBLICATION OR DISTRIBUTION, DIRECTLY OR INDIRECTLY, IN WHOLE OR IN PART, INTO OR WITHIN THE UNITED STATES OR TO “US PERSONS” (AS DEFINED IN REGULATION S UNDER THE UNITED
STATES SECURITIES ACT OF 1933, AS AMENDED (THE “SECURITIES ACT”) OR INTO OR WITHIN AUSTRALIA, CANADA, SOUTH AFRICA, OR JAPAN. RECIPIENTS OF THIS DOCUMENT AND THE PRESENTATION (THE
"MATERIALS") IN JURISDICTIONS OUTSIDE THE UK SHOULD INFORM THEMSELVES ABOUT AND OBSERVE ANY APPLICABLE LEGAL REQUIREMENTS IN THEIR JURISDICTIONS. IN PARTICULAR, THE DISTRIBUTION OF THE
MATERIALS MAY BE RESTRICTED BY LAW IN CERTAIN JURISDICTIONS. ACCORDINGLY, RECIPIENTS REPRESENT THAT THEY ARE ABLE TO RECEIVE THE MATERIALS WITHOUT CONTRAVENTION OF ANY APPLICABLE LEGAL
OR REGULATORY RESTRICTIONS IN THE JURSIDICTION IN WHICH THEY RESIDE OR CONDUCT BUSINESS.
This document accompanies the Interim Report and Accounts for the twelve months ended 31 December 2018 of HgCapital Trust plc and contains a summary of the information set out in that document. Reference
should be made to the full Interim Report and Accounts rather than relying on this summary. It does not constitute an advertisement and is not a prospectus. It does not constitute an offer to sell or a solicitation of an
offer to buy any securities described herein in the United States or in any other jurisdiction, nor shall it, by the fact of its distribution, form the basis if, or be relied upon, in connection with any such contract. No offer,
invitation or inducement to acquire shares or other securities in HgCapital Trust plc (“Shares”) is being made by or in connection with this document.
The information presented herein is not an offer for sale within the United States of any equity shares or other securities of HgCapital Trust plc. HgCapital Trust plc has not been and will not be registered under the US
Investment Company Act of 1940, as amended (the “Investment Company Act"). In addition, the Shares have not been and will not be registered under the Securities Act or any other applicable law of the United
States. Consequently, the Shares may not be offered or sold or otherwise transferred within the United States, or to, or for the account or benefit of, US Persons, except pursuant to an exemption from the registration
requirements of the Securities Act and under circumstances which will not require HgCapital Trust plc to register under the Investment Company Act. No public offering of the Shares is being made in the United States.
The Shares may only be resold or transferred in accordance with the restrictions set forth in the Prospectus to be published in connection with any proposed offering and related subscription documents. This
communication should not be distributed, forwarded, transferred, reproduced, or otherwise transmitted, directly or indirectly, to any persons within the United States or to any US Persons unless it is lawful to do so.
This document is being issued by Hg Pooled Management Limited a company authorised and regulated by the Financial Conduct Authority to accompany the Interim Report and Accounts. The Presentation is being
issued on a strictly confidential basis and the information contained in the Presentation may not be copied, distributed, published or reproduced, in whole or in part, to any other person at anytime without the propr
written consent of the Company. The information and opinions contained in this document are for background purposes only, do not purport to be full or complete and do not constitute investment advice. Subject to
Hg Pooled Management Limited 's regulatory requirements and responsibilities, no reliance may be placed for any purpose on the information and opinions contained in this document or their accuracy or
completeness and no representation, warranty or undertaking, express or implied, is given as to the accuracy or completeness of the information or opinions contained in this document by Hg Pooled Management
Limited or any of its members or employees and no liability is accepted by such persons for the accuracy or completeness of any such information or opinions.
This information is not intended to provide, and should not be relied upon, for accounting, legal, tax advice or investment recommendations. You should consult your tax, legal, accounting or other professional advisors
about the issues discussed herein. The descriptions contained herein are summaries and are not intended to be complete and neither Hg Pooled Management Limited nor any of its affiliates undertakes any obligation
to update or correct any errors or inaccuracies in any of the information presented herein. The information in these materials and any other information discussed at the presentation is subject to change. This
document does not constitute or form part of any offer to issue or sell, or any solicitation of any offer to subscribe or purchase any investment nor shall it or the fact of its distribution form the basis of, or be relied on
in connection with, any contract thereof.
© Copyright Hg 2019 30Appendix
Disclaimer
These materials include statements that are, or may be deemed to be, "forward-looking statements" which are based on current expectations and projections about future events. In some cases, these forward-looking
statements may be identified by the use of forward-looking terminology, including the terms "targets", "believes", "estimates", "anticipates", "expects", "intends", "may", "will" or "should" or, in each case, their negative
or other variations or comparable terminology. They appear in a number of places throughout these materials and include statements regarding the intentions, beliefs or current expectations of Hg Pooled Management
Limited and/or its members or employees concerning, among other things, the trading performance, results of operations, financial condition, liquidity, prospects and investment policy of HgCapital Trust plc. By their
nature, these forward-looking statements as well as those included in any other material discussed at any presentation involve risks and uncertainties because they relate to events and depend on circumstances that
may or may not occur in the future. All statements other than statements of historical facts in this Presentation, including, without limitation, those regarding the Company’s financial position, business strategy, plans
and objectives of management or future operations (including development plans and objectives relating to the Company’s products and services) are forward-looking statements.
Forward-looking statements are not guarantees of future performance. A number of important factors could cause actual results or outcomes to differ materially from those expressed, projected or implied in any
forward-looking statements. No one undertakes publicly to update or revise any such forward-looking statement. In light of these risks, uncertainties and assumptions, the events or circumstances referred to in the
forward-looking statements may not occur. None of the future projections, expectations, estimates or prospects in this document should be taken as forecasts or promises nor should they be taken as implying any
indication, assurance or guarantee that the assumptions on which such future projections, expectations, estimates or prospects have been prepared are correct or exhaustive or, in the case of the assumptions, fully
stated in the document. The Company expressly disclaims any obligation or undertaking to update or revise any such forward-looking statement, whether as a result of new information, future events or otherwise,
unless required to do so by the Financial Services and Markets Act 2000, the Listing Rules or Prospectus Rules of the Financial Conduct Authority or other applicable laws, regulations or rules. As a result of these risks,
uncertainties and assumptions, you should not place undue reliance on these forward-looking statements as a prediction of actual results or otherwise.
Return targets are targets only and are based over the long-term on the performance projections of the investment strategy and market conditions at the time of modelling and are therefore subject to change. There is
no guarantee that any target return can be achieved. Investors should not place any reliance on such target return in deciding whether to invest in HgCapital Trust plc . Past performance is not necessarily a reliable
indicator of future results.
To the extent available, the industry, market and competitive position data contained in these materials come from official or third party sources. Third party industry publications, studies and surveys generally state
that the data contained therein have been obtained from sources believed to be reliable, but that there is no guarantee of the accuracy or completeness of such data. The contents of this document have not been
independently verified, are not comprehensive, does not contain all the information that a prospective purchaser of securities may desire or require in deciding whether or not to offer to purchase such securities and
do not constitute a due diligence review and should not be construed as such. Subject to Hg Pooled Management Limited's regulatory requirements and responsibilities, no undertaking, representation, warranty or
other assurance, express or implied, is made or given by or on behalf of Hg Pooled Management Limited or any of its members, employees, agents or advisers or any other person as to the accuracy, completeness or
fairness of the information, forward-looking statements or opinions contained in this document and no responsibility or liability is accepted by any of them for any such information, forward-looking statements or
opinions or in respect of any omission, and this document is distributed expressly on the basis that it shall not give rise to any liability or obligation if, for whatever reason, any of its contents are or become inaccurate,
incomplete or misleading and neither Hg Pooled Management Limited nor any such persons undertakes any obligation to provide the recipient with access to additional information or to correct any inaccuracies herein
which may become apparent.
Hg Pooled Management Limited, Company number: 02055886 Registered office: 2 More London Riverside, London SE1 2AP.
Authorised and regulated by the Financial Conduct Authority of 12 Endeavour Square, London E20 1JN with firm reference number 122466.
.
© Copyright Hg 2019 31You can also read