HAFNIA LIMITED INVESTOR PRESENTATION Q2 2021 - 30 August 2021
←
→
Page content transcription
If your browser does not render page correctly, please read the page content below

HAFNIA LIMITED
I N V E S TO R P R E S E N TAT I O N
            Q2 2021

             30 August 2021
DISCLAIMER – Safe Harbor Message

IMPORTANT: YOU MUST READ THE FOLLOWING BEFORE CONTINUING. THE FOLLOWING APPLIES TO THIS DOCUMENT, THE ORAL PRESENTATION OF THE INFORMATION IN THIS DOCUMENT BY
HAFNIA LIMITED (THE "COMPANY") OR ANY PERSON ON BEHALF OF THE COMPANY, AND ANY QUESTION-AND-ANSWER SESSION THAT FOLLOWS THE ORAL PRESENTATION (COLLECTIVELY, THE
"INFORMATION"). IN ACCESSING THE INFORMATION, YOU AGREE TO BE BOUND BY THE FOLLOWING TERMS AND CONDITIONS.

THIS DOCUMENT HAS BEEN PRODUCED SOLELY FOR INFORMATION PURPOSES. THE INFORMATION DOES NOT CONSTITUTE OR FORM PART OF, AND SHOULD NOT BE CONSTRUED AS AN OFFER
OR THE SOLICITATION OF AN OFFER TO SUBSCRIBE FOR OR PURCHASE SECURITIES OF THE COMPANY, AND NOTHING CONTAINED THEREIN SHALL FORM THE BASIS OF OR BE RELIED ON IN
CONNECTION WITH ANY CONTRACT OR COMMITMENT WHATSOEVER, NOR DOES IT CONSTITUTE A RECOMMENDATION REGARDING SUCH SECURITIES. ANY SECURITIES OF THE COMPANY MAY
NOT BE OFFERED OR SOLD IN THE UNITED STATES OR ANY OTHER JURISDICTION WHERE SUCH A REGISTRATION WOULD BE REQUIRED UNLESS SO REGISTERED, OR AN EXEMPTION FROM THE
REGISTRATION REQUIREMENTS OF THE U.S. SECURITIES ACT OF 1933, AS AMENDED, OR OTHER APPLICABLE LAWS AND REGULATIONS IS AVAILABLE. THE INFORMATION IS NOT DIRECTED TO, OR
INTENDED FOR DISTRIBUTION TO OR USE BY, ANY PERSON OR ENTITY THAT IS A CITIZEN OR RESIDENT OF, OR LOCATED IN, ANY LOCALITY, STATE, COUNTRY OR OTHER JURISDICTION WHERE
SUCH DISTRIBUTION OR USE WOULD BE CONTRARY TO LAW OR REGULATION OR WHICH WOULD REQUIRE ANY REGISTRATION OR LICENSING WITHIN SUCH JURISDICTION. THE INFORMATION IS
NOT FOR PUBLICATION, RELEASE OR DISTRIBUTION IN ANY JURISDICTION IN WHICH OFFERS OR SALES WOULD BE PROHIBITED BY APPLICABLE LAW.

THE INFORMATION CONTAINS FORWARD-LOOKING STATEMENTS. ALL STATEMENTS OTHER THAN STATEMENTS OF HISTORICAL FACTS INCLUDED IN THE INFORMATION ARE FORWARD-LOOKING
STATEMENTS. FORWARD-LOOKING STATEMENTS GIVE THE COMPANY'S CURRENT BELIEFS, INTENTIONS, EXPECTATIONS AND PROJECTIONS RELATING TO ITS FINANCIAL CONDITION, RESULTS OF
OPERATIONS, LIQUIDITY, PROSPECTS, GROWTH, PLANS AND STRATEGIES. THESE STATEMENTS MAY INCLUDE, WITHOUT LIMITATION, ANY STATEMENTS PRECEDED BY, FOLLOWED BY OR
INCLUDING WORDS SUCH AS "TARGETS", "BELIEVES", "CONTINUES", "EXPECTS", "AIMS", "INTENDS", "MAY", "ANTICIPATES", "ESTIMATES", "PLANS", "PROJECTS", "WILL", "CAN HAVE",
"LIKELY", "GOING FORWARD", "SHOULD", "WOULD", "COULD" AND OTHER WORDS AND TERMS OF SIMILAR MEANING OR THE NEGATIVE THEREOF. THE FORWARD-LOOKING STATEMENTS ARE
BASED UPON VARIOUS ASSUMPTIONS, MANY OF WHICH ARE BASED, IN TURN, UPON FURTHER ASSUMPTIONS, INCLUDING WITHOUT LIMITATION, MANAGEMENT'S EXAMINATION OF
HISTORICAL OPERATING TRENDS, DATA CONTAINED IN THE COMPANY'S RECORDS AND DATA AVAILABLE FROM THIRD PARTIES. ALTHOUGH THE COMPANY BELIEVES THAT THESE ASSUMPTIONS
WERE REASONABLE WHEN MADE, THESE ASSUMPTIONS ARE INHERENTLY SUBJECT TO SIGNIFICANT KNOWN AND UNKNOWN RISKS, UNCERTAINTIES, CONTINGENCIES AND OTHER IMPORTANT
FACTORS WHICH ARE DIFFICULT OR IMPOSSIBLE TO PREDICT AND ARE BEYOND ITS CONTROL AND THAT COULD CAUSE THE COMPANY'S ACTUAL FINANCIAL CONDITION, RESULTS OF
OPERATIONS, LIQUIDITY, PROSPECTS, GROWTH, PLANS AND STRATEGIES TO BE MATERIALLY DIFFERENT FROM THE FINANCIAL CONDITION, RESULTS OF OPERATIONS, LIQUIDITY, PROSPECTS,
GROWTH, PLANS AND STRATEGIES EXPRESSED OR IMPLIED BY SUCH FORWARD-LOOKING STATEMENTS.

NO REPRESENTATION, WARRANTY OR UNDERTAKING, EXPRESS OR IMPLIED, IS MADE AS TO, AND NO RELIANCE SHOULD BE PLACED ON, THE FAIRNESS, ACCURACY, COMPLETENESS OR
CORRECTNESS OF THE INFORMATION OR THE OPINIONS CONTAINED THEREIN. NEITHER THE COMPANY NOR ANY OF ITS AFFILIATES OR REPRESENTATIVES SHALL HAVE ANY RESPONSIBILITY OR
LIABILITY WHATSOEVER (FOR NEGLIGENCE OR OTHERWISE) FOR ANY LOSS WHATSOEVER AND HOWSOEVER ARISING FROM ANY USE OF THE INFORMATION. THE INFORMATION HAS NOT BEEN
INDEPENDENTLY VERIFIED AND WILL NOT BE UPDATED. THE INFORMATION, INCLUDING BUT NOT LIMITED TO FORWARD-LOOKING STATEMENTS, APPLIES ONLY AS OF THE DATE OF THIS
DOCUMENT AND IS NOT INTENDED TO GIVE ANY ASSURANCES AS TO FUTURE RESULTS OR ACHIEVEMENTS. THE COMPANY EXPRESSLY DISCLAIMS ANY OBLIGATION OR UNDERTAKING TO
DISSEMINATE ANY UPDATES OR REVISIONS TO THE INFORMATION, INCLUDING ANY FINANCIAL DATA OR FORWARD-LOOKING STATEMENTS, AND WILL NOT PUBLICLY RELEASE ANY REVISIONS IT
MAY MAKE TO THE INFORMATION THAT MAY RESULT FROM ANY CHANGE IN THE COMPANY'S EXPECTATIONS, ANY CHANGE IN EVENTS, CONDITIONS OR CIRCUMSTANCES ON WHICH THESE
FORWARD-LOOKING STATEMENTS ARE BASED, OR OTHER EVENTS OR CIRCUMSTANCES ARISING AFTER THE DATE OF THIS DOCUMENT.

THE INFORMATION IS NOT TO BE CONSTRUED AS LEGAL, BUSINESS, INVESTMENT OR TAX ADVICE. EACH RECIPIENT SHOULD CONSULT ITS OWN LEGAL, BUSINESS, INVESTMENT OR TAX ADVISER
AS TO LEGAL, BUSINESS, INVESTMENT OR TAX ADVICE. BY ACCESSING THE INFORMATION YOU ACKNOWLEDGE THAT YOU WILL BE SOLELY RESPONSIBLE FOR YOUR OWN ASSESSMENT OF THE
MARKET AND THE MARKET POSITION OF THE COMPANY AND THAT YOU WILL CONDUCT YOUR OWN ANALYSIS AND BE SOLELY RESPONSIBLE FOR FORMING YOUR OWN VIEW ON THE POTENTIAL
FUTURE PERFORMANCE OF THE COMPANY.

THIS DOCUMENT CONTAINS STATISTICS, DATA, STATEMENTS AND OTHER INFORMATION RELATING TO THE GROUP'S MARKETS AND THE INDUSTRY IN WHICH IT OPERATES. WHERE SUCH
INFORMATION HAS BEEN DERIVED FROM THIRD-PARTY SOURCES, SUCH SOURCES HAVE BEEN IDENTIFIED HEREIN. IN ADDITION, THE COMPANY HAS BEEN NAMED AS A SOURCE FOR CERTAIN
MARKET AND INDUSTRY STATEMENTS INCLUDED IN THIS DOCUMENT. SUCH "COMPANY INFORMATION" REFLECTS THE COMPANY'S VIEWS BASED ON ONE OR MORE SOURCES AVAILABLE TO IT
(SOME OF WHICH ARE NOT PUBLICLY AVAILABLE, BUT CAN BE OBTAINED AGAINST PAYMENT), INCLUDING DATA COMPILED BY PROFESSIONAL ORGANISATIONS, CONSULTANTS AND ANALYSTS
AND INFORMATION OTHERWISE OBTAINED FROM OTHER THIRD PARTY SOURCES.

                                                                                                                                                                          2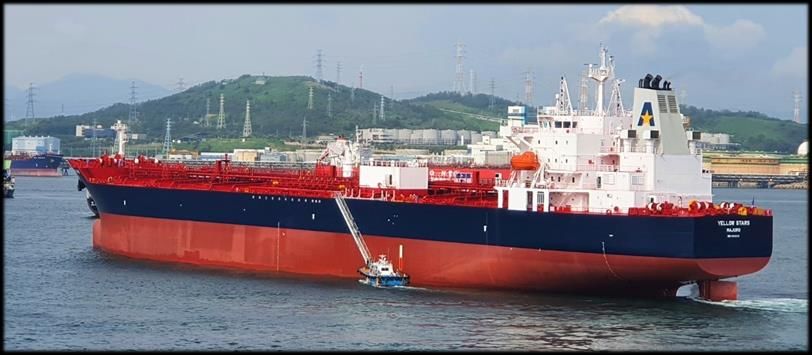
AGENDA

     Q2 2021 Highlights/Overview

     Industry Review & Outlook

            ESG Overview

 3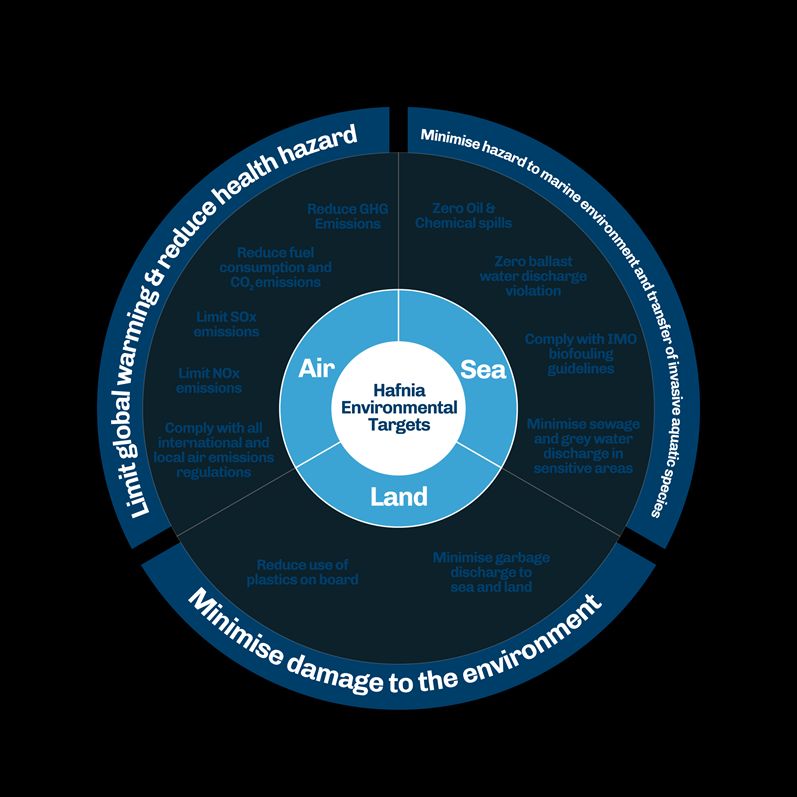
INTRODUCTION TO HAFNIA
Fully integrated shipping platform with 100% alignment of interests and no fee leakage
                                        Operational Overview                                                                                    IMO’s Carbon Intensity Targets

                                                                                                                                7.61
                                    •    Attractive and high-quality fleet, active across all                               8
                                         segments to meet client’s needs                                                    7           6.20   6.04
                                                                                                                                                                 5.73     5.57
      Shipowner
                                    •    Portfolio management approach to fleet composition and                             6                                                                                4.78
                                                                                                                                                                                                                            4.47

                                                                                                      gms CO2 / DWT - NM
                                         development                                                                        5
                                                                                                                            4
                                                                                                                            3           5.83   5.70
                                                                                                                            2                            5.6% below the                                      4.47     Aim for two

    Commercial                      •    Global commercial platform with chartering teams in                                1
                                                                                                                                                            trajectory                                              years in advance

                                         Asia, Europe and USA
    management                                                                                                              0
                                    •    Secures optionality and flexibility for customers                                      2008   2019    2020      2021    2022     2023   2024   2025   2026   2027   2028   2029   2030
     and pool
                                    •    Fee structure on net earnings, incentivised to optimise                                       Hafnia's Status            Hafnia's Projected            IMO's Target Carbon Intensity
     platform                            between revenue and voyage expenses

                                                                                                                                                            Hafnia in Numbers
                                    •    In-house dedicated technical management team with
                                         long and solid track record
     Technical                      •    Strong vetting track record with all major charterers
                                                                                                                                 NAV                                    Fleet value                     Average age1
    management                      •    “Zero harm” policy
                                    •    Balanced outsourcing with a team to supervise
                                         outsourced vessels                                                                USD ~1.0bn                            USD ~2.0bn                              8.0 years
                                    •    Reducing fuel consumption by big data analysis from
                                         vessels-based sensors via SMARTShip from Alpha Ori                                   # vessels                              Operating                                  Listed
      Reducing                      •    Route optimisations using data analysis                                           Owned2/Operated                      Cash flow breakeven
     emissions to                   •    Intermittent hull cleaning and propeller polishing
         air                        •    On-going fuel trials for new and innovative alternate
                                                                                                                            98x/184x                              USD 13,288                           (HAFNI:Oslo)
                                         fuels

1
2
    Including six LR1s owned through 50% ownership in Vista Shipping Pte Ltd
    Including chartered-in fleet and six LR1s owned through 50% ownership in Vista Shipping Pte Ltd
                                                                                                                                                                                                                                4
Q2 2021 HIGHLIGHTS - SNAPSHOT
Earnings
                 TCE Income                                            EBITDA                                           Pool Income
     Q2 2021                                            Q2 2021                                             Q2 2021
                USD 101.6M                                           USD 37.9M                                           USD 5.4M
     H1 2021                                            H1 2021                                             H1 2021
                USD 201.6M                                           USD 75.0M                                           USD 10.0M

                 Net Income                                  Basic Earnings per Share                                 Return on Equity
     Q2 2021                                            Q2 2021                                             Q2 2021
                 -USD 11.2M                                           -USD 0.03                                             -3.9%
     H1 2021                                            H1 2021                                             H1 2021
                -USD 26.9 M                                           -USD 0.07                                             -4.7%

Key Events
     ▪ Committed sale of LR1 vessel BW Amazon
     ▪ Signed an 18-month USD 100 million unsecured term loan and revolving credit facility
     ▪ Concluded a 50% joint venture with Andromeda for two MR newbuilds
     ▪ Exercised an option held in Vista Shipping for two additional LR2 dual-fuel LNG vessels releasing 30 times less methane than a standard dual-
       fuel LNG engine
                                                                                                                                                 5
Q2 2021 HIGHLIGHTS – KEY EVENTS
Joint Venture Agreement with Andromeda Shipholdings Ltd
• In July 2021, Hafnia concluded a joint venture agreement with Andromeda
Shipholdings Ltd, setting up a 50/50 owned shipholding company “H&A Shipping
Ltd”.
• The joint venture owns two newbuild MR vessels from Hyundai Mipo Dockyard.
• The first vessel, MT Yellow Stars, was delivered from HMD shipyard on 30 July
2021. The second vessel, MT PS Stars will be delivered 30 January 2022. At
delivery, the vessels will be chartered out for five years.
Further Newbuilds for Vista Shipping
• In May 2021, Hafnia has exercised options held in Vista Shipping for two further
LR2 tankers with dual-fuel high pressure LNG engines to be constructed at
Guangzhou Shipyard International (“GSI”) in China for USD 59.0 million.
• Vista Shipping will now own four sister vessels of this type.
• The vessels are scheduled to be delivered in 2023 and 2024 respectively. At
delivery, the vessels will be chartered out for five-years.
• Vista’s high pressure engines releases 97% less methane than a standard low-
pressure LNG engine.
• The fuel systems on-board are prepared for future renewable fuels with some
engine modifications.
62021 Q2 FINANCIAL SUMMARY
Income Statement 40% 33.5%
Q2 2020 1H 2020 Q2 2021 1H 2021
USDm 30%
Revenue 268.9 537.3 198.0 377.3
20%
Voyage expenses (62.0) (136.9) (96.3) (175.7) Return on
TCE income 206.9 400.4 101.6 201.6 equity 10%
0.1%
Other operating income 7.1 13.4 5.4 10.0 (annualised) 0%
Vessel operating expenses (45.7) (97.0) (49.1) (94.7) -10% -5.5% -3.9%
-9.3%
Technical management expenses (4.1) (8.1) (4.3) (8.0) -20%
Charter hire expenses (8.1) (13.5) (5.2) (10.2) Q2 2020 Q3 2020 Q4 2020 Q1 2021 Q2 2021
General and administrative expenses (10.2) (19.6) (10.6) (23.7)
EBITDA 145.9 275.5 37.9 75.0
Depreciation and amortisation charges (38.9) (77.4) (37.5) (74.7) 20% 18.3%
Loss on disposal of vessel - - - (0.4)
Write-down on reclassification to asset held for sale - - (1.3) (2.9)
Return on 10%
EBIT 107.0 198.0 (0.9) (3.1)
invested 2.6%
Net financial expense (12.2) (26.8) (9.0) (21.7) capital1 0%
Share of profit/(loss) from associate and joint venture 3.5 4.6 (0.6) (0.9) (annualised) -1.6% -0.5% -0.3%
Profit/(loss) before income tax 98.4 175.9 (10.6) (25.7)
Income tax (0.6) (1.0) (0.6) (1.1) -10%
Q2 2020 Q3 2020 Q4 2020 Q1 2021 Q2 2021
Profit/(loss) after income tax 97.7 174.8 (11.2) (26.9)
Balance Sheet Items
Q4 2020 Q1 2021 Q2 2021
USDm
50% 45.1% 45.0% 45.1% 45.8% 46.2%
Total assets 2,544 2,496 2,451
Cash and cash equivalents 101 91 86 40%
Total equity 1,148 1,142 1,131 30%
Gross debt 1,307 1,283 1,243 Equity ratio
20%
Net working capital 108 115 108
10%
Net LTV - % 57.9 57.9 55.2
1,893 1,968 2,028 0%
Average broker value2
Q2 2020 Q3 2020 Q4 2020 Q1 2021 Q2 2021
1 Beginning from Q1 2021, ROIC calculated using annualised EBIT less tax, while prior quarters were calculated using annualised EBIT adjusted for dry dock depreciation
2 Q4 2020: Including USD 113.0 million relating to Hafnia’s 50% share of five LR1s and one LR1 newbuild owned through 50% ownership in the Vista Joint Venture; and excluding Compass and Compassion (classified as assets held for sale)
Q1 2021: Including USD 107.4 million relating to Hafnia’s 50% share of six LR1s owned through 50% ownership in the Vista Joint Venture and excluding Hafnia Europe (classified as asset held for sale)
7
Q2 2021: Including USD 115.0 million relating to Hafnia’s 50% share of six LR1s owned through 50% ownership in the Vista Joint Venture and excluding BW Amazon (classified as asset held for sale)2021 Q2 FINANCIAL SUMMARY
Q2 saw an average TCE of USD 12,400 per day and OPEX of USD 7,054 per day
TCE Segment Breakdown
Q2 2020 Q2 2021
Operating TCE TCE Operating TCE TCE 12% 12%
LR2
days1 (USD/day) (USD m) days1 (USD/day) (USD m)
LR2 LR1
545 27,465 15.0 546 21,832 11.9
TCE 23%
LR1 2,309 26,412 61.0 2,168 10,825 23.5 Non-pool Panamax
Q2 2021
Non-pool Panamax2 364 30,991 11.3 182 8,187 1.5 MR
MR 4,301 22,497 96.8 4,150 12,680 52.6 52% Handy
1%
Handy 1,218 18,819 22.9 1,154 10,549 12.2
Total 8,737 23,684 206.9 8,200 12,400 101.6
OPEX Segment Breakdown
Q2 2020 Q2 2021 10,000
7,981 7,815
Calendar OPEX3 OPEX Calendar OPEX3 OPEX
8,000
days (USD/day) (USD m) days (USD/day) (USD m) 927 948
LR2 546 6,297 3.4 546 7,063 3.9 6,000
LR1 2,093 6,542 13.7 1,924 7,354 14.1
4,000
Non-pool Panamax2 364 7,223 2.6 182 6,939 1.3 7,054 6,867
MR 3,731 5,852 21.8 3,731 7,049 26.3 2,000
Handy 1,183 5,928 7.0 1,183 6,592 7.8 0
Total 7,917 6,139 48.6 7,566 7,054 53.4 Q2 2021 Actual FY2021 Forecast
Opex G&A
1 Total operating days include operating days for vessels that are time chartered-in
2 Non-pool Panamax at the end of Q2 2021 consists of BW Lara and BW Clyde
8
3 OPEX includes vessel running costs and technical management feesPOOL ECONOMICS
Global commercial platform with chartering teams at strategic locations
Commission: Variable Commission: Fixed Hafnia’s 4 pools
LR/MR/Handy: LR/MR/Handy:
▪ 2.25% of net TCE ▪ USD 250/day per vessel
> 55,000 dwt
38 Owned 75
Specialised: Specialised: 37 External Vessels
▪ Small/City: 3% of net TCE ▪ Small/City: USD 300/day per vessel
▪ Intermediate: 2.75% of Pool ▪ Intermediate: USD 275/day per 47 Owned 68
Commission 40,000 – 54,999 dwt
net TCE vessel 21 External Vessels
Structure
25,000 – 39,999 dwt
13 Owned 21
8 External Vessels
20 External
20
< 20,000 dwt
Vessels
Pool Economics External Commercially Managed Vessels
Distribution Working #
Capital 100
to Pool
Participants Contribution1
80
60
▪ Distribution twice a month Specialised: USD 250,000 40
▪ Pool follows a basic pool point Handy: USD 300,000
distribution calculated based on 20
MR: USD 400,000
two core performance variables LR: USD 750,000
– fuel and time 0
2010 2011 2012 2013 2014 2015 2016 2017 2018 2019 2020 2021
LR MR Handy Specialised
1
9
As of July 2021INVESTMENT HIGHLIGHTS SUMMARY
Q2 OPEX and SG&A
Key value proposition
USD/day
12,000
7,981 8,564
9,000
1 Best commercial performance 6,000
3,000
-
Hafnia Peers
2 Lowest operating cost Hafnia opex
Hafnia G&A
Peers low (opex + G&A)
Peers high (opex + G&A)
YTD Funding Cost1
%
6%
3 Lowest cost of funding 4.5%
4% 3.2%
2%
USD 10.0 million in revenue from
4 0%
the pools in 1H 2021 Hafnia YTD Peers YTD
Hafnia funding cost Peers low Peers high
YTD Return on Equity
5 Focus on ESG Hafnia YTD Peers YTD
0%
-5%
-4.7%
Post Covid-19 rebound in
6 -10%
demand -11.5%
-15%
%
Hafnia ROE Peers high Peers low
1 Includes cost for vessels chartered-in Peers: Ardmore, Torm, Scorpio 10AGENDA
Q2 2021 Highlights/Overview
Industry Review & Outlook
ESG Overview
11OIL DEMAND SHOWING STEADY RECOVERY
Supply and demand of global oil Demand of oil products 2019-2022
m barrels/d m barrels/d
105 35
30 28.3 27.5 28.0
100 26.7 26.4 26.2
25.4
25 23.5
95 20
90 15
10 7.9 6.8 6.8
6.3 6.3 6.8
85 4.7 5.4
5
80 0
3Q19 4Q19 1Q20 2Q20 3Q20 4Q20 1Q21 2Q21 3Q21 4Q21 1Q22 2Q22 3Q22 4Q22 2019 2020 2021 2022
Gobal Oil Supply Global Oil Demand Pre-pandemic demand (3Q19) Naphtha Jet Fuel & Kerosene Motor Gasoline Gas / Diesel Oil
Apple Mobility Indices for ‘Driving’ • June 2021 saw oil demand surge to 96.8 mb/d, mainly due to increased
mobility in North America and Europe. However, July 2021 saw a decrease
180
month-on-month as rapid spread of Covid-19 Delta variant impaired
demand in large oil consuming countries such as China and Indonesia.
160
140 • Outlook for global economy remains positive, but downside risks grow
120 increasingly prevalent with new Covid restrictions. Oil demand is still
100 expected to recover for the remainder of the year.
80
• However, this recovery will be uneven, with jet fuel demand still expected
60 to be below pre-pandemic levels, owing to slow reopening of borders. On
40 the flipside, LPG/Ethane and naphtha use in the petrochemical sector have
20 already surpassed pre-pandemic levels.
0
Jan-20 Apr-20 Jul-20 Oct-20 Jan-21 Apr-21 Jul-21 • Oil production is also poised to increase to meeting rising demand, fuelled
largely with OPEC+ easing output cuts and higher output from other oil
Australia Brazil India United Kingdom United States
producing regions.
Source: Apple, IEA Research Aug 2021
12FLOATING AND LAND INVENTORY NORMALISING
OECD Total Oil Industry Stocks Clean Petroleum Products Cargo Volumes vs Tonne-Miles
m barrels m metric tons b tonne-miles
3300 249.0
243.3
100 231.6 250
3200
80 74.0 72.4
64.2
3100 200
60
3000
40
150
2900
20
2800
Jan Feb Mar Apr May Jun Jul Aug Sep Oct Nov Dec 0 100
Jul-19 Jul-20 Jul-21
Range 2016-2020 2021 2020 2019
Cargo Volumes (LHS) Tonne-miles (RHS)
Clean Petroleum Products Floating Storage
• OECD total industry stocks fell sharply in June by 50.3 mb after rising by
m barrels 11.2 mb in May, due mainly to crude inventories declining by more than
120
normal and product stocks drew counter-seasonally.
2020 2019
100
2021 • Crude inventories fell by 34.3 mb, mainly attributed to OECD Americas
80 which declined by 29.8 mb due to higher refinery runs in the United
States. Product stocks usually build in June, but saw inventories decline by
60 18.3 mb, largely attributed to motor gasoline stock which fell by 9.1 mb.
40 • Cargo volumes for clean petroleum products have steadily recovered from
the effect of the pandemic, reaching 63.8 mmt in July 2021 from 56.0 mmt
20
in July 2020. Tonne-miles for clean petroleum product have also been
0
steadily increasing, reaching 245.8 billion tonne-miles in July 2021.
Jan Feb Mar Apr May Jun Jul Aug Sep Oct Nov Dec
13
Source: IEA Research Aug 2021, VortexaREFINERY SHAKE-UP BOOSTS TONNE-MILE DEMAND
Global Refinery Crude Throughput June 2021 Refinery Utilisation
m barrels/d %
85 100 89%
81% • Following a large increase of 1.6 mb/d in June, global
79%
80 80 70% refinery throughput slowed in July, increasing by only 0.8
mb/d month on month, as new waves of Covid-19
75 60 hindered fuel demand.
70 40 • East of Suez Crude throughput is forecasted to reach
record level at almost 39mb/d in 2022, mainly attributed
65 20 to China’s increase in throughput rates, which reported
record throughput in June.
60 0
1Q20 2Q20 3Q20 4Q20 1Q21 2Q21 3Q21 4Q21 OECD OECD OECD Asia OECD Total
Americas Europe Oceania
• There is a continued trend of refinery closures in Europe,
US and Australia. This is mainly due to weak refining
World Refinery Capacity Additions1 margins and overseas competition, which prompt
owners to convert refineries to oil refined products
m barrels/d import and storage terminals.
1.5
1 • According to IEA, global average refinery utilisation rates
will stand around 78% of capacity in 2022, limiting the
0.5 possibility of refinery margins recovering from 2020 and
remain a high likelihood of further capacity closures
0
• China and Middle East are leading in net capacity
-0.5 additions with new additions and expansions. Ultimately,
we can expect refining activities to cluster in regional
-1 hubs and an increase in seaborne volumes of refined
OECD OECD OECD Asia FSU Non-OECD China Other Asia Latin Middle Africa
Americas Europe Oceania Europe America East
products and tonne-miles.
2020 2021 2022 2023 2024 2025 2026
1Comprises of (1) new refinery projects or expansions to existing facilities including condensate splitter additions, (2) gross capacity additions to coking, hydrocracking, residue hydrocracking, visbreaking, FCC or RFCC capacity and (3) additions to
hydrotreating and hydrodesulphurisation capacity. 14
Source: IEA Research Aug 2021, IEA Oil 2021 analysis and forecast to 2026GLOBAL PRODUCT TANKER FLEET
Orderbook % Fleet (DWT) Y-o-Y Change in World Seaborne Trade
% of fleet %
70 10
60
5
50
40 0
30 -5
20
-10
10
0 -15
2005 2006 2007 2008 2009 2010 2011 2012 2013 2014 2015 2016 2017 2018 2019 2020 2021 2019 2020 2021 2022
Product Tanker Orderbook Crude Tanker Orderbook Total Dry Bulk Crude Products
Crude and Product Tanker Fleet Development
m DWT, end year • Outlook for product tanker sector remains positive, driven mainly
700 Crude Tanker Fleet 20%
by increase in seaborne trade for refined products and low supply
CAGR (2016-2021): 4.2%
600 growth
Product Tanker Fleet
500 CAGR (2016-2021): 3.9% 15%
• Product tanker orderbook now stands at only 7% of existing fleet,
400
10% one of the lowest ever level. Net of scrapping, product fleet
300 growth is expected to be less than 1% for the next two years.
200 5%
• Furthermore, increased emissions and efficiency targets put
100
continued pressure on older vessels, accelerating turnover of
0 0% global fleet and slowing vessel supply
2005 2006 2007 2008 2009 2010 2011 2012 2013 2014 2015 2016 2017 2018 2019 2020 2021
• As a result, we can expect product tanker fleet utilisation to
Crude Tanker Fleet (LHS) Product Tanker Fleet (LHS) Product Tanker Fleet Growth (RHS)
increase in the coming years.
Source: Clarksons Research, July 2021 15RATES REMAIN BELOW 5-YEAR AVERAGE
LR2 LR1
USD/day USDm USD/day USDm
100,000 50 70,000 35
60,000 30
80,000 40
50,000 25
60,000 30
40,000 20
40,000 20 30,000 15
20,000 10
20,000 10
10,000 5
0 0 0 0
Aug-16 Feb-17 Aug-17 Feb-18 Aug-18 Feb-19 Aug-19 Feb-20 Aug-20 Feb-21 Aug-16 Feb-17 Aug-17 Feb-18 Aug-18 Feb-19 Aug-19 Feb-20 Aug-20 Feb-21
Earnings (LHS) Last 5 year average (LHS) Earnings (LHS) Last 5 year average (LHS)
5 year old vessel values (RHS) Last 5 year average (RHS) 5 year old vessel values (RHS) Last 5 year average (RHS)
MR Handy
USD/day USDm USD/day USDm
40,000 35 50,000 30
30 25
40,000
30,000
25
20
20 30,000
20,000 15
15 20,000
10
10
10,000
10,000 5
5
0 0 0 0
Aug-16 Feb-17 Aug-17 Feb-18 Aug-18 Feb-19 Aug-19 Feb-20 Aug-20 Feb-21 Aug-16 Feb-17 Aug-17 Feb-18 Aug-18 Feb-19 Aug-19 Feb-20 Aug-20 Feb-21
Earnings (LHS) Last 5 year average (LHS) Earnings (LHS) Last 5 year average (LHS)
5 year old vessel values (RHS) Last 5 year average (RHS) 5 year old vessel values (RHS) Last 5 year average (RHS)
16
Source: Clarksons Research, July 2021AGENDA
Q2 2021 Highlights/Overview
Industry Review & Outlook
ESG Overview
17HAFNIA’S ESG STRATEGY
IMO’s Carbon Intensity Targets
7.61
8
7 6.20 6.04
5.73 5.57
6 4.78
4.47
gms CO2 / DWT - NM
5
4
3 5.83 5.70
2 5.6% below the 4.47 Aim for two
trajectory years in advance
1
0
2008 2019 2020 2021 2022 2023 2024 2025 2026 2027 2028 2029 2030
Hafnia's Status Hafnia's Projected IMO's Target Carbon Intensity
Hafnia is committed to…
Avoiding pollution Reducing Emissions Reducing Plastic Waste
to Sea to Air and Garbage
We believe in protecting our We believe in reducing our
We believe in ensuring clean
oceans and seas from environmental impact and
seas and reducing plastic
pollution arising from our complying with all global
waste on board
operations emissions regulations
How we strive to realise our belief?
Zero non-compliance with
Strict compliance to MARPOL
Zero spills to sea MARPOL Annex V (garbage)
Annex VI and local regulations
regulations
Zero non-compliance with IMO Decrease Hafnia fleet CO2 intensity
Reduce plastic waste by 2% below
Ballast Water Management by 3% per year on average until
2020 levels
Convention 2030
Zero non-compliance with
MARPOL Annex I (oil), II (noxious Stay ahead of IMO Carbon Avoid use of single use plastic
liquid substances), and IV (sewage) intensity decrease trajectory products
regulations
18STRONG FOCUS ON CORPORATE GOVERNANCE AND
ALIGNED INCENTIVES
Board of Directors Nomination Committee
• The Board of Directors is responsible for the overall management of the Company and may exercise all the • Recently established nomination
powers of the Company not reserved to the Company's shareholders by its Bye-laws or under Bermuda law. committee currently comprising
three members to assist the
• If there is a vacancy of the Board of Directors occurring as a result of the death, disability, disqualification or
Board of Directors in evaluation
resignation of any Director or as a result of an increase in the size of the Board of Directors, the Board of
of operational effectiveness and
Directors has the power to appoint a Director to fill the vacancy.
suitability.
• As of July 2021, the Company has a Board of Directors comprising five Directors.
• The nomination committee will
also be responsible for Board
Audit Committee Remuneration Committee succession plans by nominating
candidates for the election as
• The members are independent of the Company • The primary purpose of the remuneration Directors and as chairman of the
whose primary purpose is to act as a committee is to assist the Board of Directors in Board of Directors and for
preparatory and advisory committee for the discharging its duty relating to determining the nominating members of the
Board of Directors in monitoring the Group's Management's compensation. The nomination committee, as well as
internal control of the risk management and remuneration committee shall report and make making recommendations for
financial reporting. This includes but is not recommendations to the Board of Directors, remuneration of these persons.
limited to: but the Board of Directors retains responsibility
i. All critical accounting policies and practices; for implementing such recommendations.
ii. Quality, integrity and control of the Group's
• Any remuneration to be paid to the members
financial statements and reports;
of the remuneration committee is to be
iii. Compliance and regulatory requirements;
decided at the annual general meeting.
iv. Qualifications and independence of the
external auditors; and
v. Performance of the internal and external
audit.
• The audit committee reports and makes
recommendations to the Board of Directors,
but the Board of Directors retains responsibility
for implementing such recommendations.
19LOOKING AHEAD…
Outlook for global economy on track to improve for remaining of 2021 and into 2022, due mainly
to rising vaccination rates and easing of social distancing measures which will help spur economic
activities
We anticipate product tankers to lead tanker market recovery, mainly attributed to low
orderbook, increasing demand for refined products and the dislocation between refineries and
consumers
Shipping is experiencing increasing pressure to decarbonise its operations and to reduce overall
emissions. Hafnia strives to reduce our carbon footprint, through implementing vessel
optimisation measures and seeking out potential innovations or collaborations
We believe further consolidation is needed within the product tanker sector. Hafnia will continue
to search for such opportunities, to fully unleash value and synergies from additional operational
scale and to improve our overall competitiveness
20CONTACTS
CEO CFO EVP EVP, IR, Research and
Commercial Performance Management
MIKAEL SKOV PERRY VAN ECHTELT JENS CHRISTOPHERSEN THOMAS ANDERSEN
Email: ms@hafniabw.com Email: pve@hafniabw.com Email: jch@hafniabw.com Email: tha@hafniabw.com
21THANK YOU www.hafniabw.com
You can also read