Investment Outlook for 2021: The Risks to Goldilocks - Jan van Eck, CEO Shawn Reynolds, Portfolio Manager Charles Cameron, Deputy Portfolio ...
←
→
Page content transcription
If your browser does not render page correctly, please read the page content below

May 2021

Investment Outlook

Investment Outlook for 2021:
The Risks to Goldilocks
 Jan van Eck, CEO
 Shawn Reynolds, Portfolio Manager
 Charles Cameron, Deputy Portfolio Manager

Investment Outlook for 2021: The Risks to Goldilocks

Today’s Speakers
                                                                                                      vaneck.com/subscribe

                   Jan van Eck                         Shawn Reynolds         Charles Cameron
                      CEO                              Portfolio Manager   Deputy Portfolio Manager

                                                                                                                        2
Investment Outlook for 2021: The Risks to Goldilocks
Now What?
vaneck.com/subscribe
“Goldilocks” Scenario. The mainstream, high-probability consensus.
• Rate increases pause between 1.5 and 2%; stock markets continue to make new highs
• Economic growth moderates, China is already tapering; U.S. spending also tapers
• Growth stocks still shine. Gold.
“Wage Inflation” Scenario. Controversial.
• Commodity prices already in bull market.
• But wage inflation is uncertain. Wage inflation is the driver of a longer-lasting inflation and can be hard to extinguish. Won’t know until
late 2022. Value does well. Gold.
“Higher Rate Surprise” Scenario. Big surprise.
• Tremendous stimulus drives interest rates between 2% and 2.25% by the end of 2021, we believe. This is more likely than the market
expects.
• With rising rates, bonds will fall further. May be okay for equities but potentially bearish.
A Goldilocks economy is an economy that is not so hot that it causes inflation and not so cold that it causes a recession. 3
Investment Outlook for 2021: The Risks to Goldilocks

Goldilocks… Rolling Recovery: Asia, U.S., Europe
                                                                                                                                                                                                                 vaneck.com/subscribe

J.P. Morgan Composite PMI

                60

                55

                50

                45
  Index Level

                40

                35

                30

                25

                20

The Purchasing Managers Index (PMI) is a measure of the prevailing direction of economic trends. The value and movements in the PMI and its components can provide useful insight to business decision makers,
market analysts, and investors and is a leading indicator of overall economic activity. A reading above 50 indicates expansion, and a reading below 50 indicates contraction.

Source: Bloomberg. Data as of April 30, 2021. Past performance is not a guarantee of future results. Please see end of presentation for more information.                                                                          4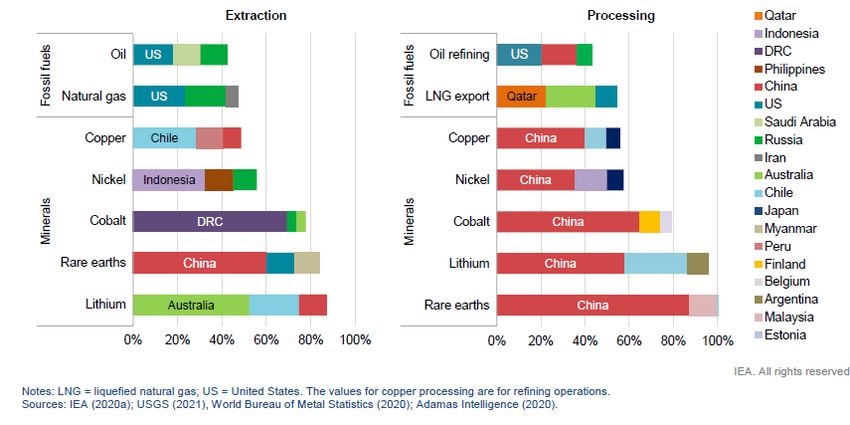
Investment Outlook for 2021: The Risks to Goldilocks
Have I Already Missed the Inflation Trade?
vaneck.com/subscribe
The Commodities Rebound (Copper, WTI, Steel)
Copper WTI Crude Hot Rolled Coil Steel
180
160
140
Price (Indexed at 100)
120
100
80
60
40
20
0
Jun-11
Jun-12
Jun-13
Jun-14
Jun-15
Jun-16
Jun-17
Jun-18
Jun-19
Jun-20
Mar-11
Mar-12
Mar-13
Mar-14
Mar-15
Mar-16
Mar-17
Mar-18
Mar-19
Mar-20
Mar-21
Sep-11
Dec-11
Sep-12
Dec-12
Sep-13
Dec-13
Sep-14
Dec-14
Sep-15
Dec-15
Sep-16
Dec-16
Sep-17
Dec-17
Sep-18
Dec-18
Sep-19
Dec-19
Sep-20
Dec-20
Source: Bloomberg. Data as of May 21, 2021. Prices for the commodities listed are determined using the generic first futures contracts. West Texas Intermediate is the main oil benchmark for North America as it is
sourced from the United States, primarily from the Permian Basin. The oil comes mainly from Texas. It then travels through pipelines where it is refined in the Midwest and the Gulf of Mexico. The main delivery point for
physical exchange and price settlement for WTI is Cushing, Oklahoma.
Past performance is not a guarantee of future results. Please see end of presentation for more information. 5Investment Outlook for 2021: The Risks to Goldilocks
No Wage Inflation Camp: Japan, Demographics
vaneck.com/subscribe
10 Year Nominal Bond Yields in Developed Markets, %
6
5
4
3
Yield (%)
2
1
0
-1
U.S. Japan Germany
Source: Bloomberg. Data as of May 21, 2021. For each country listed, the data shown is the generic 10YR government bonds. Past performance is not a guarantee of future results. Please see end of presentation for
more information. 6Investment Outlook for 2021: The Risks to Goldilocks
No Wage Inflation Camp: “Don’t You Get Disruption”?
vaneck.com/subscribe
Technology, Innovation Lead to Deflation Concern (“The Ark View”)
40%
30%
Growth
20%
Momentum
10%
Return
0%
-10% Small-Cap
Low Volatility
-20% High Dividend Yield
Value
-30%
-40%
May-11 May-12 May-13 May-14 May-15 May-16 May-17 May-18 May-19 May-20 May-21
Factor types are measured by using ETF proxies for major indices relatives to the S&P 500 Index. Growth is measured using the iShares Russell 1000 Growth ETF which tracks the Russell
1000 Growth Index; Value is measured using the iShares Russell 1000 Value ETF which tracks the Russell 1000 Value Index; Momentum is measured using the iShares MSCI USA Momentum
Factor ETF which tracks the MSCI USA Momentum SR Variant; Small-Cap is measured using the iShares Core S&P Small-Cap ETF which tracks the S&P SmallCap 600 Index; Low Volatility
is measured using the iShares MSCI USA Min Vol Factor ETF which tracks the MSCI USA Minimum Volatility (USD) Index; High Dividend Yield is measured using the Vanguard High Dividend
Yield ETF which tracks the FTSE® High Dividend Yield Index Information should not be construed as a recommendation or solicitation to buy or sell any securities shown above.
Source: Koyfin. Data as of May 21, 2021. Factor types defined by Koyfin using specific ETFs relative to the S&P 500 Index. Past performance is not a guarantee of future results. Please see end of presentation for 7
more information.Investment Outlook for 2021: The Risks to Goldilocks
Pro-Inflation View: And this WON’T Cause Problems??
vaneck.com/subscribe
“Twin” Macro Issues Overwhelm Technology’s Deflationary Impact
When the US runs large fiscal and current account deficits, historically, USD tends to suffer
USD vs Developed Markets (DM) FX and US Twin Deficits
180 5
160
0
USD Trade Weighted Index
US Twin Balance, % GDP
140
-5
120
100
-10
80
-15
60
40 -20
May-86
May-99
May-12
Jul-14
Mar-97
Jul-01
Feb-09
Mar-10
Feb-22
Mar-23
Apr-11
Jul-75
Jul-88
Feb-83
Mar-84
Feb-96
Apr-98
Oct-04
Oct-17
Oct-78
Apr-85
Oct-91
Nov-92
Dec-93
Nov-05
Dec-06
Nov-18
Dec-19
Nov-79
Dec-80
Jun-00
Aug-02
Sep-03
Jan-08
Jun-13
Aug-15
Sep-16
Jan-21
Jun-74
Aug-76
Sep-77
Jan-82
Jun-87
Aug-89
Sep-90
Jan-95
USD vs DM FX US Twin Balance, % GDP (2y lag)
Economies that have both a fiscal deficit and a current account deficit are often referred to as having "twin deficits.“ The trade-weighted US dollar index, also known as the broad index, is a measure of the value of the
United States dollar relative to other world currencies. It is a trade weighted index that improves on the older U.S. Dollar Index by using more currencies and the updating the weights yearly. Please see end of
presentation for more information. 8
Source: Bloomberg. Data as of March 31, 2021. Past performance is not a guarantee of future results.Investment Outlook for 2021: The Risks to Goldilocks
Inflation Investments In 2000s
vaneck.com/subscribe
Returns of Real Assets (Commodities, Gold, Natural Resources Equities) relative to Stocks
December 31, 2002 to December 31, 2007
Gold Bullion U.S. Stocks Commodities Natural Resources U.S. Bonds
350
December 31, 2002 to Total +/- (vs.
Annualized
300 December 31, 2007 Return Stocks)
250
Natural Resources 300.77% 217.91% 31.98%
Cumulative Return (%)
200
Gold Bullion 139.53% 56.67% 19.08%
150
100 Commodities 94.76% 11.90% 14.25%
50
U.S. Stocks 82.86% -- 12.82%
0
-50 U.S. Bonds 24.17% -58.70% 4.42%
Jun-03
Jun-04
Jun-05
Jun-06
Jun-07
Apr-03
Apr-04
Dec-02
Aug-03
Aug-04
Apr-05
Aug-05
Apr-06
Apr-07
Feb-03
Dec-03
Feb-04
Dec-04
Feb-05
Dec-05
Aug-06
Aug-07
Feb-06
Dec-06
Feb-07
Dec-07
Oct-03
Oct-04
Oct-05
Oct-06
Oct-07
Source: Bloomberg. Data as of December 31, 2007. This time frame was selected to show performance of selected asset classes during the last period of inflation in the U.S. Commodities are measured using the Bloomberg
Commodity Index; Natural Resources are measured using the S&P Global Natural Resources Index; Gold is measured using the spot price per troy ounce; U.S. Stocks are measured using the S&P 500 Index; U.S. Bonds are
measured using the Bloomberg Barclays US Aggregate Bond Index. Past performance is not a guarantee of future results. Please see end of presentation for more information. 9Investment Outlook for 2021: The Risks to Goldilocks
Inflation Investments In this Cycle
vaneck.com/subscribe
Returns of Real Assets (Commodities, Gold, Natural Resources Equities) relative to Stocks
June 30, 2020 to May 21, 2021
Gold Bullion U.S. Stocks Commodities Natural Resources U.S. Bonds
60 June 30, 2020 to Total +/- (vs.
Annualized
May 21, 2021 Return Stocks)
50
Natural Resources 50.97% 15.01% 58.82%
Cumulative Return (%)
40
30 Commodities 39.99% 4.03% 45.90%
20 U.S. Stocks 35.96% -- 41.20%
10
Gold Bullion 5.63% -30.33% 6.35%
0
U.S. Bonds -1.37% -37.33% -1.54%
-10
Jun-20 Jul-20 Aug-20 Sep-20 Oct-20 Nov-20 Dec-20 Jan-21 Feb-21 Mar-21 Apr-21
Source: Bloomberg. Data as of May 21, 2021. Commodities are measured using the Bloomberg Commodity Index; Natural Resources are measured using the S&P Global Natural Resources Index; Gold is measured
using the spot price per troy ounce; U.S. Stocks are measured using the S&P 500 Index; U.S. Bonds are measured using the Bloomberg Barclays US Aggregate Bond Index. Past performance is not a guarantee of
future results. Please see end of presentation for more information. 10Investment Outlook for 2021: The Risks to Goldilocks
Supply Response, Cost Maintenance Aiding Recovery
vaneck.com/subscribe
E&Ps Spending Less on New Production
Capital expenditures (capex) came down dramatically during the pandemic, with only modest increases expected in 2021
Oil price breakevens have remained relatively steady and should help capable producers get back to positive free cash flow generation, we believe
U.S. E&P Capex
200
180
160
140
U.S. E&P Capex ($B)
120
100
80
60
40
20
0
03 04 05 06 07 08 09 10 11 12 13 14 15 16 17 18 19 20 21e
Source: Evercore ISI. Data as of December 2020. “E&P” stands for exploration and production. An exploration & production (E&P) company is in a specific sector within the oil and gas industry. Exploration and
production is the early stage of energy production, which includes searching and extracting oil and gas. An E&P company finds and extracts the raw materials used in the energy business. Capital expenditures
represent money spent by a business or organization on acquiring or maintaining fixed assets, such as land, buildings, and equipment.
11Investment Outlook for 2021: The Risks to Goldilocks
Commitment To Financial Prudence Paying Off
vaneck.com/subscribe
Miners Lead By Example
Balance sheets remain healthy and, in particular, in the gold and diversified mining sectors
We believe that investors should continue to see capital return programs improve as a means of rewarding investors
“Big 6”* Mining Capital Return & Dividend Yield
$40 7.0%
Special Dividends
$35 Share Buybacks
6.0%
Dividends
$30
Total Capital Return ($B)
Dividend Yield (RHS) 5.0%
Dividend Yield (Average)
$25
4.0%
$20
3.0%
$15
2.0%
$10
$5 1.0%
$0 0.0%
1997 1998 1999 2000 2001 2002 2003 2004 2005 2006 2007 2008 2009 2010 2011 2012 2013 2014 2015 2016 2017 2018 2019 2020
The reader should not assume that an investment in the securities identified was or will be profitable. Not a recommendation to buy or sell a security.
Source: VanEck, Bloomberg. Data as of September 2020. *“Big 6” mining companies include Anglo American, BHP, Glencore, Rio Tinto, Teck Resources and Vale. Past performance is not a guarantee of future
results.
12Investment Outlook for 2021: The Risks to Goldilocks
Resource Transition Could Total ~$110 Trillion
vaneck.com/subscribe
A Multi-Decade Transition In Its Early Beginnings
Though the world appears aligned in terms of the need for sustainability, there is still much to be done in terms of policy and action
The outlook for a number of resources related sectors should be supported by long-term carbon-reduction policies/plans
Annual Capital Expenditures by Project Category Estimated Cumulative Spending by Category to Reach Net-Zero
Oil & Gas Renewables (Wind & Solar) Trillions
$800 Power Transmission $18.0
$700 Wind $11.6
Annual Capital Expenditures ($B)
$600 Solar $7.5
Nuclear & Hydro $3.3
$500
Battery Manufacturing & Metals $3.0
$400
Energy Storage $2.1
$300
Low Carbon Hydrogen $1.1
$200
Thermal Power $1.1
$100 Carbon Removals $0.9
$0 Other Renewables $0.8
2014 2015 2016 2017 2018 2019 2020 2021e
Source: Rystad Energy (right), Wood Mackenzie (left). Data as of May 2021. Net zero is a target of completely negating the amount of greenhouse gases produced by human activity, to be achieved by reducing
emissions and implementing methods of absorbing carbon dioxide from the atmosphere. Capital expenditures represent money spent by a business or organization on acquiring or maintaining fixed assets, such as
land, buildings, and equipment. 13Investment Outlook for 2021: The Risks to Goldilocks
“Green” Metals Seemingly One Of The Primary Beneficiaries
vaneck.com/subscribe
Transitions Are Metals Intensive
Metals remain a key player in the transition resource space
Supply risk and end use varies—however, opportunity for growth on the whole still exists, we believe
Minerals Used in Electric Vehicles Minerals Used in Clean Energy Technologies
250
Natural gas
Copper
200 Others
Coal Zinc
Zinc
Manganese
Rare earths Nuclear
150 Chromium
kg/vehicle
Lithium
Nickel
Cobalt Solar PV
Rare earths
100 Manganese
Onshore wind Molybdenum
Nickel
Others
50 Copper
Offshore wind Cobalt
Graphite
Silicon
0 2,000 4,000 6,000 8,000 10,000 12,000 14,000 16,000 18,000
0
kg/MW
Electric car Conventional car
Source: IEA. Data as of May 2021. Green metals and minerals are those considered vital to the manufacturing of renewable (or "green") energy, and/or associated energy efficiency, technologies. Please see end of
presentation for more information. 14Investment Outlook for 2021: The Risks to Goldilocks
Processing the Transition Risks
vaneck.com/subscribe
Production of Needed Minerals More Geographically Concentrated
The location of vital materials for transition efforts raises geopolitical risk concern and could add to overall cost
Processing of critical elements heavily skewed within China which raises reporting and overall climate risk issues
Top 3 Producing Countries of Selected Minerals and Fossil Fuels (2019)
Source: IEA. Data as of May 2021. Please see end of presentation for more information.
15Index Descriptions
vaneck.com/subscribe
All indices listed are unmanaged indices and include the reinvestment of all dividends, but do not reflect the payment of transaction costs, advisory fees or expenses that are associated with an investment in
the Strategy. An index’s performance is not illustrative of the Strategy’s performance. Indices are not securities in which investments can be made.
The J.P. Morgan Global Composite PMI™ is produced by IHS Markit in association ISM and IFPSM. Global composite PMI indices are compiled by IHS Markit from responses to monthly questionnaires sent to companies in
manufacturing and services survey panels in over 40 countries (see table, right for full coverage), totaling around 27,000 companies. These countries account for 89% of global gross domestic product (GDP).
The Bloomberg Barclays US Treasury Index measures USD-denominated, fixed-rate, nominal debt issued by the U.S. Treasury.
The trade-weighted US dollar index, also known as the broad index, is a measure of the value of the United States dollar relative to other world currencies. It is a trade weighted index that improves on the older U.S. Dollar
Index by using more currencies and the updating the weights yearly.
Factor types are measured by using ETF proxies for major indices relatives to the S&P 500 Index. Growth is measured using the iShares Russell 1000 Growth ETF which tracks the Russell 1000 Growth Index (The Russell
1000® Growth Index measures the performance of the large- cap growth segment of the US equity universe. It includes those Russell 1000® companies with higher price-to-book ratios and higher forecasted growth values.
The Russell 1000 Index is a stock market index that tracks the highest-ranking 1,000 stocks in the Russell 3000 Index, which represent about 90% of the total market capitalization of that index); Value is measured using the
iShares Russell 1000 Value ETF which tracks the Russell 1000 Value Index (The Russell 1000 Value Index measures the performance of the large-cap value segment of the U.S. equity universe. It includes those Russell
1000 companies with lower price-to-book ratios and lower expected and historical growth rates. The Russell 1000 Index is a stock market index that tracks the highest-ranking 1,000 stocks in the Russell 3000 Index, which
represent about 90% of the total market capitalization of that index); Momentum is measured using the iShares MSCI USA Momentum Factor ETF which tracks the MSCI USA Momentum SR Variant Index (The MSCI USA
Momentum SR Variant Index aims to reflect the performance of the MSCI USA Momentum Index, wherein all changes driven by the index rebalances of the MSCI USA Momentum Index are distributed over three days leading
into the rebalancing effective date); Small-Caps is measured using the iShares Core S&P Small-Cap ETF which tracks the S&P SmallCap 600 Index (The S&P SmallCap 600 Index (S&P 600) is a stock market index
established by Standard & Poor's. It covers roughly the small-cap range of American stocks, using a capitalization-weighted index. To be included in the index, a stock must have a total market capitalization that ranges from
$700 million to $3.2 billion at the time of addition to the index); Low Volatility is measured using the iShares MSCI USA Min Vol Factor ETF which tracks the MSCI USA Minimum Volatility (USD) Index (The MSCI USA
Minimum Volatility (USD) Index aims to reflect the performance characteristics of a minimum variance strategy applied to the large and mid cap USA equity universe. The index is calculated by optimizing the MSCI USA Index,
its parent index, in USD for the lowest absolute risk (within a given set of constraints)); High Dividend Yield is measured using the Vanguard High Dividend Yield ETF which tracks the FTSE® High Dividend Yield Index (The
FTSE® High Dividend Yield Index which measures the investment return of common stocks of companies characterized by high dividend yields). Information should not be construed as a recommendation or solicitation to buy
or sell any securities shown above.
Bloomberg Commodity Index is designed to be a highly liquid, diversified benchmark for commodities as an asset class. The Bloomberg Commodity Index is composed of futures contracts on 20 physical commodities.
S&P® Global Natural Resources Index includes 90 of the largest publicly traded companies in natural resources and commodities businesses that meet specific investability requirements, offering investors diversified and
investable equity exposure across three primary commodity-related sectors: agribusiness, energy, and metals & mining which tracks the global natural resources and commodities businesses.
The S&P 500 Index is a product of S&P Dow Jones Indices LLC and/or its affiliates and has been licensed for use by Van Eck Associates Corporation. Copyright © 2018 S&P Dow Jones Indices LLC, a division of S&P Global,
Inc., and/or its affiliates. All rights reserved. Redistribution or reproduction in whole or in part are prohibited without written permission of S&P Dow Jones Indices LLC. For more information on any of S&P Dow Jones Indices
LLC’s indices please visit www.spdji.com. S&P® is a registered trademark of S&P Global and Dow Jones® is a registered trademark of Dow Jones Trademark Holdings LLC. Neither S&P Dow Jones Indices LLC, Dow Jones
Trademark Holdings LLC, their affiliates nor their third party licensors make any representation or warranty, express or implied, as to the ability of any index to accurately represent the asset class or market sector that it
purports to represent and neither S&P Dow Jones Indices LLC, Dow Jones Trademark Holdings LLC, their affiliates nor their third party licensors shall have any liability for any errors, omissions, or interruptions of any index or
the data included therein.
The Bloomberg Barclays US Aggregate Bond Index measures the investment grade, US dollar-denominated, fixed-rate taxable bond market. The Index includes treasuries, government-related and corporate securities,
mortgage backed securities (agency fixed-rate and hybrid ARM pass-throughs), ABS and collateralized mortgage backed securities (agency and nonagency).
16vaneck.com/subscribe
THIS MATERIAL MAY ONLY BE PROVIDED TO YOU BY VANECK AND IS FOR YOUR PERSONAL USE ONLY AND MUST NOT BE PASSED ON TO THIRD PARTIES WITHOUT THE
PRIOR EXPRESS WRITTEN CONSENT OF VANECK. IF YOU HAVE NOT RECEIVED THIS MATERIAL FROM VANECK, YOU ARE HEREBY NOTIFIED THAT YOU HAVE RECEIVED IT
FROM A NON-AUTHORIZED SOURCE THAT DID NOT ACT ON BEHALF OF VANECK AND THAT ANY REVIEW, USE, DISSEMINATION, DISCLOSURE OR COPYING OF THIS MATERIAL
IS STRICTLY PROHIBITED. BEFORE MAKING AN INVESTMENT DECISION, PLEASE CONSULT A QUALIFIED INVESTMENT AND TAX ADVISOR.
This material does not constitute an offer to sell or solicitation to buy any security. This material and the information provided herein are not directed at or intended for distribution to any person
(or entity) who is a citizen or resident of (or located or established in) any jurisdiction where the distribution of these materials and/or the purchase or sale of interests of a Strategy would be
contrary to applicable law or regulation or would subject a Strategy to any registration or licensing requirement in such jurisdiction. Persons who wish to review this material are required to inform
themselves about and to observe any legal or regulatory restrictions which may affect their eligibility to make an investment in a Strategy. Professional advice should be sought in cases of
doubt. Any projections, market outlooks or estimates in this material are forward-looking statements and are based upon certain assumptions that are solely the opinion of VanEck. Any
projections, outlooks or assumptions should not be construed to be indicative of the actual events which will occur. Further, any information regarding portfolio composition, portfolio composition
methodology, investment process or limits, or valuation methods of evaluating companies and markets are intended as guidelines which may be modified or changed by VanEck at any time in its
sole discretion without notice.
Any projections, market outlooks or estimates in this material are forward-looking statements and are based upon certain assumptions that are solely the opinion of VanEck. Any projections,
outlooks or assumptions should not be construed to be indicative of the actual events which will occur. Further, any information regarding portfolio composition, portfolio composition
methodology, investment process or limits, or valuation methods of evaluating companies and markets are intended as guidelines which may be modified or changed by VanEck at any time in its
sole discretion without notice. Forecasts, estimates, and certain information contained herein are based upon proprietary research and the information contained in this material is not intended to
be, nor should it be construed or used as investment, tax or legal advice. References to specific securities and their issuers or sectors are for illustrative purposes only and are not intended and
should not be interpreted as recommendations to purchase or sell such securities or gain exposure to such sectors. The Strategy may or may not own the securities or be exposed to the sectors
referenced and, if such securities are owned or exposure maintained, no representation is being made that such securities will continue to be held or exposure maintained. Non-VanEck
proprietary information contained herein has been obtained from sources believed to be reliable, but not guaranteed.
An investment in a Strategy may be subject to risk which includes, among others, preferred securities, convertible securities, foreign securities, credit, interest rate, floating rate, floating rate
LIBOR, subordinated obligations, investing in REITs, small- and medium-capitalization companies, real estate, utilities, communications, market, operational, call, index tracking, authorized
participant concentration, no guarantee of active trading market, trading issues, passive management, fund shares trading, premium/discount risk and liquidity of fund shares, non-diversified and
concentration risks, all of which may adversely affect a Strategy. Small- and medium-capitalization companies may be subject to elevated risks.
All investing is subject to risk, including the possible loss of the money you invest. As with any investment strategy, there is no guarantee that investment objectives will be met
and investors may lose money. Diversification does not ensure a profit or protect against a loss in a declining market. Past performance is no guarantee of future results.
Van Eck Securities Corporation, Distributor, 666 Third Avenue, New York, NY 10017
17Gain More Insights at: vaneck.com/subscribe
You can also read