LONDON MARKETS September 2021 - London office property performance and key themes - Gerald Eve

Page created by Danny Thornton
 
CONTINUE READING
LONDON MARKETS September 2021 - London office property performance and key themes - Gerald Eve
LONDON MARKETS
London office property
performance and key themes

September 2021

   Read more

geraldeve.com
LONDON MARKETS September 2021 - London office property performance and key themes - Gerald Eve
SUMMARY                 ECONOMY   DEMAND            AVAILABILITY            DEVELOPMENT      INVESTMENT        CONTACT

LONDON OFFICE MARKET SUMMARY Q2 2021

           Green shoots of improved leasing activity were evident in
           Q2 and take-up reached 1.9m sq ft. This was an uplift of 36% on
           Q1 and almost double the recent trough in Q4 2020.
                                                                                     1.9   m
                                                                                           sq ft
                                                                                     Take-up
                                                                                                                  9.3%
                                                                                                                  Availability rate
                                                                                                                                         14.2       m
                                                                                                                                                    sq ft
                                                                                                                                         Under construction
                                                                                                                                                                £2.2bn
                                                                                                                                                                Investment volume
                                                                                     Q2 2021                      Q2 2021                Q2 2021                Q2 2021
           Central London availability continued to rise and hit 9.4% in
           Q2, but there has been a clear deceleration in the rate of space
           being brought to market.

           We expect the rate of development activity will cool in the
           short run given the uncertainty in the occupier market and
           following a sharp increase in building costs. Annual growth of
           material costs reached 7% in July 2021, exacerbated by labour
           shortages in the construction sector.

           Rents have softened in Soho and Midtown. It is expected
           there will be further decline in rents over the next six months,
           particularly in poor quality stock that is not fit for hybrid
           work models.

           Investment activity ticked up to £2.2bn in Q2 after a slow start to
           the year of only £1.9bn in Q1. There are now numerous available
           investment assets in the market and we expect investment
           volumes will pick up markedly in the second half of the year.

geraldeve.com
SUMMARY                   ECONOMY                         DEMAND                              AVAILABILITY                                                                            DEVELOPMENT                                                                          INVESTMENT                                                    CONTACT

THE LONDON ECONOMY

GROSS VALUE ADDED (GVA)
                                                 LONDON FLASH INDICATORS – PMI JULY 2021
                                                                                                                      Central London, visits to workplace,                                                                                                                                                             TfL Journeys by type of transport
                                                                                                                      difference from pre-pandemic baseline                                                                                                                                                            Source: Transport for London
  London

            -9.3%
             2020
                           7.2%
                           2021
                                   6.4%
                                   2022
                                                 60.5                                                                 Sources: Google Mobility Data, Gerald Eve

                                                                                                                      %
                                                                                                                                                                                                                                                                                                                       Journeys, millions
                                                                                                                                                                                                                                                                                                                       200
                                                                                                                                                                                                                                                                                                                                                                                              1st                                                    3rd
                                                 Business Activity Index                                                10                                                                                                                                                                                             180                                                                    lockdown                                               lockdown
                                                                                                                                                                                                                                                                                                                                                                                                                                                     trough
                                                 Business activity slipped from 61.9 in June, following increased        0                                                                                                                                                                                             160
UK excl.
London

            -9.9%          7.3%    5.7%          input costs and supply chain disruption. Material costs and           -10                                                                                                                                                                                             140
                                                                                                                                                                                                                                                                                                                                                                                                                                                                  104
                                                 labour expenses also contributed to the deceleration.                -20                                                                                                                                                                                              120
             2020          2021    2022                                                                               -30
                                                                                                                                                                                                                                                                                                  -52%                 100
                                                                                                                      -40

                                                 55.1
                                                                                                                                                                                                                                                                                                                        80                                                                                                                           52
                                                                                                                      -50                                                                                                                                                                                                                                                                                                                                         42.5
                                                                                                                                                                                                                                                                                                                        60                                                                    30
                                                                                                                      -60
                                                                                                                      -70                                                                                                                                                                                               40                                                                                                                           16.8
                                                 New Business Index                                                   -80                                                                                                                                                                                               20                                                                    5.7
ILO UNEMPLOYMENT RATE                            Business activity growth trended upwards for six months              -90                                                                                                                                                                                                0
                                                 but softened in July. Many companies saw increased sales

                                                                                                                          Feb 2020
                                                                                                                                     Mar 2020
                                                                                                                                                Apr 2020
                                                                                                                                                           May 2020
                                                                                                                                                                      Jun 2020
                                                                                                                                                                                 Jul 2020
                                                                                                                                                                                            Aug 2020
                                                                                                                                                                                                       Sep 2020
                                                                                                                                                                                                                  Oct 2020
                                                                                                                                                                                                                             Nov 2020
                                                                                                                                                                                                                                        Dec 2020
                                                                                                                                                                                                                                                   Jan 2021
                                                                                                                                                                                                                                                              Feb 2021
                                                                                                                                                                                                                                                                         Mar 2021
                                                                                                                                                                                                                                                                                    Apr 2021
                                                                                                                                                                                                                                                                                               May 2021
                                                                                                                                                                                                                                                                                                          Jun 2021

                                                                                                                                                                                                                                                                                                                          May 2019

                                                                                                                                                                                                                                                                                                                                      Jul 2019

                                                                                                                                                                                                                                                                                                                                                 Sep 2019

                                                                                                                                                                                                                                                                                                                                                             Nov 2019

                                                                                                                                                                                                                                                                                                                                                                        Jan 2020

                                                                                                                                                                                                                                                                                                                                                                                   Mar 2020

                                                                                                                                                                                                                                                                                                                                                                                              May 2020

                                                                                                                                                                                                                                                                                                                                                                                                         Jul 2020

                                                                                                                                                                                                                                                                                                                                                                                                                    Sep 2020

                                                                                                                                                                                                                                                                                                                                                                                                                               Nov 2020

                                                                                                                                                                                                                                                                                                                                                                                                                                          Jan 2021

                                                                                                                                                                                                                                                                                                                                                                                                                                                       Mar 2021

                                                                                                                                                                                                                                                                                                                                                                                                                                                                   May 2021
                                                 from higher demand as restrictions ease.
  London

            5.6%           6.3%    6.0%
             2020          2021    2022
                                                 74.2                                                                                                                                                                                                                                                                                Bus                    Underground

                                                 Future Activity Index
                                                 Optimism edged downwards but firms are confident of
LONDON WORKPLACE-BASED EMPLOYMENT GROWTH         a business recovery, with improved hiring intentions and
                                                 increased client demand.
                                                                                                                                          Google mobility data show a clear uplift in visits to workplace following the lifting of lockdown
                                                                                                                                          measures on 12th April. In Zone 1, there has been an increase of 18%-pts since 12th April -
            -1.4%          -1.1%   2.6%
                                                 58.0
  Office

                                                                                                                                          visits to workplace at the end of July was 52% below the baseline, the highest level since the
             2020          2021    2022                                                                                                   beginning of the pandemic. We expect this to continue an upward trend from September.
                                                 Employment Index
                                                 London firms reported a slight easing in the rate of job
            -2.2%          -1.9%   3.3%          creation. However, latest data points to a strong rise in                                Journey data by mode of transport from TfL also show a marked improvement in travel throughout
office
Non-

                                                 employment, and the second-quickest across the UK.                                       London. Bus and underground journeys in May reached the highest level since the beginning of the
             2020          2021    2022                                                                                                   pandemic. There were 104m unique bus journeys and 42.5m unique underground journeys.
Source: Oxford Economics                      Source: IHS Markit             (figures below 50 signify contraction)

geraldeve.com
SUMMARY                 ECONOMY                                                                   DEMAND                                                                       AVAILABILITY                                                          DEVELOPMENT                       INVESTMENT              CONTACT

OFFICE OCCUPIER DEMAND

    THE BEGINNING OF THE RECOVERY?                                   London office quarterly take-up by broad market                                                                                                                                                                                      Take-up by submarket and lease type, Q2 2021
                                                                     Source: Gerald Eve                                                                                                                                                                                                                   Source: Gerald Eve, Property Data
    Green shoots of occupier demand for London offices were
                                                                     Million sq ft
    evident in Q2. Take-up of 1.9m sq ft was a 36% improvement
                                                                     5
    on Q1 and the strongest quarter since the beginning of the                                                                                                                                                                                                                                                                City

    pandemic. Letting activity was nevertheless 40% below            4
                                                                                                                                                                                                                                                                                                                       Southbank
    the 5-year quarterly average. However, this still represents a   3
                                                                                                                                                                                                                                                                                                          Farringdon & Clerkenwell
    marked improvement on the trough in Q4 2020.
                                                                     2
                                                                                                                                                                                                                                                                                                              Mayfair & St James’s
    Letting activity was highest in the City with 483,000 sq ft      1                                                                                                                                                                                                                                               Canary Wharf
    of take-up in Q2. The key deal of the quarter was JLL’s
                                                                     0
    134,000 sq ft letting at 1 Broadgate in April accounting for                                                                                                                                                                                                                                                         Midtown

                                                                           Q1 2016

                                                                                     Q2 2016

                                                                                               Q3 2016

                                                                                                         Q4 2016

                                                                                                                   Q1 2017

                                                                                                                             Q2 2017

                                                                                                                                       Q3 2017

                                                                                                                                                 Q4 2017

                                                                                                                                                           Q1 2018

                                                                                                                                                                     Q2 2018

                                                                                                                                                                               Q3 2018

                                                                                                                                                                                         Q4 2018

                                                                                                                                                                                                   Q1 2019

                                                                                                                                                                                                             Q2 2019

                                                                                                                                                                                                                       Q3 2019

                                                                                                                                                                                                                                 Q4 2019

                                                                                                                                                                                                                                           Q1 2020

                                                                                                                                                                                                                                                     Q2 2020

                                                                                                                                                                                                                                                               Q3 2020

                                                                                                                                                                                                                                                                         Q4 2020

                                                                                                                                                                                                                                                                                   Q1 2021

                                                                                                                                                                                                                                                                                             Q2 2021
    over 25% of the total volume. Notably, 131,100 sq ft of City                                                                                                                                                                                                                                                   Covent Garden
    take-up involved buildings available on a sub-let, with
                                                                           City                          West End                            Canary Wharf                                          Southbank                               5 year quarterly average                                                      Fitzrovia
    five of the six largest lettings in the submarket by way
    of assignments. A similar pattern occurred in the West                                                                                                                                                                                                                                                          Knightsbridge

    End, with six of the top lettings by size completed on                                                                                                                                                                                                                                                                Victoria
    assignments, totalling 170,000 sq ft.
                                                                               Employers appear to have the bit between their teeth in terms                                                                                                                                                                           Shoreditch

    Absorption of tenant-space, on both sub-lets and                           of the return to the office with most staff now fully vaccinated.                                                                                                                                                                      Marylebone
    assignments, has been particularly high, hitting                           Younger staff appear to have the largest appetite for returning.
                                                                                                                                                                                                                                                                                                                             Soho
    808,000 sq ft in Q2. This was 43% of all take-up, one of                   Growing momentum will see a considerable uptick in market activity
    the highest proportions on record, driven by a group of                    from September as companies stop kicking the can down the road                                                                                                                                                                King’s Cross & Euston

    large lettings of good quality tenant space. This is likely                and finally agree the shape of their existing or new offices. However,
                                                                                                                                                                                                                                                                                                                      Paddington
    to continue while some occupiers revise the amount of                      poor quality offices across central London are unlikely to benefit
                                                                               from this increased activity and landlords will have to grasp the need
    space they need post-lockdown. Quality is key, with those                  to bring offices up to the rising standards that companies want, both
                                                                                                                                                                                                                                                                                                                                     0              100   200                 300      400     500
                                                                                                                                                                                                                                                                                                                                                                000's sq ft
    marketing high spec sub-let space the most likely to attract               in terms of building quality and environmental credentials.                                                                                                                                                                  Landlord space           Tenant space
    prospective tenants. In the current market, such tenants will
    also seek improved terms via rent discounts or incentives                  Patrick Ryan, Partner
    along with their quality and/or location upgrade.                                                                                                                                                                                                                                                                                                                           Continue reading
geraldeve.com
SUMMARY                ECONOMY                  DEMAND                   AVAILABILITY                      DEVELOPMENT           INVESTMENT               CONTACT

OFFICE OCCUPIER DEMAND

    Corporates were the most active occupier sector in Q2,         Take-up by business sector, Q2 2021
    with total take-up of 424,000 sq ft, constituting 23% of all   Source: Gerald Eve
    market activity. Professional services were similarly active
    and accounted for 21% of total demand. Within the sector,      22% Undisclosed                                                        23% Corporate

    law firms have continued to dominate, taking advantage
    of current property market conditions. Over the last six       1% Research / Life Sciences
    months, lettings to law firms total 424,000 sq ft - alone      1% Retail

    this accounts for 13% of totalled take-up in H1 2021. Law      2% Serviced offices

    firms are characteristically active during downturns but       6% Media & tech                                              21% Professional services
    this time the case is even stronger, given concerns over
    the potential operational security implications of long-       7% Associations
                                                                                                                                  17% Finance & banking
    term home and hybrid working.

    THE VIEW ON RENTS

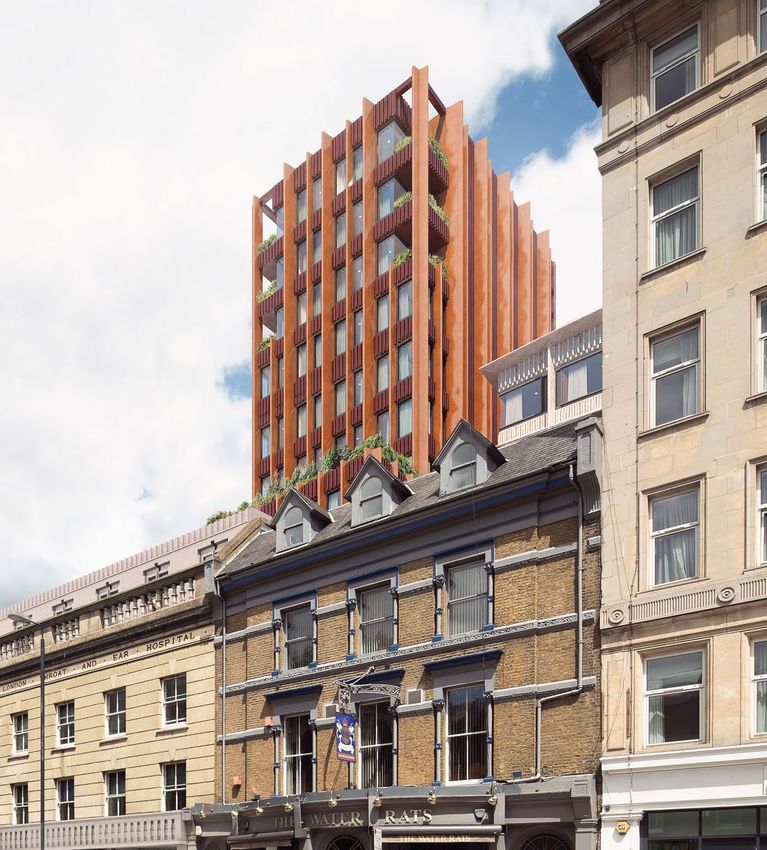
    Greater transactional activity provided evidence that rents    OFFICE REDEVELOPMENT FOR LIFE SCIENCES
    declined in Soho and Midtown in Q2. Both submarkets
    recorded a quarter-on-quarter fall in Grade A rents,                   In July 2021, Camden Council approved the plans for the
    from £92.50 to £90.00 and £72.50 to £70.00, respectively.              comprehensive redevelopment of 330 Grays Inn Road, creating a
    However, across most submarkets, landlords have                        truly mixed-use development in a central, well-connected location,
    maintained headline rents at pre-pandemic levels for                   providing homes and jobs as well as new publicly accessible space
                                                                           and new access routes through the site.
    Grade A offices, instead offering early access for leases
    and fit-out improvements. Incentives have cemented at                  Designed with sustainability at the forefront, through retention and
    the top of the range that was being offered 3-6 months                 re-use of the existing building as far as is possible, the lab-enabled,
    ago. Rent-free incentives in Mayfair & St. James’s were                high-specification floorspace will cater for organisations that will
                                                                           strengthen the Knowledge Quarter’s reputation as a centre for                        330 Grays Inn Road proposes over 14,000 sqm of new innovative office
    between 21-24 months, but recent evidence suggests that
                                                                           innovation and excellence.                                                           space, including lab-enabled floors, alongside a 182-bed hotel, a gym,
    this has now moved out to 24 months and beyond, with                                                                                                        café, and restaurant. Click here for further insight.
    similar, movements in Midtown, Soho, and Victoria.                     Lisa Webb, Partner

                                                                                                                                                                                                                    Continue reading
geraldeve.com
SUMMARY                          ECONOMY                             DEMAND   AVAILABILITY           DEVELOPMENT            INVESTMENT              CONTACT

OFFICE OCCUPIER DEMAND

UPCOMING LEASE EVENTS BY SUBMARKET (SQ FT)                                                                                                                                                    LEASE EVENTS SET TO DICTATE PACE OF OFFICE DEMAND

                                                                                                                                                                                              Occupiers are looking to lease events to implement new,
                                                                                                                                                                                              post-covid office requirements. An estimated 3.7m sq ft
                                                                                                                                                                                              of leases are set to expire in central London in H2 2021,
                                                              55k sq ft                                                                                                                       which will likely boost the overall number of leases signed
                                                              KING’S CROSS
                                                              & EUSTON                                                                                                                        in the second half of this year. However, a contraction in
                                                                                                                                                                                              the overall volume of space is a possibility as occupiers
                                                                                       400   k sq ft                                                                                          adapt to a hybrid working model and put more emphasis
                                                                                       FARRINGDON 
                                                                                                                                                                                              on building quality.
                                                                      400
                                                                                       & CLERKENWELL
                                                                             k sq ft

                                              52k sq ft               MIDTOWN                                                      63k sq ft
                                                                                                                                                                                              Large scale occupiers with upcoming lease events have
                        100       k sq ft
                                              FITZROVIA
                                                                                                                                   SHOREDITCH

                                                                                                                                                                                              already signed deals, such as Linklaters and Latham
      7k sq ft          MARYLEBONE
      PADDINGTON                                                                                            1.7    million sq ft                                                              & Watkins. Linklaters is set to vacate 1 Silk Street
                                                       67k sq ft      89k sq ft                             CITY
                                                                                                                                                                                              in favour of 20 Ropemaker in 2023, with a reduced
                                                       SOHO
                                       200   k sq ft
                                                                      COVENT
                                                                      GARDEN                                                                                                                  footprint of 130,000 sq ft to 330,000 sq ft. Meanwhile
                                       MAYFAIR &
                                       ST JAMES’                                                                                                                                              Latham & Watkins will move out of 99 Bishopsgate and
                                                                                                                                                                 10k sq ft                    into 1 Leadenhall at a net reduction of 100,000 sq ft from
                                                                                          100     k sq ft                                                        CANARY WHARF
                                                                                                                                                                                              current occupancy of 344,000 sq ft in late 2020.
                                                                                          SOUTHBANK

                                                                                                                                                                                              It is still too early to tell if these deals are a sign of how
                   100  k sq ft                                                                                                                                                               the wider market will act and what the impact will be
                   KNIGHTSBRIDGE
                                               200       k sq ft                                                                                                                              on office availability in the medium to long term. But
                                               VICTORIA                                                                                                                                       if smaller occupiers similarly look to downsize their
                                                                                                                                                                                              occupied space it will at least drive increased take-up
                                                                                                                                                                                              activity, since subletting floors or part of a floor is not an
                                                                                                                                                                                              option for these tenants.

geraldeve.com
SUMMARY                                ECONOMY                                                          DEMAND                              AVAILABILITY                             DEVELOPMENT                                                                INVESTMENT                          CONTACT

AVAILABILITY

Availability ranges by submarket, Q1 2013 – Q2 2021                                                                                                                                                                          Sub-let availability, % of total
Source: Gerald Eve                                                                                                                                                                                                           Source: Gerald Eve

%                                                                                                                                                                                                                            %
20                                                                                                                                                                                                                           60

                                                                                                                                                                                                                             50
16
                                                                                                                                                                                                                             40
12
                                                                                                                                                                                                                             30
 8
                                                                                                                                                                                                                             20
 4                                                                                                                                                                                                                           10

 0                                                                                                                                                                                                                            0
       Paddington

                    Farringdon &
                     Clerkenwell

                                     Canary Wharf

                                                    Victoria

                                                                 Southbank

                                                                             Fitzrovia

                                                                                         Shoreditch

                                                                                                       Soho

                                                                                                              City

                                                                                                                     Mayfair & St James’s

                                                                                                                                            Midtown

                                                                                                                                                      King’s Cross & Euston

                                                                                                                                                                              Covent Garden

                                                                                                                                                                                              Knightsbridge

                                                                                                                                                                                                                Marylebone

                                                                                                                                                                                                                                   Canary Wharf

                                                                                                                                                                                                                                                    Knightsbridge

                                                                                                                                                                                                                                                                    Midtown

                                                                                                                                                                                                                                                                              Fitzrovia

                                                                                                                                                                                                                                                                                          Central London

                                                                                                                                                                                                                                                                                                            Victoria

                                                                                                                                                                                                                                                                                                                       Mayfair & St James’s

                                                                                                                                                                                                                                                                                                                                              King’s Cross & Euston

                                                                                                                                                                                                                                                                                                                                                                       Soho

                                                                                                                                                                                                                                                                                                                                                                              Southbank

                                                                                                                                                                                                                                                                                                                                                                                          City

                                                                                                                                                                                                                                                                                                                                                                                                 Farringdon &
                                                                                                                                                                                                                                                                                                                                                                                                  Clerkenwell

                                                                                                                                                                                                                                                                                                                                                                                                                Marylebone

                                                                                                                                                                                                                                                                                                                                                                                                                             Covent Garden

                                                                                                                                                                                                                                                                                                                                                                                                                                             Shoreditch

                                                                                                                                                                                                                                                                                                                                                                                                                                                          Paddington
      Maximum                      Minimum                 Current

The availability rate in London continued to rise in Q2 and reached                                                                         Almost half of the tracked submarkets have recorded slight falls                                                                                               Tenant-controlled grey space still makes up a large proportion of total
9.3%. However, there are signs that the kinds of large jumps that                                                                           in availability. The strongest relative decline was in Knightsbridge,                                                                                          availability across many submarkets. Especially, in submarkets where
occurred over 2020 are receding. Around 11m sq ft of additional office                                                                      following the subletting of 1 Knightsbridge Green. This was the largest                                                                                        occupier activity has been particularly weak during the pandemic. The
space has become available across London since Q2 2020, an average                                                                          available building in the submarket, shifting the availability rate from                                                                                       highest proportion is in Canary Wharf, where 53% of all available space
of 2.8m sq ft per quarter. In Q2 the increase was ‘only’ 1.1m sq ft. The                                                                    7.5% to 5.1%. In the City, availability fell by 0.4%-pts to 9.3% in Q2.                                                                                        is tenant-controlled. Here many large financial institutions and banks
worst for the market is likely in the past, as the growth in secondhand                                                                                                                                                                                                                                    have released space on the back of anticipated shifts to hybrid working
space decelerates and gets increasingly absorbed.                                                                                                                                                                                                                                                          and in gradual structural shifts to European offices following Brexit.

geraldeve.com
SUMMARY            ECONOMY                DEMAND                  AVAILABILITY           DEVELOPMENT                                            INVESTMENT                                                       CONTACT

DEVELOPMENT

    Just over 1m sq ft completed in the first half of 2021 across       This is likely to have a dampening effect on new development          London office new supply and development pipeline
    10 different schemes. The City accounted 40% of all deliveries,     starts in the near term. Firms that are well capitalised and with     Source: Gerald Eve
    the highest of any individual submarket. We expect developer        high liquidity may be able to take advantage of this, and take        Million sq ft
    activity to pick up significantly in H2 with a further 6m sq ft     on development opportunities that others are unwilling to             8
    to complete across central London. Of the remaining 2021            execute, though this pool is relatively small. Putting a spade-        7

    projects, 32% of space is pre-let, a total of 2.6m sq ft. The       in-the-ground while taking on increased development and               6
                                                                                                                                              5
    expected increase in occupier activity in Q2 could prompt a         cost risk, will seem an unattractive option for many developers
                                                                                                                                              4
    round of new pre-lets on space under construction as tenants        over the next 18 months. This could have a knock-on effect on          3
    seek out more modern stock that is better suited for hybrid         completions volumes post-2023 and the next 6-12 months of             2
    working or with strong ESG credentials.                             new starts will show indicate whether this will be a factor.           1
                                                                                                                                              0
    Temporary inflationary pressures have been working their            Refurbishments or full fitouts instead of completely new                              2015                2016                 2017                 2018                2019                2020                  2021                 2022                  2023

    way through all sectors of the economy since Q1 2021.               developments will be more cost effective for developers                        Completed                           Under construction available                                       Under construction let

    Build costs have been driven upward by global shortages             and landlords attempting to secure tenants in a post-
    of materials coupled with supply chain disruptions in the           pandemic environment. In Q2, 130 planning applications                BCIS general building costs
    UK and globally. Data from BCIS show that the materials             were submitted in our tracked submarkets, of which 103 are            Source: BCIS
    costs index increased by 13% in the year to July. Wages in          for full refurbishments of office space. Of the 40 planning           %
    construction are also up 12% following worker shortages,            permissions that were given, 37 of those are for refurbishments.       8
                                                                                                                                                                                                                                                             Forecast
    with the ONS citing there are currently 38,000 unfilled             Consequently, most development activity will likely be on              7
                                                                                                                                               6
    vacancies in the sector. Further sharp price rises in the           existing stock over the medium term.                                   5
    sector are expected to continue until late 2021.                                                                                           4
                                                                                                                                               3
                                                                                                                                               2

  7%                                 130                              40                                 103
                                                                                                                                               1
                                                                                                                                               0
                                                                                                                                              -1

                                                                                                                                                   Jan 2020

                                                                                                                                                                Mar 2020

                                                                                                                                                                           May 2020

                                                                                                                                                                                      Jul 2020

                                                                                                                                                                                                 Sep 2020

                                                                                                                                                                                                            Nov 2020

                                                                                                                                                                                                                       Jan 2021

                                                                                                                                                                                                                                  Mar 2021

                                                                                                                                                                                                                                             May 2021

                                                                                                                                                                                                                                                        Jul 2021

                                                                                                                                                                                                                                                                   Sep 2021

                                                                                                                                                                                                                                                                              Nov 2021

                                                                                                                                                                                                                                                                                         Jan 2022

                                                                                                                                                                                                                                                                                                    Mar 2022

                                                                                                                                                                                                                                                                                                               May 2022

                                                                                                                                                                                                                                                                                                                          Jul 2022

                                                                                                                                                                                                                                                                                                                                     Sep 2022

                                                                                                                                                                                                                                                                                                                                                Nov 2022
 Annual general                      Total planning                   Total planning                     Applications for
 build costs growth, July 2021       applications submitted           permissions granted                office refurbishment
                                                                                                                                                       Annual building cost growth

geraldeve.com
SUMMARY                                                         ECONOMY               DEMAND                 AVAILABILITY       DEVELOPMENT                   INVESTMENT                   CONTACT

INVESTMENT

Quarterly investment volume by market                                                                                                                                                                                               Overseas investors continue to account for the bulk of
                                                                                                                                                                                                                                                                                                     CENTRAL LONDON OFFICE CAPITAL FLOWS, Q2 2021
Sources: Gerald Eve, Property Data                                                                                                                                                                                                  activity in London offices. In Q2, cross border investors        Source: Gerald Eve, Property Data

£ billion
                                                                                                                                                                                                                                    made £1.8bn of acquisitions, while disposing of £1.7bn,
5                                                                                                                                                                                                                                   accounting for 75% of both the total volume bought                                              UK
                                                                                                                                                                                                                                                                                                                                 PROPERTY                    PRIVATE
                                                                                                                                                                                                                                    and sold. By investor domicile, North American investors                                    COMPANIES                   INVESTORS
4
                                                                                                                                                                                                                                    were the most acquisitive, making £695m of purchases.
3                                                                                                                                                                                                                                   However, this figure is made up of only two transactions,

                                                                                                                                                                                                                                                                                                                                         £8 .1m

                                                                                                                                                                                                                                                                                                                                                       £5 m
                                                                                                                                                                                                                                                                                                                                                           5.4
                                                                                                                                                                                                                                                                                                                                            2.6
                                                                                                                                                                                                                                                                                                                                           £3

                                                                                                                                                                                                                                                                                                                                                         .3m
                                                                                                                                                                                                                                    the largest of which was Brookfield Property’s

                                                                                                                                                                                                                                                                                                                                             7

                                                                                                                                                                                                                                                                                                                                                        £9
                                                                                                                                                                                                                                                                                                                                               m
2
                                                                                                                                                                                                                                    acquisition of 30 Fenchurch Street for £635m. German
1
                                                                                                                                                                                                                                    investors were the second most active buyer group,                                           £181.2m          CENTRAL     £354.9m          UK
0                                                                                                                                                                                                                                   taking the opportunity to act while other international                      UNDISCLOSED                      LONDON                  INSTITUTIONS
                                                                                                                                                                                                                                                                                                                                   £8.1m          OFFICES       £278.5m
       Q1 2016

                 Q2 2016

                           Q3 2016

                                     Q4 2016

                                               Q1 2017

                                                         Q2 2017

                                                                   Q3 2017

                                                                             Q4 2017

                                                                                       Q1 2018

                                                                                                 Q2 2018

                                                                                                           Q3 2018

                                                                                                                     Q4 2018

                                                                                                                               Q1 2019

                                                                                                                                         Q2 2019

                                                                                                                                                   Q3 2019

                                                                                                                                                             Q4 2019

                                                                                                                                                                       Q1 2020

                                                                                                                                                                                 Q2 2020

                                                                                                                                                                                           Q3 2020

                                                                                                                                                                                                     Q4 2020

                                                                                                                                                                                                               Q1 2021

                                                                                                                                                                                                                         Q2 2021
                                                                                                                                                                                                                                    investor competition has been relatively low. They
                                                                                                                                                                                                                                    acquired £594m of offices located exclusively in the City.

                                                                                                                                                                                                                                                                                                                                                       £7 m
                                                                                                                                                                                                                                                                                                                                     £1 n

                                                                                                                                                                                                                                                                                                                                                        £1
                                                                                                                                                                                                                                                                                                                                          n
                                                                                                                                                                                                                                                                                                                                        .8b

                                                                                                                                                                                                                                                                                                                                                         5.9
      City                           West End                            Canary Wharf                                          Southbank                                 5 year average

                                                                                                                                                                                                                                                                                                                                       .7b

                                                                                                                                                                                                                                                                                                                                                          5.1

                                                                                                                                                                                                                                                                                                                                                            m
                                                                                                                                                                                                                                    Over the last 12 months, a large proportion of investors

                                                                                                                                                                                                                                                                                                                                      £1
                                                                                                                                                                                                                                    have allocated to beds and sheds because of their
                                                                                                                                                                                                                                    outperformance during the pandemic. This has led to                                         OVERSEAS                     OCCUPIER
                                                                                                                                                                                                                                                                                                                               INVESTORS
                                                                                                                                                                                                                                    strong yield compression, particularly in industrials.
Quarterly investment increased in Q2 to just under £2.4bn, up by a                                                                                                                                                                  However, capital values in prime London offices have
quarter on Q1. There is continued evidence of the flight to quality,                                                                                                                                                                not fallen as hard as originally expected. Pricing is still
                                                                                                                                                                                                                                                                                                      INVESTMENT VOLUME BY INVESTOR SUB-DOMICILE
with prime assets in the City dominating activity. The top three                                                                                                                                                                    relatively strong and the outward shift in yields ended in
investments by value in Q2 were all located in the Square Mile, with                                                                                                                                                                Q2, with equivalent yields actually tightening somewhat           £695m                       £593.9m               £378.7m               £101.1m
£1.5bn of overseas capital allocated to buildings with long-dated                                                                                                                                                                   across all London office segments. Prime London offices           NORTH AMERICAN              GERMAN                FAR EAST              EUROPEAN
income and strong covenants. Large investments have shown clear                                                                                                                                                                     now look attractive to other international cities in
                                                                                                                                                                                                                                                                                                       39.3%                       33.6%                21.4%                  5.7%
favour towards long and secure income, with all transactions over                                                                                                                                                                   relative value terms at this point in the current cycle, and       OF OVERSEAS                 OF OVERSEAS          OF OVERSEAS            OF OVERSEAS
                                                                                                                                                                                                                                                                                                       INVESTMENT                  INVESTMENT           INVESTMENT             INVESTMENT
£100m on offices sold with at least 10 years of income.                                                                                                                                                                             there is still clear investor interest.

                                                                                                                                                                                                                                                                                                                                                                          Continue reading
geraldeve.com
SUMMARY                 ECONOMY                 DEMAND              AVAILABILITY                    DEVELOPMENT                 INVESTMENT                           CONTACT

INVESTMENT

    NEW SALE CAMPAIGNS LIKELY TO PRECEDE UPTICK IN H2 2021 INVESTMENTS                                          Available investment stock by sell-side investor type, Q2 2021
                                                                                                                Source: Gerald Eve
    There is in excess of £40bn of private capital targeting London offices and many major European
                                                                                                                £ billion
    institutions have been open about increasing capital allocations to this segment. This coupled with
                                                                                                                2.5         2.31
    the turning point in the occupational market is likely to precede an uptick in investment volumes as                                    Overseas Investors
    investor confidence recovers, increasing the prospective size of the diminished buyer pool due to the       2.0
                                                                                                                                                                                      1.56
    pandemic. Increased confidence on the buy-side coupled with a range of purchase opportunities will          1.5
                                                                                                                                                                                                    1.25
    mean that the second half of 2021 will see an improved level of liquidity and activity.
                                                                                                                1.0
                                                                                                                                                                                                                0.57
    There is around £6.9bn of office stock listed for sale at present in London, with £4.2bn put on the         0.5                  0.42          0.34
                                                                                                                                                                  0.17                                                         0.14
    market in H1 2021. By submarket, the City has the largest stock available (£2.3bn), followed by the          0
                                                                                                                                                                          0.09                                                              0.08        0.03

    West End (£1.2bn). Overseas investors could be the largest divestor this year, listing a total of £2.2bn           Far East    European      North           Middle   Other        UK         Property   Undisclosed     Financial    Occupier     Private
                                                                                                                                                American          East            Institutions   Companies                 Institutions              Individuals
    in H1 2021, accounting for almost a third of total volume by value. By investor sub-domicile, Far East
    investors are the most active on the sell-side. Current Far East listings total £1.7bn of prime assets in
    the City and all are expected to trade at under 4.5% net initial yield.

    UK-based investors are also expected to be active on the sell side. UK institutions and UK property
    companies have £1.6bn and £1.2bn on the market respectively, totalling £2.8bn. UK based investors
                                                                                                                                   £6.9bn                                                                  £4.2bn
    are more active in selling smaller lot sizes than their overseas counterparts. In the under £25m                               Offices available for purchase                                          Offices listed for sale, Q2 2021
    bracket, property companies have listed 15 assets, while institutions have sale campaigns online for
    12 buildings.

                                                                                                                                   £3.3bn                                                                  £41bn
    Travel restrictions have been important limiting factors for investment activity over the last 18 months.
    While transactions have completed with buildings unseen, this has been usually reserved for quality
    assets in well known locations. As travel corridors begin to open this should allow more physical visits
    to assets and potentially drive more investment in value-add or development opportunities. This is                             Volume of listings from                                                 Capital targeting London offices
    particularly the case for investors from Asia, as on-site due diligence can now be conducted.                                  overseas investors

geraldeve.com
SUMMARY          ECONOMY            DEMAND   AVAILABILITY               DEVELOPMENT                  INVESTMENT                   CONTACT

LONDON OFFICE CONTACTS

Agency & Investment         Lease Consultancy            Planning & Development
                                                                                              FURTHER INSIGHT
Lloyd Davies                Tony Guthrie                 Lisa Webb
Partner                     Partner                      Partner
Tel. +44 (0)20 7333 6242    Tel. +44 (0)20 3486 3456     Tel. +44 (0)20 7333 6225                   Planning update – Class E to residential permitted development right
Mobile +44 (0)7767 311254   Mobile +44 (0)7717 225 600   Mobile +44 (0)7747 607309
ldavies@geraldeve.com       tguthrie@geraldeve.com       lwebb@geraldeve.com                        Legislation changes threaten the value of large older office buildings
Fergus Jagger               Graham Foster                Research                                   The end of the office? Don’t count on it
Partner                     Consultant
Tel. +44 (0)20 7653 6831    Tel. +44 (0)20 7653 6832     Steve Sharman                              Grays Inn Road Redevelopment
Mobile +44 (0)7787 558756   Mobile +44 (0)7774 823663    Partner
fjagger@geraldeve.com       gfoster@geraldeve.com        Tel. +44(0)20 7333 6271
                                                         Mobile +44 (0)7508 008118
                                                                                                    Life Sciences - Planning for the Future
Rhodri Phillips             Malcolm Hull                 ssharman@geraldeve.com
                                                                                                    InBrief for August 2021
Partner                     Partner
Tel. +44 (0)20 3486 3451    Tel. +44 (0)20 3486 3458     Ben Clarke
Mobile +44 (0)7768 615296   Mobile +44 (0)7768 154324    Partner
rphillips@geraldeve.com     mhull@geraldeve.com          Tel. +44(0)20 7333 6288
                                                         bclarke@geraldeve.com             View our full-service offer
Patrick Ryan                Jenny Rodericks
Partner                     Partner                      Oli Al-Rehani                           Find out how we can help
Tel. +44 (0)20 7333 6368    Tel. +44 (0)20 7653 6857     Senior Research Analyst
Mobile +44 (0)7792 078397   Mobile +44 (0)7775 697645    Tel. +44(0)20 7518 7255
pryan@geraldeve.com         jrodericks@geraldeve.com     Mobile +44 (0)7584 112501
                                                         oal-rehani@geraldeve.com

                                                                                       Disclaimer & copyright
                                                                                       London Markets is a short summary and is not intended to be definitive advice. No responsibility can be accepted
                                                                                       for loss or damage caused by reliance on it.
                                                                                       © All rights reserved
                                                                                       The reproduction of the whole or part of this publication is strictly prohibited without permission from Gerald Eve LLP.
geraldeve.com
You can also read