INVESTOR PRESENTATION - JANUARY 2021 onelibertyproperties.com - One Liberty Properties, Inc.
←
→
Page content transcription
If your browser does not render page correctly, please read the page content below
INVESTOR PRESENTATION
      JANUARY 2021

  onelibertyproperties.com

                             ◆ 1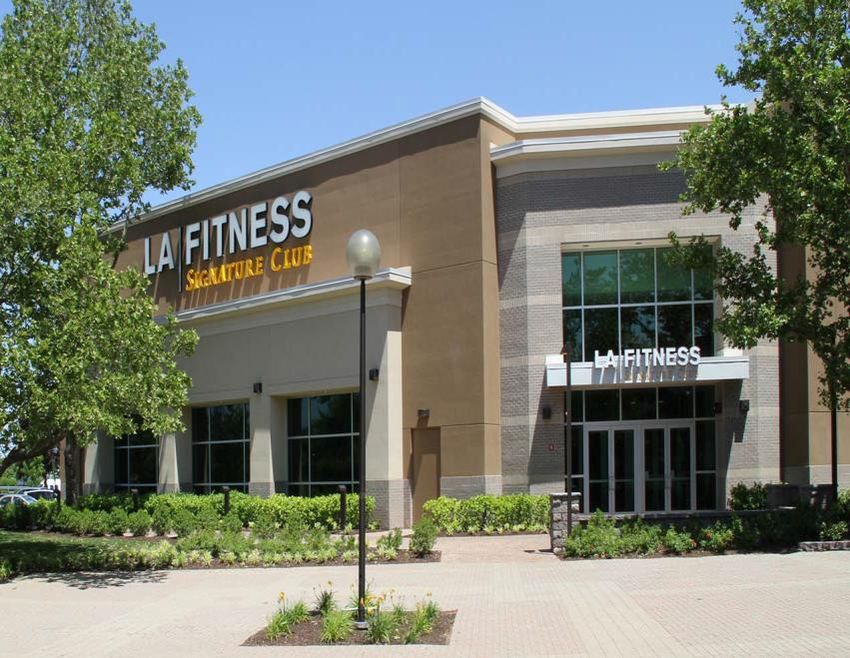
TABLE OF CONTENTS

DESCRIPTION                           PAGE   DESCRIPTION                         PAGE
Table of Contents                        2   Recent Acquisitions                   20
Safe Harbor Disclosure                   3   Recent Dispositions                   21
Company Overview                         4   Recent Mortgages                      22
Experienced Management Team              5   Case Studies:
Attractive Portfolio Fundamentals        6    Acquisition – Ashland, VA            23
Portfolio Detail                         7    Acquisition – Lowell, AR             24
COVID-19 Impact on Rent Collections      8    Acquisition – Nashville, TN          25
Diversified Portfolio                    9   Summary                               26
Diversified Tenant Base                 10   APPENDIX
Financial Summary                       11   Top Tenant Profiles:
Operational Metrics                     12    Havertys Furniture                   29
Steady Dividend                         13    FedEx                                30
Growth Oriented Balance Sheet           14    LA Fitness                           31
Mortgage Debt Maturities                15    Northern Tool & Equipment            32
Lease Maturity Profile                  16    L3 Harris Technologies, Inc.         33
Stable Occupancy                        17   GAAP Reconciliation to FFO & AFFO     35
Strong Rental Income Growth             18   Non-GAAP Financial Measures           36
Acquisition Track Record                19

                                                                                   ◆ 2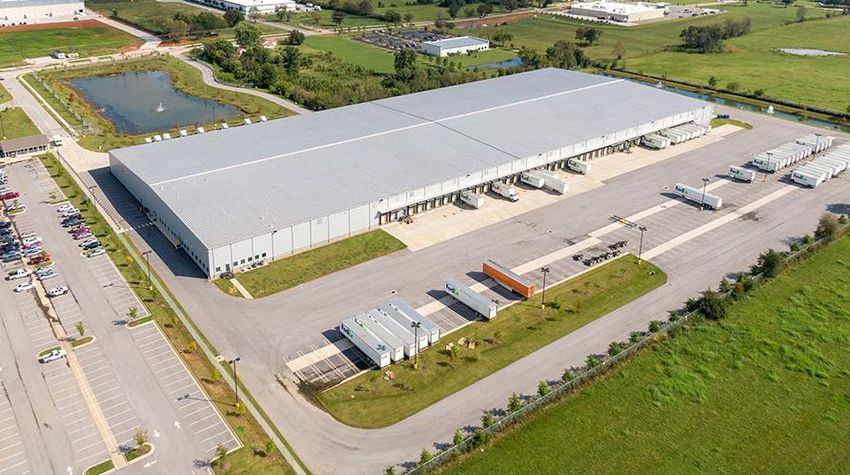
SAFE HARBOR
This presentation contains certain forward-looking statements within the meaning of Section 27A of the Securities
Act of 1933, as amended, and Section 21E of the Securities Exchange Act of 1934, as amended. We intend such
forward-looking statements to be covered by the safe harbor provision for forward-looking statements contained
in the Private Securities Litigation Reform Act of 1995 and include this statement for purposes of complying with
these safe harbor provisions. Forward-looking statements, which are based on certain assumptions and describe
our future plans, strategies and expectations, are generally identifiable by use of the words “may,” “will,” “could,”
“believe,” “expect,” “intend,” “anticipate,” “estimate,” “project,” or similar expressions or variations thereof and
include, without limitations, statements regarding our future estimated rental income, funds from operations,
adjusted funds from operations and our dividend. You should not rely on forward-looking statements since they
involve known and unknown risks, uncertainties and other factors which are, in some cases, beyond our control
and which could materially affect our results of operations, financial condition, cash flows, performance or
achievements. Currently, one of the most significant risks, uncertainties and factors is the adverse effect of the
current pandemic of the novel coronavirus, or COVID-19, and the various governmental responses thereto, on our
and our tenants’ financial condition, results of operations, cash flows and performance, and the pandemic’s
impact on the real estate market, global economy and financial markets. The extent to which COVID-19 impacts
us, our tenants and the economy generally will depend on future developments, which are highly uncertain and
cannot be predicted with confidence, including the scope, severity and duration of the pandemic, the actions
taken to contain the pandemic or mitigate its impact, and the direct and indirect economic effects of the
pandemic and containment measures, among others. Moreover, you should interpret many of the risks identified
in this presentation, as well as the risks set forth in the reports we file with the Securities and Exchange Commission
(the “SEC”), as being heightened as a result of the ongoing and numerous adverse impacts of the COVID-19
pandemic. Additional uncertainties, risks and factors which may cause actual results to differ materially from
current expectations are contained in our SEC filings, and, in particular, the sections of our Annual Report on Form
10-K and Quarterly Reports on Form 10-Q captioned “Risk Factors” and “Management’s Discussion and Analysis of
Financial Condition and Results of Operations”. Copies of the SEC filings may be obtained from us or the SEC. We
do not undertake to publicly update or revise any forward-looking statements included in this presentation,
whether as a result of new information, future events or otherwise.

                                                                                                                  ◆ 3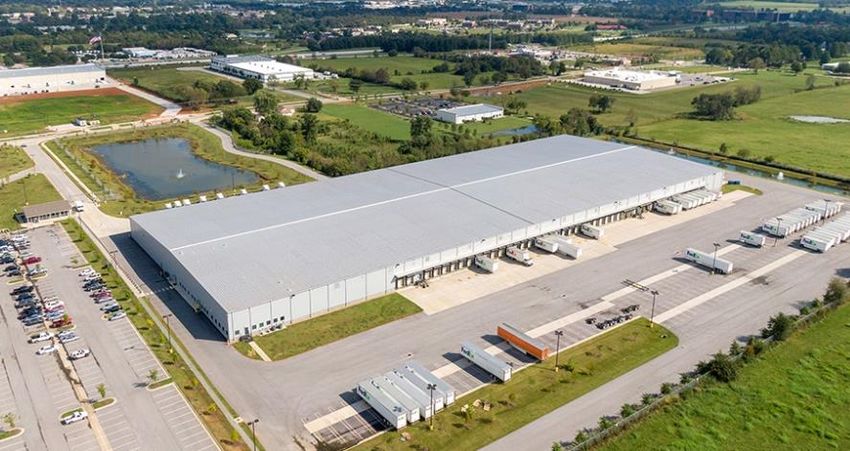
COMPANY OVERVIEW
Fundamentals – focused real estate company
Disciplined track record over various economic cycles
Active net lease strategy - emphasis on industrial properties
Experienced management team
Alignment of interests - significant insider ownership
◆ 4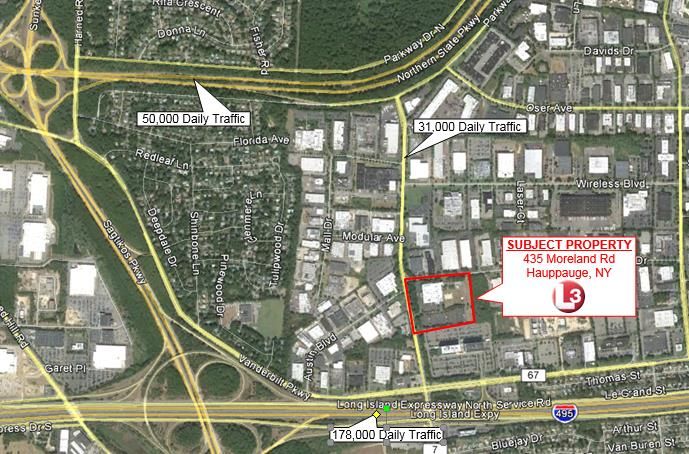
EXPERIENCED MANAGEMENT TEAM
Chief Executive Officer since 2008, President since 2006, Director since 2002
Senior Vice President of First Washington Realty Inc. from 2004 to 2005. A joint venture with
Patrick J. Callan, Jr. CalPERS that controlled 100 shopping centers (13 million square feet) which was sold for $2.6
President & CEO billion to Regency Centers/Macquarie
Vice President of Kimco Realty Corporation (NYSE: KIM) from 1998 to 2004, joined in 1987.
Responsible for a $3 billion, 200+ shopping center portfolio
Lawrence G. Ricketts, Jr. Chief Operating Officer since 2008 and Executive Vice President since 2006
COO & EVP Over $2.5 billion of transaction experience in acquisitions, dispositions and financings
Senior Vice President and Chief Financial Officer since 1990
David W. Kalish, CPA Senior Vice President, Finance of BRT Apartments Corp. (NYSE: BRT) since 1998 and Senior Vice
SVP & CFO President and Chief Financial Officer of the managing general partner of Gould Investors L.P.
since 1990
Chairman of the Board since June 2013 and Vice Chairman from 2011 through 2013. President
and Chief Executive Officer from 1989 to 1999; Senior Vice President from 1999 to 2011
Matthew J. Gould
Senior Vice President of BRT Apartments Corp. (NYSE: BRT) since 1993 and Director since 2004
Chairman
Chairman of the managing general partner of Gould Investors L.P. since January 2013 and
President and CEO from 1997 to 2012
Vice Chairman of the Board since June 2013. Chairman of the Board from 1989 to 2013
Chairman of BRT Apartments Corp. (NYSE: BRT) from 1984 to April 2013 and Director since 1984
Fredric H. Gould
Chairman Emeritus of the managing general partner of Gould Investors L.P. since January
Vice Chairman 2013 and Chairman from 1997 to 2013
Director of EastGroup Properties, Inc. (NYSE: EGP) from 1998 to 2019
◆ 5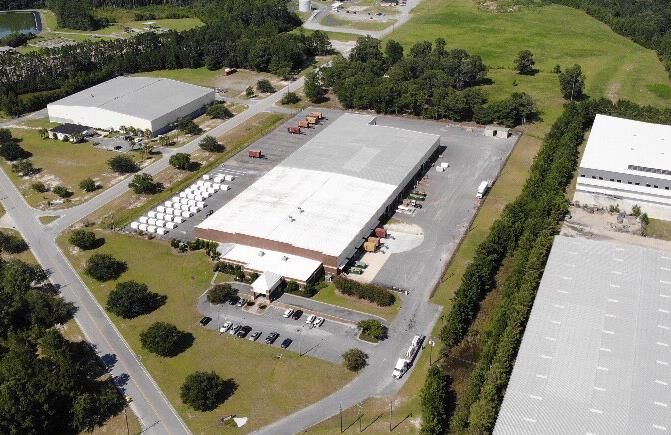
ATTRACTIVE PORTFOLIO FUNDAMENTALS                                                                                 (1)

 Total Square Footage                                                             10.7 M

 Number of Properties                                                                    125

 Current Occupancy                                                                 96.9%
                                                                                                              Cosentino North America – Savannah, GA

 Contractual Rental income(2)                                                  $76.0 M

   Lease Term Remaining                                                     6.0 Years
(1) Information presented as of September 30, 2020, including three properties owned by
    unconsolidated joint ventures
(2) Our contractual rental income represents, after giving effect to any abatements, concessions,
    deferrals or adjustments under leases in effect as of September 30, 2020, the base rent payable to
    us during the twelve months ending September 30, 2021, including approximately (i) $2.7 million
    from Regal Cinemas at three properties which have closed for an unspecified period, (ii) $2.3
    million from four tenants that have sought bankruptcy protection and (iii) our share of the rental
    income payable to our unconsolidated joint ventures, which is approximately $1.8 million.
    Excluded from contractual base rent is approximately (i) $1.1 million of estimated variable lease
    payments from the Vue Apartments, (ii) $714,000 of amortization of intangibles and (iii) the
    reversal of $155,000 of straight-line rent.                                                          FedEx Ground – Lowell, AR (Northwest Arkansas MSA)

                                                                                                                                                    ◆ 6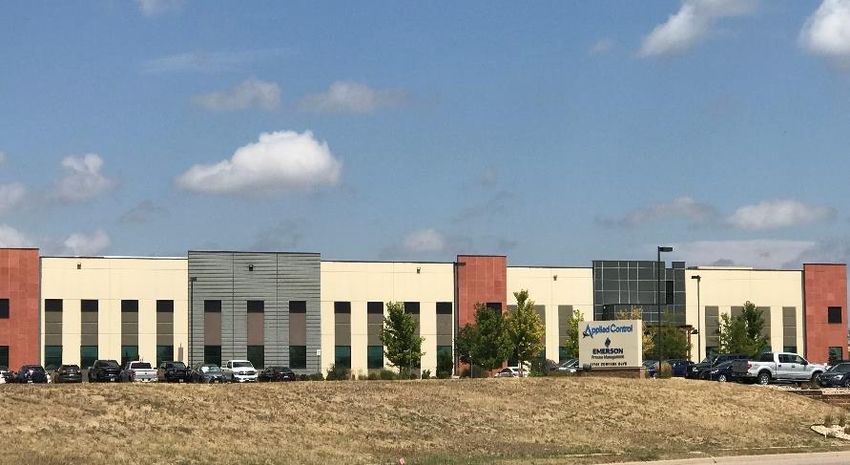
PORTFOLIO DETAIL

                                                                  Number of                      Contractual                        % of Contractual
Type of Property                                                  Properties                    Rental Income                        Rental Income

Industrial                                                                 46                      $38,585,566                               50.8%

Retail – General                                                           32                          14,060,344                            18.5

            – Furniture                                                    14                           6,924,307                             9.2

            – Supermarket                                                    3                          2,693,704                             3.5

            – Office Supply                                                  5                          2,085,527                             2.7

Restaurants                                                                17                           3,962,362                             5.2

Health & Fitness                                                             3                          3,335,073                             4.4

Theater                                                                       2(1)                      2,663,233(2)                          3.5

Other(3)                                                                     3                          1,669,922                             2.2

                                                                        125                      $75,980,038                              100.0%

(1) Though we have three theaters, one is part of a multi-tenant shopping center property in Manahawkin, NJ and is therefore excluded from this column
(2) The contractual rental income associated with the theater in Manahawkin, NJ is included
(3) Other is comprised of a ground lease for an apartment complex, veterinary hospital and an office

                                                                                                                                                         ◆ 7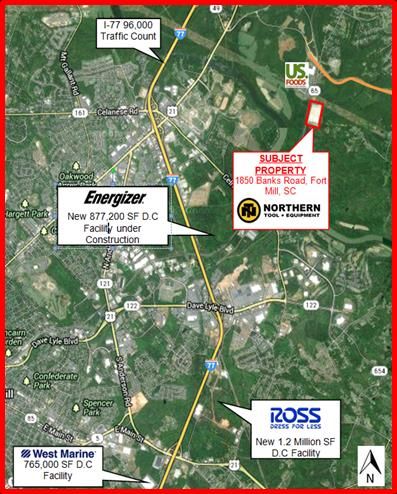
IMPACT OF COVID-19 ON RENT COLLECTIONS
                                                        (1)                                                                           (1)
                    October 2020                                                                     November 2020
                       5%                                                                                    4%

                          95%                                                                                96%
                                                              Collected                                                               Collected
                                                              Uncollected                                                             Uncollected

                                                                                                       (1)
                                                              December 2020
                                                                    4%

                                                                       96%
                                                                                                             Collected
                                                                                                             Uncollected

(1) Represents the percentage of base rent due each month, before giving effect to COVID-19 related lease deferrals and abatements.

                                                                                                                                                  ◆ 8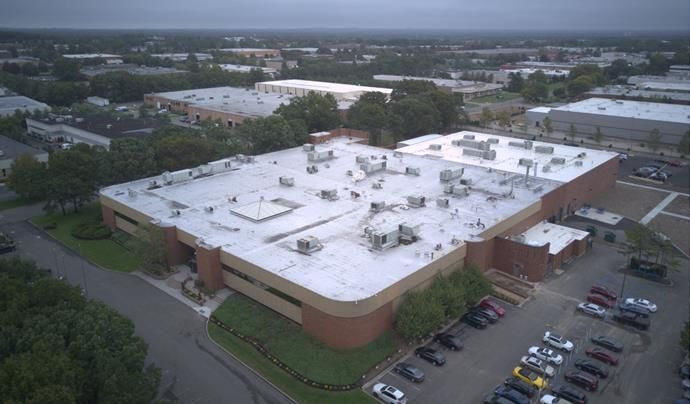
DIVERSIFIED PORTFOLIO
Highest State Concentration by
Contractual Rental Income
Number of Contractual % Contractual
Geographically diverse footprint State Properties Rental Income Rental Income
New York 8 $6,399,770 8.4%
Texas 9 6,240,812 8.2
Own 125 properties in 31 states
South Carolina 7 6,217,274 8.2
Pennsylvania 12 5,933,717 7.8
Strong markets drive value New Jersey 5 5,055,132 6.7
41 $29,846,705 39.3%
◆ 9
DIVERSIFIED TENANT BASE
                                                                                 % of
                                                Number of    Contractual     Contractual
Top Tenants                                     Locations   Rental Income   Rental Income
Haverty Furniture Companies, Inc. (NYSE: HVT)      11        $ 5,435,267        7.2%

FedEx (NYSE: FDX)                                   6         3,567,049         4.7

LA Fitness International, LLC                       3         3,335,073         4.4

Northern Tool & Equipment                           1         2,938,231         3.9

L3 Harris Technologies, Inc. (NYSE: LHX)            1         2,718,946         3.6

                                                   22       $17,994,566       23.8%

                                                                                       ◆ 10
FINANCIAL SUMMARY
(1)
Market Cap $408.9 M
(1)
Shares Outstanding 20.6 M
(2)
Insider Ownership 22.1%
Applied Control Equipment – Denver, CO
(3)
Current Annualized Dividend $1.80
(4)
Dividend Yield 9.1%
(1) Market cap is calculated using the shares outstanding and the closing OLP stock price of $19.87
at January 7, 2021
(2) Calculated as of January 7, 2021
(3) During 2020, approximately 18.75% of the dividend was paid in shares of our common stock Campania International / U.S. Tape – Philadelphia, PA
(4) Calculated using the closing OLP stock price of $19.87 at January 7, 2021
◆ 11OPERATIONAL METRICS(1)(2)
Historical Net Income Per Share Historical FFO Per Share Historical AFFO Per Share
$1.60 $2.20 $2.20
$1.39 $2.13
$1.28 $2.09
$1.20 $1.05 $2.02 (3) $1.99 $1.98
$2.00 $1.94 $2.00
$0.88
$1.90
$0.80 $1.84 (3)
$1.80 $1.80
$0.40
$0.00 $1.60 $1.60
2016 2017 2018 2019 2016 2017 2018 2019 2016 2017 2018 2019
Nine Months Ended FFO Payout (4) AFFO Payout (4)
September 30, 2020:
NET INCOME – $1.17 2016 87% 2016 83%
FFO – $1.34
AFFO – $1.46 2017 90% 2017 83%
2018 89% 2018 85%
2019 98% 2019 91%
(1) For the years ended December 31
(2) A reconciliation of net income per diluted share, as determined in accordance with GAAP, to FFO per diluted share and AFFO per diluted share, may be found at the end of this presentation
(3) FFO includes lease termination fees of $372,000 or $0.02 per share in 2018 and $950,000 or $0.05 per share in 2019, which are excluded from AFFO
(4) Impacting the changes in the FFO and AFFO payout ratio are distributions of gains on property sales, which gains are excluded from the calculation of FFO and AFFO
◆ 12STEADY DIVIDEND(1)
DIVIDEND PER SHARE
$1.80 $1.80 $1.80
(2)
$1.80
$1.74
$1.66
$1.60
$1.40
$1.20
$1.00
2016 2017 2018 2019 2020
(1) For the years ended December 31
(2) During 2020, approximately 18.75% of the dividend was paid in shares of our common stock
◆ 13GROWTH ORIENTED BALANCE SHEET
AS AT SEPTEMBER 30, 2020
Gross Assets(1) $930.4 M
Total Debt/Gross Assets(2) 50.1%
Fixed Rate Debt 96.3%
Debt Service Coverage Ratio(3) 2.0 to 1.0
Fixed Charge Coverage Ratio(3) 3.1 to 1.0
AFFO Payout Ratio 92.5%
Liquidity available to acquire in excess of an estimated $150.0 million of
properties as of January 7, 2021
$84.6 million available as of January 7, 2021 on Line of Credit, subject to
borrowing base requirements
(1) Gross assets represent total assets plus accumulated depreciation of $143.7 million
(2) Total debt includes our share of debt of our unconsolidated joint venture (i.e. $11.5 million) and excludes unamortized deferred financing costs (i.e. $4.0 million)
(3) Calculated in accordance with the terms of our credit facility
◆ 14MORTGAGE DEBT MATURITIES
AS AT SEPTEMBER 30, 2020 (1)
Weighted average interest rate of 4.18% on fixed rate debt
There is approximately $14.4 million ($0.71 per share) of scheduled
amortization of mortgages for the twelve months ending September 30, 2021
$200
BALLOON PAYMENTS DUE FOR THE TWELVE MONTHS ENDING SEPTEMBER 30,
$171.9
$160
$120
($ in millions)
$80
$49.5 $45.3
$40
$23.4 $25.1
$2.1
$0
2021 2022 2023 2024 2025 2026 & Beyond
(1) Includes our share of the mortgage debt of our unconsolidated joint venture (i.e. $11.5 million)
◆ 15LEASE MATURITY PROFILE
% of Contractual
Number of Contractual Rental Income Approximate Square
12 Months Ending Expiring Rental Income Under Represented by Feet Subject to Expiring
September 30, Leases Expiring Leases Expiring Leases Leases
2021 13 $ 914,520 1.2% 203,647
2022 26 14,732,145 19.4 2,138,054
2023 22 5,672,189 7.5 852,398
2024 32 10,121,421 13.3 1,289,326
2025 15 4,945,525 6.5 544,357
2026 12 4,555,677 6.0 345,385
2027 12 7,736,366 10.2 1,242,319
2028 9 3,589,357 4.7 663,408
2029 9 5,224,064 6.9 1,045,529
2030 8 3,563,023 4.7 196,482
2031 & Beyond 27 14,925,751 19.6 1,857,269
185 $75,980,038 100.0% 10,378,174
◆ 16(1)(2)
STABLE OCCUPANCY
At September 30, 2020:
Occupancy – 96.9%
100.0% 99.6% 99.3%
98.9% 98.8% 98.6%
98.1% 98.3%
97.8%
97.3%
96.8%
90.0%
80.0%
2010 2011 2012 2013 2014 2015 2016 2017 2018 2019
(1) As at December 31
(2) Based on square footage, including 100% of our unconsolidated joint ventures
◆ 17STRONG RENTAL INCOME GROWTH(1)(2)(3)
$85 For the Nine Months Ended $83.8
September 30, 2020: $63.2M
$78.8
$75.9
$75
$70.6
$65 $62.8
($ in millions)
$59.2
$55
$51.0
$45
$35
2013 2014 2015 2016 2017 2018 2019
(1) As at December 31
(2) Includes straight-line rent accruals and amortization of intangibles
(3) Rental income reflects, for all periods presented, the adoption of Financial Accounting Standards Board Accounting Standards Codification 842
◆ 18ACQUISITION TRACK RECORD
ACQUISITIONS PER YEAR
$120
$118.6
$107.5
$100 $95.2 (1)
$79.5
$80
($ in millions)
$60 $56.8
$49.3
$43.2
$40
$28.3
$20
$0
2013 2014 2015 2016 2017 2018 2019 2020
(1) Includes our 50% share of an unconsolidated joint venture property in Manahawkin, NJ
◆ 19RECENT ACQUISITIONS (1)
Current Purchase
Date Property Lease Price
Acquired Type Tenant (or d/b/a) MSA State Expiration (in ‘000s) Yield(2)
02/24/20 Industrial FedEx Northwest Arkansas AR 07/23/27 $19,150 6.4%
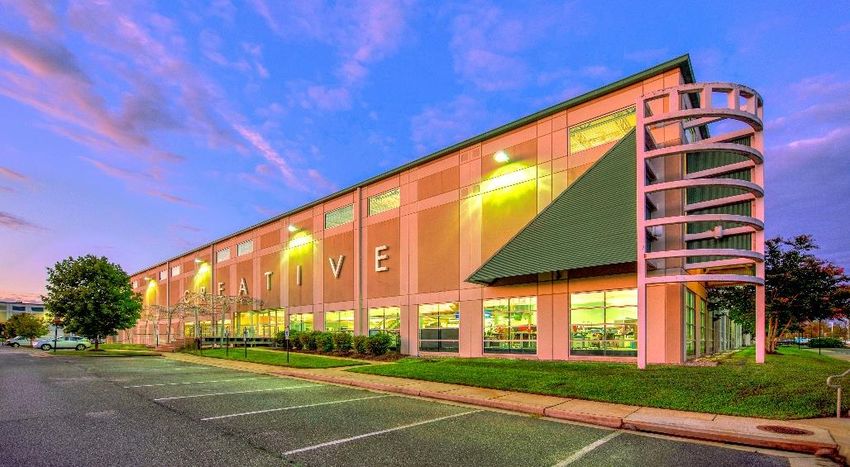
02/20/20 Industrial Creative Office Environments Richmond VA 09/30/34 $ 9,100 7.8%
10/23/19 Industrial The Door Mill Phoenix AZ 06/30/24 $ 3,000 7.3%
10/03/19 Industrial Cosentino North America Savannah GA 03/31/29 $ 6,400 7.2%
09/13/19 Industrial Continental Hydraulics Minneapolis MN 02/28/33 $ 8,000 7.3%
07/24/19 Industrial Nissan North America, Inc. Troup County GA 12/31/28 $ 5,200 6.6%
06/26/19 Industrial International Flora Technologies Phoenix AZ 06/30/29 $ 8,650 7.4%
05/31/24 -
06/18/19 Industrial Betz Mechanical Supply / Steve Davis Sales Philadelphia PA $ 6,200 7.6%
09/17/23
05/30/19 Industrial Echo, Inc. Chicago IL 01/31/24 $ 3,800 7.8%
03/31/23 -
05/30/19 Industrial Zwanenberg Food Group / Metro Carpets Nashville TN $ 8,000 7.0%
10/31/24
(1) Acquisitions were paid with cash – see Recent Mortgages for subsequent financing on certain properties
(2) Yield represents the annualized straight-line rent over the remaining term of the lease, divided by the purchase price
◆ 20RECENT DISPOSITIONS
Gross Sales
Date Date Property Price Net Gain
Sold Acquired Type Tenant (or d/b/a) MSA State (in ‘000s) (in ‘000s)
12/15/20 11/17/10 Retail PetSmart Houston TX $ 4,013 $ 1,068
12/15/20 11/17/10 Retail Guitar Center Houston TX $ 5,212 $ 1,645
07/01/20 03/31/04 Retail CarMax Knoxville TN $18,000 $10,316
(1)
03/02/20 06/18/08 Retail Lanier Realty, Inc. Savannah GA $ 825 $ 242
02/11/20 11/30/04 Retail Hobby Lobby La Crosse County WI $ 7,115 $ 4,252
12/10/19 08/06/13 Other Assisted Living Austin TX $16,600 $ 435
10/21/19 06/30/98 Retail Aaron’s Inc. Houston TX $ 1,675 $ 218
08/29/19 08/02/16 Other The Briarbrook Apartments Wheaton IL $12,066 $ 1,530
08/23/19 05/19/04 Office Supply Office Depot / JoAnn Stores Athens GA $ 6,050 $ 1,045
(1)
06/20/19 03/22/13 Retail K-Mart Winston-Salem NC $ 5,500 $ 1,099
(1) Represents 100% of the gain on the sale of a property owned by an unconsolidated joint venture in which we had a 50% interest. Our share of the gain was $121,000.
(2) Represents 100% of the gain on the sale of a property owned by a consolidated joint venture in which we had a 90% interest. Our share of the gain was $677,000.
◆ 21RECENT MORTGAGES
Date Property Amount Mortgage Interest
Financed Type Tenant (or d/b/a) MSA State (in ‘000s) Maturity Rate
03/16/20 Industrial FedEx Northwest Arkansas AR $12,500 07/01/27 3.63%
03/13/20 Industrial Creative Office Environments Richmond VA $ 5,700 04/01/35 3.54%
12/11/19 Industrial Cosentino North America Savannah GA $ 4,100 01/01/30 3.80%
11/20/19 Industrial Continental Hydraulics Minneapolis MN $ 5,000 12/01/33 3.68%
10/29/19 Industrial Nissan North America, Inc. Troup County GA $ 3,200 12/01/28 4.00%
10/11/19(1) Industrial Mitsubishi Electric Power Products New York NY $ 2,599 09/10/24 3.49%
10/03/19 Industrial International Flora Technologies Phoenix AZ $ 5,190 11/01/30 4.10%
Betz Mechanical Supply / Steve Davis
09/04/19 Industrial Philadelphia PA $ 4,075 10/01/29 4.05%
Sales
Zwanenberg Food Group / Metro
07/01/19 Industrial Nashville TN $ 5,200 08/01/29 3.95%
Carpets
(1) This mortgage was a refinance
◆ 22ACQUISITION CASE STUDY – INDUSTRIAL
CREATIVE OFFICE ENVIRONMENTS
In February 2020, acquired via sale-leaseback, Purchase Price $ 9,100,000
an industrial warehouse facility in Ashland, VA
Mortgage(1) (5,700,000)
(Richmond MSA).
Net Equity Invested $ 3,400,000
The 88,003 SF Class A building is net leased to
Creative Office Environments of Richmond LLC.
The property is well located with immediate Year 1 Base Rent $ 598,708
proximity to Interstate-95 where 60% of the US Interest Expense – 3.54%(1) (199,450)
population is within a two-day delivery radius.
Net Cash to OLP $ 399,258
The 32’ clear concrete tilt wall building was
completed in 2007, featuring 8 dock doors Return on Equity 11.74%
and 1 drive-in door.
The property serves as the headquarters and
primary distribution center for Creative Office
Environments.
Creative Office Environments was founded in
1995 and serves as the region’s leading
workplace solutions and technology provider
with clients in the corporate, education,
healthcare and government sectors.
Creative Office Environments -– Ashland, VA (Richmond MSA)
(1) Mortgage with an interest rate of 3.54% closed in March 2020
◆ 23ACQUISITION CASE STUDY – INDUSTRIAL
FEDEX
In February 2020, acquired an industrial Purchase Price $ 19,150,000
distribution center in Lowell, AR (Northwest
Arkansas MSA). Mortgage(1) (12,500,000)
Net Equity Invested $ 6,650,000
The 248,370 SF building is net leased to FedEx
Ground.
The property is well situated in the middle of Year 1 Base Rent $ 1,230,498
the MSA with excellent access to Interstate-49. Interest Expense – 3.63%(1) (448,000)
The 28-30’ clear metal and concrete building Net Cash to OLP $ 782,498
was completed in 2017, featuring 63 dock
doors and 8 drive-in doors. Return on Equity 11.77%
The property was a build-to-suit and is the sole
FedEx Ground facility serving the Northwest
Arkansas MSA.
FedEx Ground reported revenue of $22.7 billion
for the twelve-months ended May 31, 2020 –
an 11% increase over the prior year.
FedEx – Lowell, AR (Northwest Arkansas MSA)
(1) Mortgage with an interest rate of 3.63% closed in March 2020
◆ 24ACQUISITION CASE STUDY – INDUSTRIAL
ZWANENBERG FOOD & METRO CARPET
In May 2019, acquired a two-tenant industrial Purchase Price $ 8,000,000
warehouse facility in Nashville, TN.
Mortgage(1) (5,200,000)
The 99,500 SF property is net leased to
Net Equity Invested $ 2,800,000
Zwanenberg Food Group and Metro Carpets.
The infill property is well located within the
Nashville metro, approximately 2.5 miles from Year 1 Base Rent $ 531,000
both the airport and the downtown area. Interest Expense – 3.95%(1) (204,000)
The building has frontage on Elm Hill Pike, a Net Cash to OLP $ 327,000
major thoroughfare of Nashville.
Return on Equity 11.68%
The 24’ clear concrete masonry building was
built in 1974. It features 16 loading docks.
Zwanenberg expanded within the building -
committing through March 2023.
Metro Carpets owns the adjacent building and
extended their lease through October 2024.
Both leases feature ~3% annual increases.
Zwanenberg Food & Metro Carpet – Nashville, TN
(1) Mortgage with an interest rate of 3.95% closed in July 2019
◆ 25SUMMARY - WHY OLP?
Fundamentals – focused real estate company
Disciplined track record over various economic cycles
Active net lease strategy - emphasis on industrial properties
Experienced management team
Alignment of interests - significant insider ownership
◆ 26APPENDIX
◆ 27TOP TENANTS’ PROFILES
◆ 28HAVERTYS FURNITURE – TENANT PROFILE
Tenant: Haverty Furniture Companies, Inc. (NYSE: 11 properties aggregating 611,930 SF
HVT) (Source: Tenant’s website)
– Duluth (Atlanta), GA
» Full-service home furnishing retailer founded in
1885 – Fayetteville (Atlanta), GA
» Public company since 1929 – Wichita, KS
» 100 showrooms in 16 states in the Southern and – Lexington, KY
Midwestern regions – Bluffton (Hilton Head), SC
» Weathered economic cycles, from recessions – Amarillo, TX
to depressions to boom times
– Cedar Park (Austin), TX
» Total assets of $699 million and stockholders’
equity of $267 million at 9/30/2020 – Tyler, TX
Represents 7.2% of contractual rental income – Richmond, VA
– Newport News, VA
– Virginia Beach, VA
Properties subject to a unitary lease which expires
August 14, 2022
Rent per square foot on the portfolio is $7.91
Haverty – Cedar Park, TX (Austin MSA)
◆ 29FEDEX– TENANT PROFILE
Tenant: Operating Subsidiaries of FedEx Corporation 6 properties represents 4.7% of contractual rental
(NYSE: FDX)(Source: Tenant’s website) income and 678,595 SF
» World’s largest express transportation company
with service to more than 220 countries % of Contractual Rental Income
» FedEx Corporation employs more than 500,000 – Lowell, AR: 1.6%
team members worldwide through a portfolio – Delport, MO: 1.1%
of companies which include FedEx Express and
FedEx Ground – Indianapolis, IN: 0.9%
» FedEx Ground Package System, Inc. is the – Pinellas Park, FL: 0.4%
leading North American provider for ground – Durham, NC: 0.4%
and small package delivery and operates 591
facilities and 77,000 vehicles – Miamisburg, OH: 0.3%
» Total assets of $77.6 billion and stockholders’
equity of $19.5 billion at 8/31/2020
Representative: FedEx – Lowell, AR
» Location: 400N Goad Springs Road, Lowell, AR;
– Features 240,469 SF of warehouse space, and
over 7,900 SF of office space
» Building: 248,370 SF on 30.18 acres of land
» Lease expires July 23, 2027
FedEx – Lowell, AR (Northwest Arkansas MSA)
◆ 30LA FITNESS – TENANT PROFILE
Tenant: LA Fitness International LLC (Source: Tenant’s website) Representative: LA Fitness – Secaucus, NJ
» Operates over 700 clubs in 21 states » Location: 485 Harmon Meadow Blvd, Secaucus,
NJ; 4 miles west of Manhattan
» Founded in 1984 and is headquartered in Irvine,
CA – Features 2 million SF of office space, 7 hotels
and over 1 million SF of retail space
3 properties represents 4.4% of contractual rental
income and 141,663 SF » Building: 44,863 SF on 1.23 acres of land
% of Contractual Rental Income » Lease expires February 28, 2030
– Secaucus, NJ: 2.0%
– Tucker, GA: 1.3%
– Hamilton, OH: 1.1%
LA Fitness – Secaucus, NJ
◆ 31NORTHERN TOOL & EQUIPMENT – TENANT PROFILE
Tenant: Northern Tool & Equipment (Source: Tenant’s website) Location: 1850 Banks Road, Fort Mill, SC
» Distributor and retailer of industrial grade and » Building: 701,595 SF on 40.0 acres of land
personal use power tools and equipment
» Lease expires April 30, 2029
» Over 100 retail stores in the U.S.
» Acquired The Sportsman’s Guide and The Golf
Warehouse to sell outdoor sports and leisure
goods through their distribution chain
» Class A, 30’ clearance building is situated 18
miles south of downtown Charlotte, NC off
Interstate-77
Represents 3.9% of contractual rental income
Northern Tool & Equipment – Fort Mill, SC
◆ 32L3 HARRIS TECHNOLOGIES – TENANT PROFILE
Tenant: L3 Harris Technologies, Inc. (NYSE: LHX) Location: 435 Moreland Road, Hauppauge, NY
(Source: Tenant’s website)
» US based defense technology company » Building: 201,614 SF on 12.4 acres
» In June 2019, L3 Technologies and Harris » Lease expires September 30, 2033
Corporation merged to form L3 Harris
Technologies - the 6th largest US defense
company by revenues
– The merged company currently has a market
cap of $40 billion
» Represents 3.6% of contractual rental income
L3 Harris Technologies, Inc. – Hauppauge, NY
◆ 33GAAP RECONCILIATION
◆ 34GAAP RECONCILIATION
The following table provides a reconciliation of net income per share of common stock
(on a diluted basis) in accordance with GAAP to FFO and AFFO
9 Months Ended
September 30, Years Ended December 31,
2020 2019 2018 2017 2016
GAAP net income attributable to One Liberty Properties, Inc. $1.17 $ 0.88 $ 1.05 $ 1.28 $ 1.39
Add: depreciation & amortization of properties 0.84 1.11 1.24 1.12 1.02
Add: our share of depreciation & amortization of unconsolidated JVs 0.02 0.03 0.04 0.05 0.05
Add: impairment loss 0.02 - - 0.01 -
Add: amortization of deferred leasing costs 0.02 0.02 0.02 0.02 0.02
Deduct: gain on sale of real estate (0.72) (0.22) (0.27) (0.53) (0.57)
Deduct: equity in earnings from sale of unconsolidated JV properties (0.01) - (0.10) - -
Adjustments for non-controlling interests - 0.02 0.04 (0.01) (0.01)
NAREIT funds from operations per share of common stock $1.34 $ 1.84 $ 2.02 $ 1.94 $ 1.90
Deduct: straight-line rent accruals & amortization of lease intangibles (0.12) (0.10) (0.07) (0.07) (0.16)
Deduct: our share of straight-line rent accruals & amortization of
lease intangibles of unconsolidated JVs (0.01) - (0.03) - -
Deduct: lease termination fee income - (0.05) (0.02) - -
Add: amortization of restricted stock compensation 0.17 0.20 0.18 0.17 0.17
Add: prepayment costs on debt 0.06 0.04 - - 0.03
Add: amortization & write-off of deferred financing costs 0.04 0.05 0.05 0.05 0.05
Deduct: income on insurance recoveries from casualty loss (0.02) - - - -
Adjustments for non-controlling interests - - - - -
Adjusted funds from operations per share of common stock $1.46 $ 1.98 $ 2.13 $ 2.09 $ 1.99
◆ 35NON-GAAP FINANCIAL MEASURES
One Liberty compute funds from operations, or FFO, in accordance with the “White Paper on Funds From Operations” issued
by the National Association of Real Estate Investment Trusts (“NAREIT”) and NAREIT’s related guidance. FFO is defined in the
White Paper as net income (calculated in accordance with GAAP), excluding depreciation and amortization related to real
estate, gains and losses from the sale of certain real estate assets, gains and losses from change in control, impairment write-
downs of certain real estate assets and investments in entities where the impairment is directly attributable to decreases in the
value of depreciable real estate held by the entity. Adjustments for unconsolidated partnerships and joint ventures are
calculated to reflect FFO on the same basis. In computing FFO, One Liberty does not add back to net income the
amortization of costs in connection with its financing activities or depreciation of non-real estate assets. One Liberty computes
adjusted funds from operations, or AFFO, by adjusting from FFO for our straight-line rent accruals and amortization of lease
intangibles, deducting lease termination fees and adding back amortization of restricted stock and restricted stock unit
compensation expense, amortization of costs in connection with its financing activities (including our share of our
unconsolidated joint ventures), income on insurance recoveries from casualties and debt prepayment costs. Since the NAREIT
White Paper does not provide guidelines for computing AFFO, the computation of AFFO may vary from one REIT to another.
One Liberty believes that FFO and AFFO are useful and standard supplemental measures of the operating performance for
equity REITs and are used frequently by securities analysts, investors and other interested parties in evaluating equity REITs,
many of which present FFO and AFFO when reporting their operating results. FFO and AFFO are intended to exclude GAAP
historical cost depreciation and amortization of real estate assets, which assumes that the value of real estate assets diminish
predictability over time. In fact, real estate values have historically risen and fallen with market conditions. As a result,
management believes that FFO and AFFO provide a performance measure that when compared year over year, should
reflect the impact to operations from trends in occupancy rates, rental rates, operating costs, interest costs and other matters
without the inclusion of depreciation and amortization, providing a perspective that may not be necessarily apparent from
net income. Management also considers FFO and AFFO to be useful in evaluating potential property acquisitions.
FFO and AFFO do not represent net income or cash flows from operations as defined by GAAP. FFO and AFFO and should not
be considered to be an alternative to net income as a reliable measure of our operating performance; nor should FFO and
AFFO be considered an alternative to cash flows from operating, investing or financing activities (as defined by GAAP) as
measures of liquidity. FFO and AFFO do not measure whether cash flow is sufficient to fund all of our cash needs, including
principal amortization, capital improvements and distributions to stockholders.
Management recognizes that there are limitations in the use of FFO and AFFO. In evaluating our performance, management
is careful to examine GAAP measures such as net income and cash flows from operating, investing and financing activities.
◆ 36You can also read