PT Kawasan Industri Jababeka Tbk - Investor Presentation April 2019
←
→
Page content transcription
If your browser does not render page correctly, please read the page content below
PT Kawasan Industri Jababeka Tbk.
Investor Presentation
April 2019

                                    0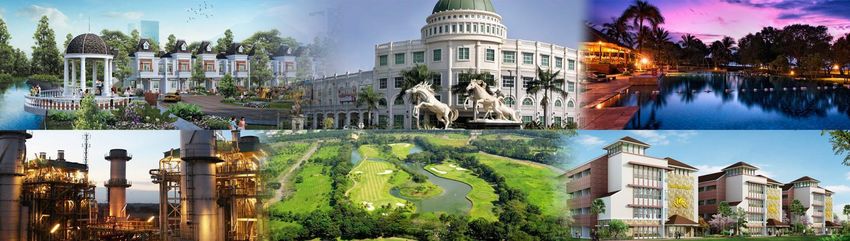
Leading township developer & infrastructure powerhouse
PT Kawasan Industri Jababeka Tbk. ("KIJA") is a leading township developer with an established track record in industry-
based townships supported by residential & commercial components...
KIJA overview Business segments
FY18 Revenue Breakdown (%)
PT Kawasan Industri Jababeka Tbk (Rp 2,712 billion)
Dry Port, 8%
Real Estate Infrastructure Water / Estate,
9%
Real Estate &
Industrial Power Others, 42%
Residential Water & Estate
Commercial Dry Port Power, 41%
Established in 1989 and became the first publicly listed industrial
FY18 Gross Profit Breakdown (%)
estate developer in Indonesia in 1994
(Rp 1,179 billion – 43% GPM)
Kota Jababeka, KIJA's flagship development, is a mature industry-
Dry Port , 6%
based integrated township in Cikarang with on-site power plant
Water / Estate,
and dry port 10%
Diversification projects: Kendal Industrial Park – Park by the Bay in
Central Java, tourism-based township in Tanjung Lesung, Banten
and a tourism development project in Morotai
Large and strategically located land bank of 3,861 hectares as of 31 Real Estate &
Power, 21%
December 2018 Others, 63%
Vision: To Create Modern Self Sustained Cities in Every
Province in Indonesia and Provide Jobs for Better Life
…with world class infrastructure to support its development
1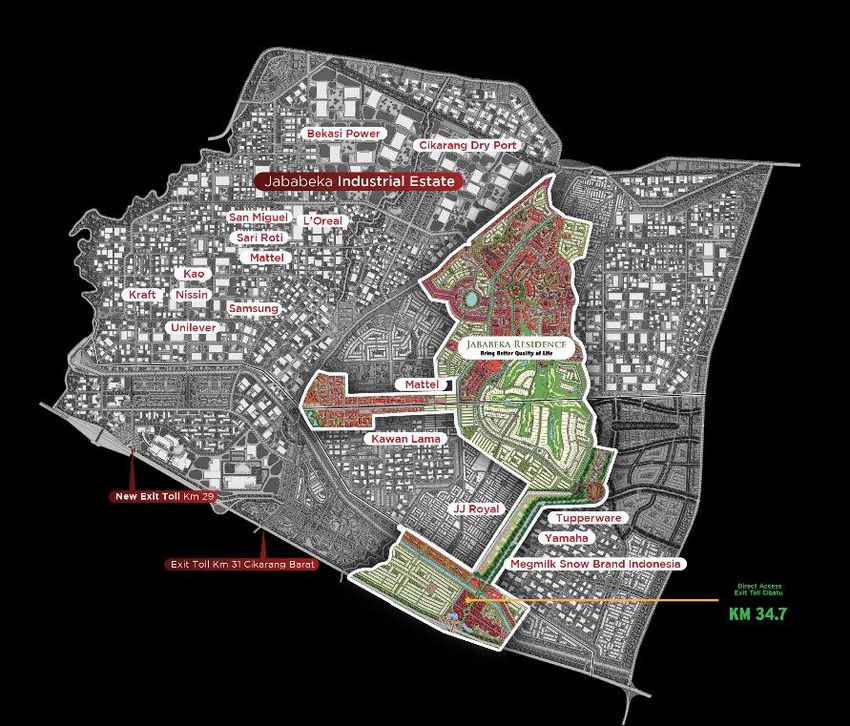
Milestones & Awards
More than 25 years track record in township development
Selected awards

              #1                                    #1

    Investor Magazine - 2012            Indonesia Property Watch-            Fortune Indonesia - 2015              SWA Magazine - 2016
      Top 10 Best performing                       2015                        Best Company award                  Top 25 Most Creative
    listed companies and Best               The best township                                                     Companies in Indonesia
   listed company in property              development concept
                                                                                                                                                                     2016

                                                                                                                                                                          Groundbreaking
                                                                                                                                                                          Kendal Industrial
              #1                                                                        #1                                                          2014                  Park – Park by
                                                                                                                                                                          the Bay
                                                                                                                                                          D’Khayangan
Frontier Consulting Group Award         Supply Chain Asia Awards 2014       Ministry of Industry - 2015                                   2013            Senior Living
   2014 #1 Corporate Image              Asia Logistics Centre/Park of the    Best Industrial Estate –                                                     Launched
                                                                                                                                            Bekasi
         Industrial Estate                             Year                 Infrastructure & Facilities                  2011               Power Plant
                                                                                                                                            commenced
                                                                                                                            Acquisition     operations
                                                                                                    2010
                                                                                                                            of 1,500 ha
                                                                                                          Cikarang Dry      land in
                                                                                 2003                                       Tanjung
                                                                                                          Port begins
                                                             2001                                         operations        Lesung,
                                                                                      Commenced                             Banten
                                        1996                                          development of
                                                                Inauguration of       Jababeka CBD
                        1994
                                                                Education Park,
   1989                                     Acquisition of      including President
                          IPO on            Menara Batavia      University
      Jababeka Group      Jakarta and       in Jakarta CBD
      established and     Surabaya
      started             Stock
      development of      Exchange
      the industrial
      estate
                                                                                                                                                                                        2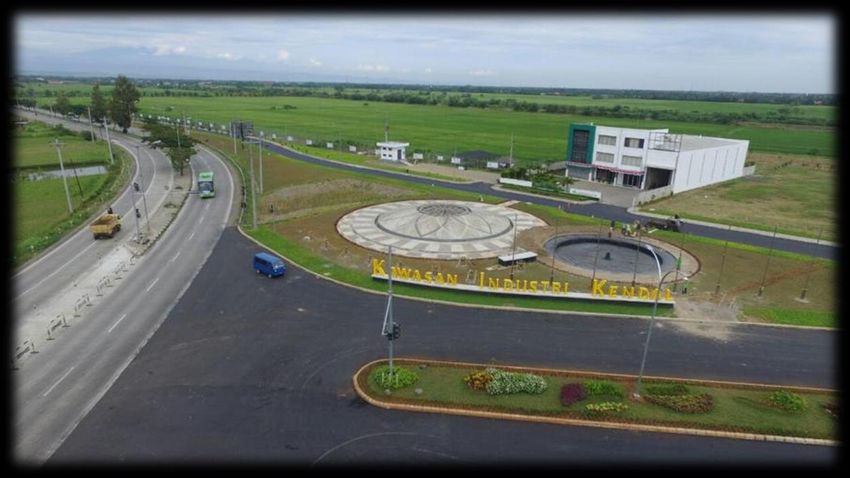
Sizeable land bank in strategic locations with upside potential
Kota Jababeka Cikarang
Master plan: 5,600 hectares
Fully integrated and matured city development 35km east
of Jakarta, 45mins from Jakarta’s CBD
35km east of Jakarta
Land Bank: 1,235ha(1) Most established industrial area in Greater Jakarta, home
to >2,000 local and multinational companies
INDONESIA
Tanjung
Lesung
Kota
Jababeka Kendal,
Cikarang Central Java
Semarang
Karawang
Surabaya
Tanjung Lesung
Master plan: 1,551 hectares
170km southwest of Jakarta
Land Bank: 1,532ha(1)
Kendal, Central Java Designated strategic estate
status under presidential
Designated as a Special Economic Zone
Master plan: 2,700 hectares decree
450km east of Jakarta Strategically located along
Located 180km southwest of Jakarta and covers 1,500 Land Bank: 572ha(1) the Jakarta-Semarang-
ha of untouched peninsula facing the Indian Ocean
Surabaya Economic
Envisaged to become a first-class integrated resort
destination for both domestic and international tourists Offers a deep pool of young
and skilled labour at a
Corridor
competitive cost
Note:
1 Land bank as at 31 December 2018 3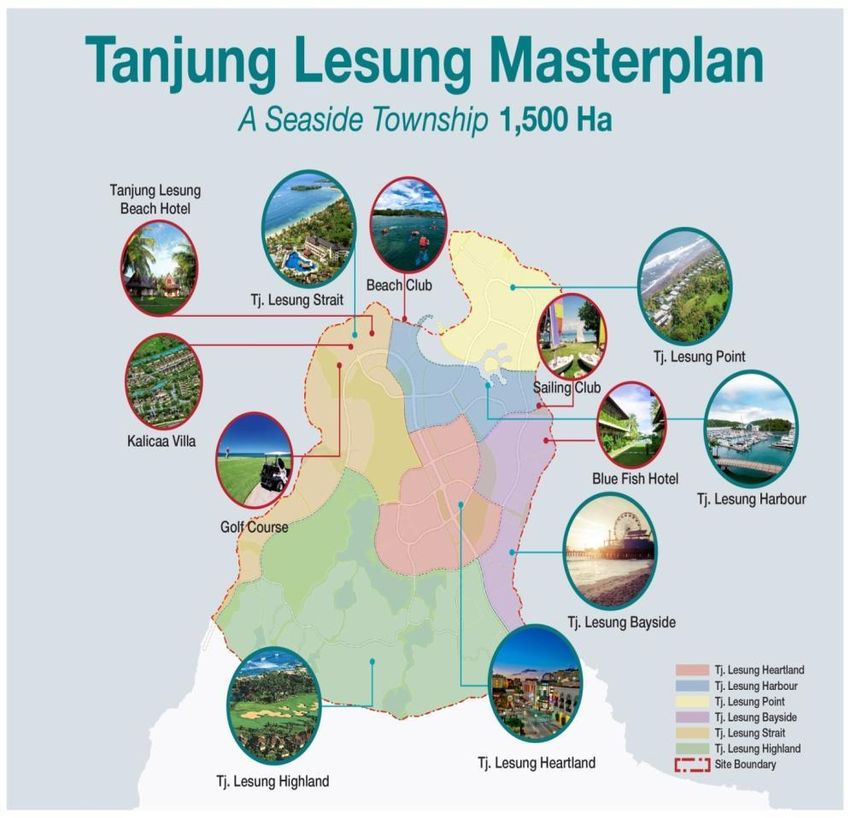
1        Kota Jababeka — Flagship industry-based integrated township
Kota Jababeka is a mature industry-based township strategically located in close proximity to Jakarta CBD, sea port and
airport…

Excellent accessibility and connectivity with 3 Exit Toll Accesses to Kota Jababeka
and development of Major Transportation Infrastructure along Jakarta Eastern Corridor to Kota Jababeka.

                                                           1.5 hours
                                                                                                                         Proposed
                                                                                                                        MRT Station

                               JAKARTA
                                                                                                     KOTA JABABEKA
                                                                                              KM 29
                                                                                                       KM 31
      6 lane Highway of Jakarta Inner Ring Road

                                                                             Tranportation infrastructure          KM 34
                                                                             (Proposed / Under Construction)
  •       35 KM from Jakarta City                                                   LRT Track
  •       Close to International Airport & Seaport                                 High Speed Train
                                                                                    Elevated Toll Road
  •       Accessible by toll road and railway                                       MRT Track
                                                                                   Double-double track Railway

                                  …and is home to over 2,000 local and multinational customers from over 20 countries
                                                                                                                                      4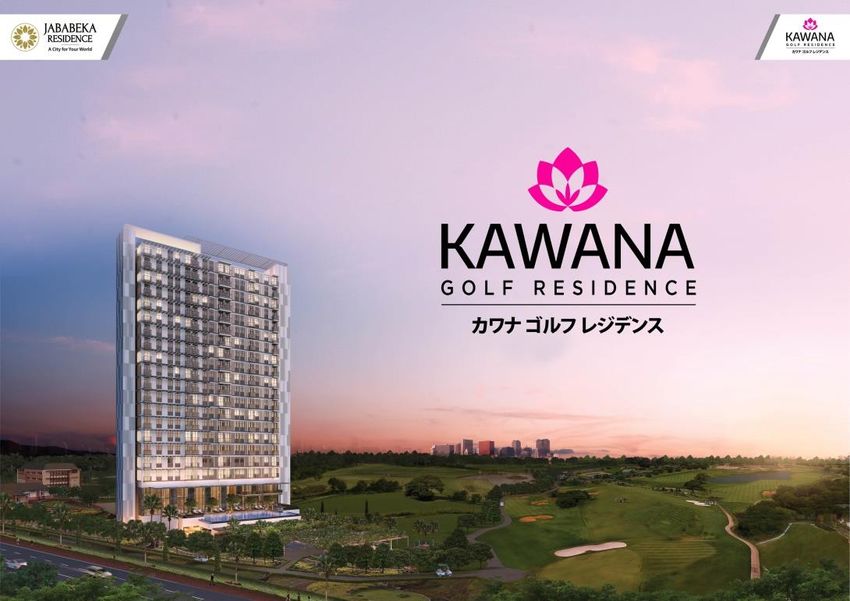
1    Kota Jababeka – Anchored by a blue-chip customer base
The portfolio of high quality multinational and domestic customers at Kota Jababeka is a testament to the township's
strategic location and superior infrastructure facilities

Diverse mix of occupants across sectors
(breakdown by number of occupants) – As of 31 December 2018      Portfolio of high quality customers

                                             Electronics
                          11%
                                             Machinery
                                  7%         Customer Goods
                                             Chemicals
       45%                             6%    Automotive
                                             Plastics
                                       6%
                                             Foods

                                      6%     Building
                                             Metal Fabrication
                                 5%
                            4%               Tekstile
                  2%4% 4%
                                             Others

                                                                                                                       5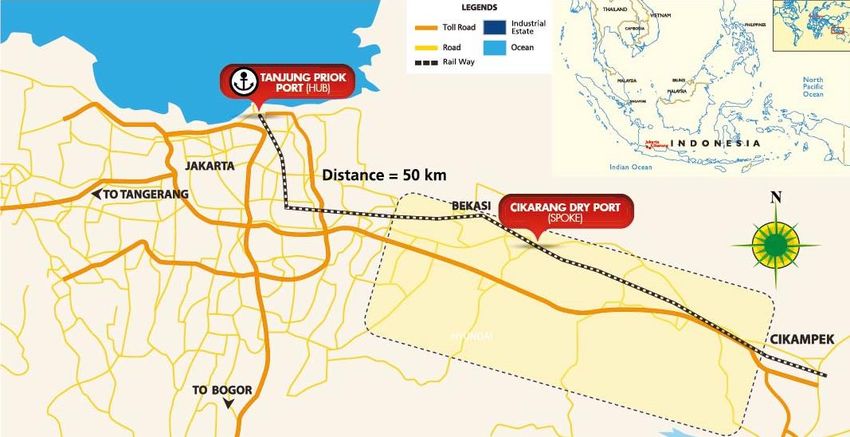
1     Jababeka Residence – A City for Your World
Residential & Commercial Developments

  Oscar Townhouse          Sudirman Boulevard
       Cluster              Commercial Center

Mixed-Use Developments
                                                     KM 29

                                                                KM 31

     Hollywood Junction, Monroe & Elvis Tower                                  KM 34

Facilities

 International                      President      Jababeka Golf &   Senior Living       Jababeka        Jababeka Stadium
                    Hospitals
    Hotels                         University &      Country Club    D’Khayangan     Convention Center
                                                                                                                       6
                                 Reputable Schools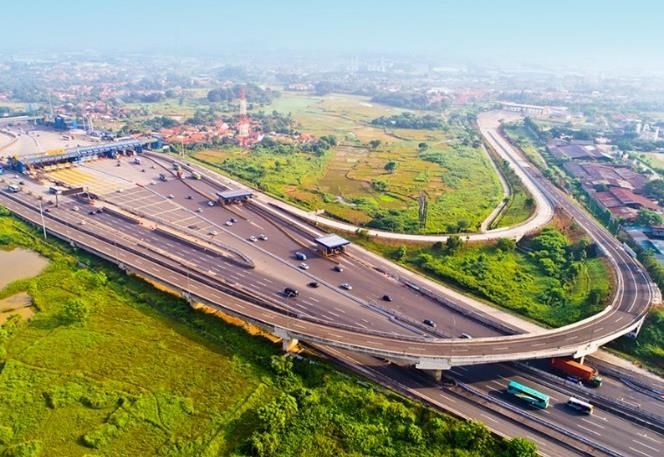
1 Kota Jababeka – Enhancing value through Joint Venture projects
PT PP Properti (Persero) Tbk PT Plaza Indonesia Realty Tbk
51% 30%
“Riverview “MAYFAIR Estate
JV 1 JV 1
49% Residence” 70% & Park Land”
4 apartment towers strategically located near the toll exit & catering Mixed use superblock on a 12-ha site right next to the golf course
to the lower end of the market Groundbreaking happened in June 2015; piling completed
Tower 1 (1009) – Mahakam Tower –> 90% sold, 10% handed over
Tower 2 (939) – Bengawan Tower –> 23% sold, piling completed
47.4% 70%
JV 2 JV 2
52.6% 30%
Mixed use superblock on a 4.6-ha site To be developed on 4-ha site adjacent to JV 1
With 6 apartment towers and Japanese style mall Concept to be decided on at a later stage – to support /
complement JV 1
7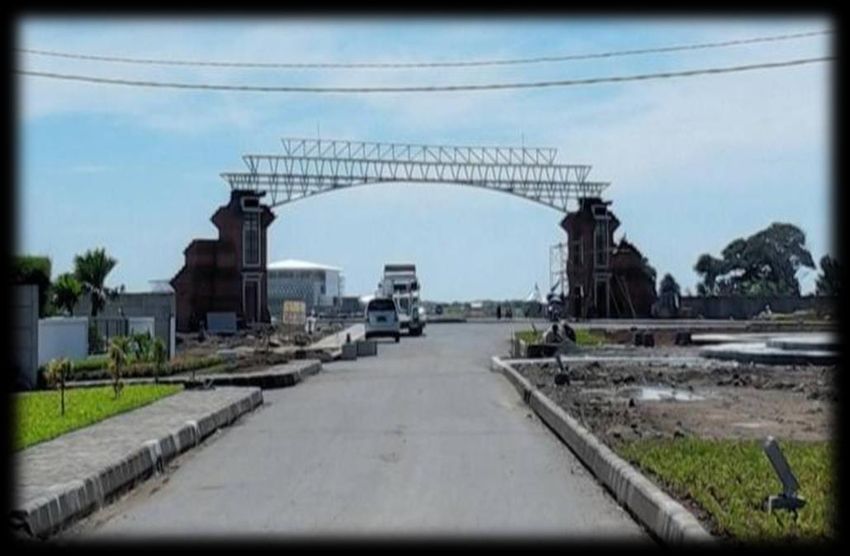
1 Kota Jababeka – Kawana Golf Residence
Kawana Golf Residence – The One & Only Golf Residence in Indonesia
Kawana Golf Residence is a JV between KIJA’s Jababeka Residence (60%) and Creed Group (40%) from Japan
High-end golf view apartment tower with 234 units
Total 100% sold in 2 phases – delivery scheduled in 2020
Kawana 2 planned to be launched later in 2019
8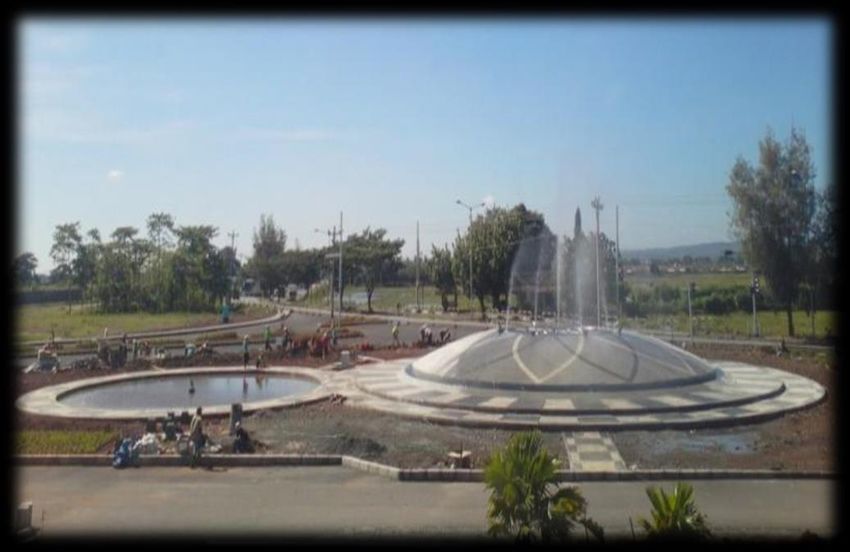
2    Enhancing Kota Jababeka's value proposition: Jababeka Infrastruktur
PT Jababeka Infrastruktur provides top notch to infrastructure and services, including clean water provision, waste water
treatment, estate management, and other services such in-house fire brigade, 24 hour security, fiber optics, natural gas
and others…
                                                                                                    WWTP 2
                               WTP 1
                              Capacity     WTP 2                                          WWTP 1 Capacity
                              400 L/sec   Capacity                                        Capacity 125 L/sec
                                          200 L/sec                                       208 L/sec

                                                                                               Waste Water
                                                                                               Treatment Plan

Water Treatment
     Plan

                                                              Telco           Natural Gas

                                    …which meet the international standards and operate in accordance with environmentally
                                                                friendly policies in integrated city Kota Jababeka in Cikarang
                                                                                                                                 9
2 Enhancing Kota Jababeka's value proposition: Bekasi Power Plant
KIJA is the only industrial estate developer in Indonesia with its own power plant located within its estate
Integrated Power Generation & Distribution Process 130MW gas fired combined cycle plant
20 year 100% off-take agreement from Perusahaan Listrik Negara
1 (“PLN”)
100% output to PLN – Rate per KWH: ~US$11 cents
– Average gas cost / MMBTU: ~US$8.7
– Fuel costs borne by PLN on a pass-through basis
2 Buy back from PLN PLN – Fully contracted gas supply
(+16% margin) – Flexibility to buy back power and resell it at a premium
During repair of a leakage in one of the boilers the power plant
3 Direct sale to factories operated at about 50% of the usual capacity for about 3 months in
(+ margin) 2016
The power plant was in full “reserve shutdown” for most of 1Q18 and
Factories has operated intermittently since then, since 3Q18 on 5 days full
capacity during the week and half capacity on weekends on average
Financial Highlights Operational Highlights
IDR billion
Description 2014 2015 2016 2017 2018
1,600 1,499 25.0%
1,310 1,360 22.5%
1,400 1,267 Net Dependable Capacity 118.8MW 120MW 120MW 121MW 120MW
20.0%
1,200 1,102
17.1% Load Factor 108MW 110MW 93MW 109.MW 110MW
1,000 15.0%
14.3%
800 12.2% 12.5% Capacity factor 90.01% 90.01% 81.85% 87.95% 92.24%
600 10.0%
Equivalent Availability Factor 90.34% 96.39% 82.85% 94.53% 98.15
400 232 248
215 164 5.0%
155 Planned Outage Factor 7.88% 3.09% 15.15% 5.00% 1.62%
200
- 0.0% Equivalent Forced Outage Rate 1.78% 0.52% 2.00% 0.47% 0.23%
2014 2015 2016 2017 2018
Revenue Gross Profit Gross Profit Margin
Providing a significant marketing advantage over its competitors as access to reliable electricity supply is one of the
primary concerns for industrial clients in Indonesia
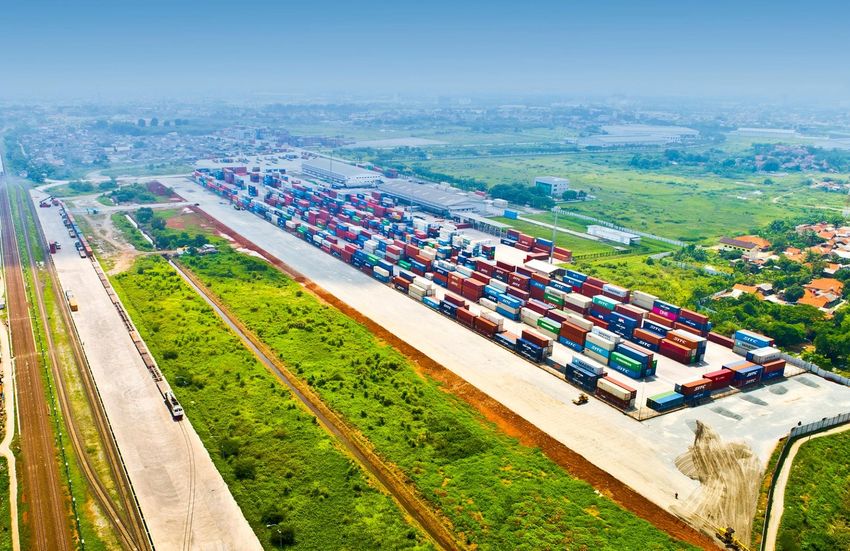
102 Enhancing Kota Jababeka's value proposition: Cikarang Dry Port
Strategic location in the heart of the largest manufacturing zone along the Bekasi-Cikampek industrial corridor…
Airport
JABABEKA
MM 2100
EJIP LIPPO
62%1
HYUNDAI GIIC SURYA CIPTA
KIIC KIKC
KIM
Enhanced Accessibility with New Toll Gate KM 29 Railway Connectivity to the Sea Port KBI
New Toll
Cikarang Utama
Gate KM 29
Toll Gate
Highway
Exit KM 29
International Port Code: IDJBK
Surrounded by 11 Industrial Estates and
more than 3,000 manufacturing companiee
Flyover to
Notes:
Jakarta 11
1 Estimated % of total throughput at Tanjung Priok Port originating from this area2 Enhancing Kota Jababeka's value proposition: Cikarang Dry Port
Empty New Office 3rd Party
Bonded DC Customs
Depot & PLB 2
Logistic
Gate Office:
s
Port Code: CDP,
Center
IDJBK Quarantine,
(PLB)
& Banking
Physical
Inspection
Container Freight Station
Reefer
Mobile X-
Ray
Container Yard
200 ha of
integrated port & logistics facilities 122 Enhancing Kota Jababeka's value proposition: Cikarang Dry Port
Cikarang Dry Port (CDP) is the first and only integrated customs, quarantine and logistics facility in Indonesia…
Overview Strong momentum in CDP operations
Since 2012, Cikarang Dry Port is an official port of origin and Revenue (IDR billion)
destination with international port code IDJBK – now
250 225
connected with 25 major shipping lines
Integrated port and logistics facilities with multi modal 200
transportation services 171
151
Smart Port Solution to streamline the business process 150
120
Besides export/import, CDP also serves domestic distribution
100 78
via main railway line that runs from west Java to east Java and
also combining it with domestics shipping lines services
50
Bonded Logistics Centre (FTZ facilities) for Cotton &
minerals/metals -
Selected customer & partner profile at Cikarang Dry Port 2014 2015 2016 2017 2018
Shipping Lines: Throughput (TEU)
120,000
Third Party Logistics Provider (3PL): 100,000 95,314
80,000 73,946
65,250
Shippers / Consignees: 60,000 50,844
37,507
40,000
20,000
-
2014 2015 2016 2017 2018
…allowing customers to more efficiently manage their imports and exports and benefit from cost savings
133 Diversified land bank
A geographically diversified land bank allows KIJA to capture different market segments and enhances earnings resilience…
Diversified by geography, positioning and segment
Land Bank Kota Jababeka Kendal Industrial Park – Tanjung Lesung
Park by the Bay
Total(1): 3,362ha
1,235ha 572ha 1,532ha
Positioning
Positioning Established MNCs and domestic More cost-conscious customers Tourism, leisure and hospitality
companies willing to pay a premium looking for an alternative to Greater focused integrated township to tap
for strategic location and mature Jakarta industrial estates that still into entertainment/leisure spending
township with top notch provides top notch infrastructure by rising middle class in Indonesia
infrastructure in place
Well diversified across multiple segments (Breakdown of segments by 2018 revenue contribution)
Real Estate(2): 42% Recurring(3): 58%
17% 3% 7% 6% 2% 3% 4% 41% 9% 8%
0% 10% 20% 30% 40% 50% 60% 70% 80% 90% 100%
Developed Land Factory Buildings Commercial Residential Tourism Golf Others Power Plant Water & Estate Services Dry Port
…in addition to benefiting from future infrastructure developments across its land bank locations
Notes:
1 As per 31 December 2018 and excluding Morotai with 521 hectares of land bank
2 Comprises real estate, golf and other non-infrastructure segments
3 Recurring revenue includes contribution from power plant, dry port and service & maintenance fees 144 Diversified projects: Kendal Industrial Park – Park by the Bay
Kendal Industrial Park – Park by the Bay benefits from Sembcorp's expertise in developing and marketing industrial zones
across Asia (China, Vietnam, Batam, Bintan, etc)…
Kendal Industrial Park – Park by the Bay is a JV between KIJA and Excellent connectivity to major infrastructure in Central Java
Sembcorp
Kendal Port
Tanjung Emas
Seaport
49% 51%
Ahmad Yani Semarang
Int'l Airport
Total planned area: 2,700 hectares
Phase 1: 860 hectares
Distance to Kendal Industrial Park – Park by the Bay
Tanjung Emas International Seaport (Indonesia's 3rd largest) 25 km
Ahmad Yani International Airport 20 km
Semarang (Central Java capital) 21 km
…and complemented by KIJA’s long track record and experience in Indonesia industrial estate developments and
infrastructure operations
154 Diversified projects: Kendal Industrial Park – Park by the Bay
Our Kendal Industrial Park – Park by the Bay development in Central Java is well-positioned to benefit from growing demand
for relatively low cost industrial estates with good connectivity and competitive labor costs
Macro infrastructure planning that supports growth of Kendal Industrial Park – improved connectivity and
accessibility (for exmaple newly opened Trans Java toll road and new Ahmad Yani Airport
Competitive manpower / low labour costs in Central Java makes Kendal Industrial Park – Park by the Bay
Key Highlights particularly interesting for labor intensive industries
Numerous human resources education & training facilities
Top notch infrastructure & One-stop solution for licensing, manpower recruitment, on-site logistics, security
and estate management services
Diverse mix of occupants across sectors
(breakdown by number of occupants) – As of March 2019
Others, 12%
Logistics, 17%
Commercial,
6%
Pharmaceutical,
6%
F&B, 15%
Paper, 6%
Metals, 6%
Bicycle & Construction,
Toys, 8% 15%
Furniture, 9% Official opening ceremony on November 14th 2016 by the President of
Indonesia, Mr Joko Widodo, and the Prime Minister of Singapore, Mr
Lee Hsien Loong 164 Diversified projects: Kendal Industrial Park – Park by the Bay
174 Diversified projects: Tanjung Lesung
Tanjung Lesung overview
Malaysia
Singapore Location ~ 180 km southwest of Jakarta in Banten
Indonesia
Tanjung Lesung
Tourism-based integrated township (hotels,
Concept
apartments, sailing, diving & beach clubs)
Australia Currently accessible by toll road from Jakarta in
Access
~ 3.5 hours
SOEKARNO – HATTA
Merak
International Airport
Krakatau Anyer
Serang
Mountain Jakarta
Pandeglang Jakarta-Merak
Toll Road
Tanjung Lesung
Labuan
Future
Toll road
Panaitan
Island Panimbang
Ujung Kulon
President Joko Widodo speaking on
National Park Tanjung Lesung’s designation as Special
Economic Zone for Tourism
184 Diversified projects: Tanjung Lesung
Strong government support for Tanjung Lesung's development as a tourism zone...
Facilities and infrastructure at Tanjung Lesung
Existing infrastructure includes access roads, a water treatment plant, wastewater treatment
plant, electricity supply and telecommunication links
Visitors currently have access to ~ 300 rooms spread out over two hotels/resorts, a bed and
breakfast and several cottages
Other facilities: restaurant and bar, golf course, a swimming pool, a spa, a beach club, a sailing Golf course
club, private air strip, school, mosque, residential housing units, and a medical clinic
Strong government support for development of Tanjung Lesung
One of 10 New Tourism Destinations in Indonesia that the Indonesian Government is
promoting
New toll road from Serang Timur to Panimbang: A consortium led by PT Wijaya Karya Tbk
(Persero) won the tender for this project, land acquisition is ongoing and construction has Aerial view
commenced
Tanjung Lesung has been designated as Special Economic Zone for Tourism
Villa with private pool at Tanjung Lesung
…is expected to increase interest from potential investors/partners for the project
194 Diversified projects: Tanjung Lesung
Current property products
KALICAA
VILLA
204 Diversified projects: Morotai
Future tourism and logistics hub strategically located in the heart of Pacific Asia with natural tropical beauty and World War
2 historic sites and relics
Morotai
Strategically located in the Halmahera group of eastern
Indonesia’s Maluku islands, in the heart of Pacific Asia in
between Asia and Australia
3 hours flight from Singapore and Taipei
Great potential for tourism,
industries and as a logistics hub
agricultural and fishing
Morotai is a Special Economic Zone for tourism and 1 of 10
new tourism destinations promoted by the government
Beach view at Morotai
PTimplementing
Jababeka Morotai has been appointed as the
entity of the Morotai development project
by the Coordinating Ministry of Economic Affairs of the
Republic of Indonesia
Evening view at Morotai
215 Clear strategic focus
KIJA's existing pipeline provides visible opportunities over different time frames
Continue to develop and capitalize on
Development of Tanjung Lesung
Kota Jababeka Township
tourism-based township
Short Term Medium Term
Further development of Kendal
Development of Morotai, initially as a
Industrial Park in partnership with
tourism-based township
Sembcorp in Central Java
Long Term Vision
Replicate Kota Jababeka's industry-based integrated township model throughout Indonesia
Build out an infrastructure facility portfolio (power, water, ports, etc.) to support these new townships
226 Financial Highlights
Revenue breakdown (IDR billion) Gross profit (IDR billion) and Gross profit margin (%)
3,500 1,600 60%
3,140
2,931 2,995
3,000 2,799 1,400 55%
2,712 1,389
2,500 1,272 1,200 50%
1,221 1,252 1,243
1,208 1,137 1,179
1,207 1,142 1,000 45% 44% 45%
2,000 42% 43%
800 40%
1,500 38%
600 35%
1,000 1,868
1,592 1,723 1,774 1,570 400 30%
500 200 25%
- 0 20%
2014 2015 2016 2017 2018 2014 2015 2016 2017 2018
Recurring revenue Real estate & other revenue Gross profit Gross profit margin
EBITDA (IDR billion) and EBITDA margin (%) Net income (IDR billion)
1,400 60% 450
1,200 55% 400
(1)
427 (2)
399
1,167 350
1,130 50%
1,000
1,025 300 331 (1)
943 45%
800 914 250
40% 40%
600 37% 200
35% 35% 35%
150
400 31% 150 (2)
30%
100
200 25% 50
67 (1)
0 20% 0
2014 2015 2016 2017 2018 2014 2015 2016 2017 2018
EBITDA EBITDA margin
Notes:
1 Approximate unrealized foreign exchange loss (non cash) for FY14: IDR 65 billion, FY15: IDR 156 billion, FY18: IDR 248 billion
2 Approximate unrealized foreign exchange gain (non cash) for FY16: IDR 135 billion, FY17: IDR 59 billion – and in FY17 additional 1-off expenses of Rp 175bn as a result of redemption of 2019 senior notes 236 Balance Sheet Highlights
Assets and cash (IDR billion) Debt, Equity (IDR billion) and Debt/Equity (x)
14,000 7,000 1.00
5,900 6,053
12,000 11,226 11,784 6,000 5,638
10,734 0.90
9,741 4,978
10,000 5,000 4,662
8,505 4,359 0.80
4,041
8,000 4,000 3,510 3,565
0.71 0.72 0.70
2,705 0.68
6,000 3,000
0.63
0.60
4,000 2,000 0.58
2,000 1,000 0.50
0 595 827 792 895 884
0 0.40
2014 2015 2016 2017 2018 2014 2015 2016 2017 2018
Cash and cash equivalents Total assets Total debt Total equity Debt/Equity
EBITDA/Interest expense (x)1 Net debt/EBITDA (x)
4.5 4.0
4.0 3.5 3.7
3.8 3.4
3.5 3.0
3.0 3.4
3.1 2.5 2.7
2.5 2.7 2.0 2.3
2.0 2.3
1.5 1.9
1.5
1.0
1.0
0.5 0.5
0.0 0.0
2014 2015 2016 2017 2018 2014 2015 2016 2017 2018
Notes:
1 Includes capitalized interest + Hedging Fees 246 Debt Overview
Debt Maturity Profile (Million USD)
Fixed vs Floating Interest Rate
$300.0 30 2%
25 Floating
Fixed
20 98%
15
IDR vs USD Debt
10
$6.5 2%
$3.3 $3.6 5
$0.6 $0.9 $1.95 IDR
$0.6
0 USD
2019 2020 2021 2022 2023 98%
Bank Tabungan Negara Bank Central Asia Standard Chartered Global Notes
Total Debt as of FY18 IDR 4.359 billion equivalent – average cost of debt 6.58% p.a.
Bank Tabungan Negara IDR 102.3bn as per FY18 10.5% p.a. Construction Loan (JV w PT PP – Riverview)
Bank Loans Bank Central Asia USD 3.15mn as per FY18 5.25% p.a. Project loan (warehouse in logistics park)
Standard Chartered Bank USD 6.5mn as per FY18 3M LIBOR + 3.75% p.a. Working Capital at Bekasi Power (rolling)
Global Notes US$ 300 million Guaranteed Senior Notes Due 2023 (7NC4) 6.5% p.a.
US$ 200 million notional is hedged by means of call spreads with an average lower strike of 13,021 Rupiah and an average
upper strike of 15,997 Rupiah
Hedging Practice
Recurring revenue provides stability and visibility of cash flows , which are partially based on USD pricing terms (power &
water) providing a natural hedge for USD-denominated interest expenses
257 Experienced management team
Average of more than 25 years of industrial township development experience
Board of Commissioners
Setyono Djuandi Darmono Bacelius Ruru Hadi Rahardja Gan Michael
President Commissioner Vice President Commissioner Commissioner Commissioner
(Founder) Independent Commissioner (Founder)
Board of Directors
Budianto Liman Hyanto Wihadhi Sutedja Sidarta Darmono Tjahjadi Rahardja Setiawan Mardjuki Basuri Tjahaja Purnama
President Director Director Director Director Director Director
268 KIJA NAV – As per 30 December 2018
Land bank Size (ha) ASP (Rp million) NAV (Rp bn)
Cikarang Inventory 166 4.00 6,640
Land for Development* 1,069 0.55 5,881
Kendal Inventory 1 1.50 10
Land for Development* 572 0.35 2,001
Tanjung Lesung Inventory 22 1.00 216
Land for Development* 1,511 0.25 3,777
Morotai Inventory 475 0.20 951
Land for Development 46 0.02 9
Subtotal land bank 19,485
Infrastructure & Others (DCF) 2,717
Add (cash, advances, investments in associates, deposits, etc) 2,099
Deduct (loans, customer advances, etc) (5,328)
Total NAV 18,974
Number of shares (billion): 20.82
NAV per share 911
Current Share Price 242
Discount to NAV 73%
* Replacement value
Disclaimer:
The purpose of this section is to provide shareholders, bondholders, analysts, brokers/dealers, potential investors and other capital market participants with a general
overview of the Company’s internal net asset value (NAV) calculation. The information is provided for quick reference only.
The information provided is not an offer to sell securities or the solicitation of an offer to buy securities. The information has been compiled from sources believed to be
reliable. The information contained in this section is subject to change without notice, its accuracy is not guaranteed and it may not contain all material information
concerning the Company. The Company makes no representation regarding, or assumes any responsibility or liability for, the accuracy or completeness of, or any errors27
in or omissions from, any information contained herein.Thank You
www.jababeka.com
28You can also read