West Coast Trade Report - Pacific Merchant Shipping ...
←
→
Page content transcription
If your browser does not render page correctly, please read the page content below
West Coast Trade Report
March 2017
Provisionally Assessing the Early 2017
Numbers
2017 started well for U.S. West Coast (USWC) ports but then faltered.
That’s hardly news. The fault lies chiefly with the moveable feast
that is the Lunar New Year, which customarily skews maritime trade
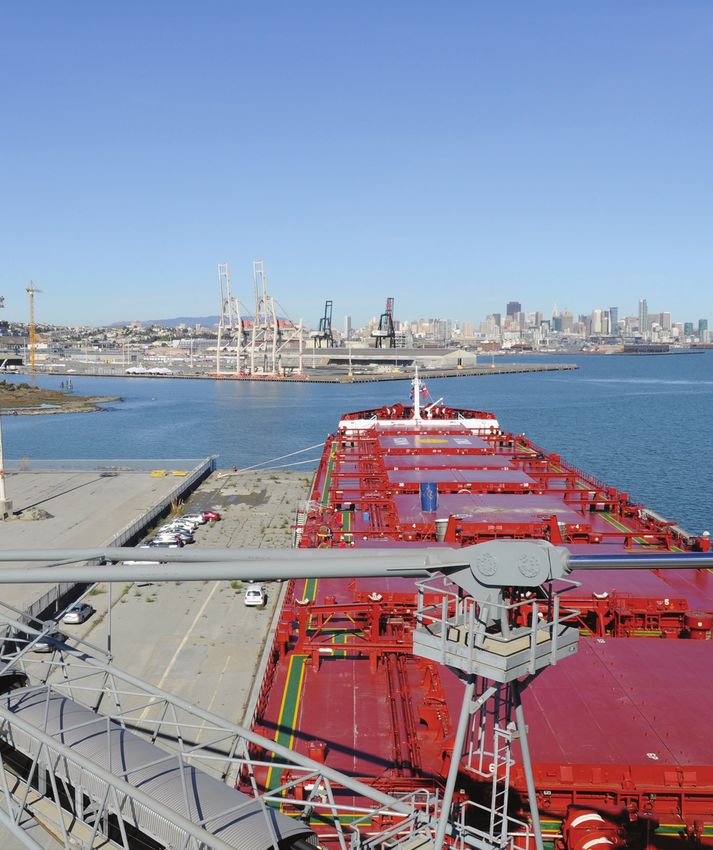
Photos courtesy of the Port of San Francisco
numbers during the first couple of months each year. This time
around, USWC container trade surged year-over-year in January, but
early returns from the Ports of Los Angeles, Long Beach, and Oakland
show that inbound volumes - at least at those three major ports -
diminished sharply in February.
Let’s start with the good news brought by January’s data. Statistics
compiled by the Pacific Maritime Association reported a 5.9%
Credit: Jay Ach
increase in discharged (inbound) traffic in January (911,973 TEUs)
from the same month a year earlier (861,485 TEUs). Trade on the
Continued
Exhibit 1 January 2017 - Inbound Loaded TEUs at Selected Ports
Jan 2017 Jan 2016 % Change
Los Angeles 415,423 367,209 13.1%
Long Beach 298,990 278,491 7.4%
Oakland 80,443 77,639 3.6%
NWSA 128,892 108,441 18.9%
NYNJ 260,725 247,129 5.5%
Maryland 40,302 34,907 15.5%
Virginia 101,302 84,186 20.3%
South Carolina 83,098 66,295 25.3%
Georgia 154,363 129,554 19.1%
Port Everglades 30,982 28,499 8.7%
Houston 84,589 65,196 29.7%
Jaxport 25,010 21,725 15.1%
Vancouver 129,139 135,478 -4.7%
Prince Rupert 40,989 39,540 3.7%
Manzanillo 71,416 64,091 11.4%
Lazaro Cardenas 36,314 35,164 3.3%
Source Individual Ports
Pacific Merchant Shipping Association
70 Washington Street, Suite 305, Oakland, CA 94607
pmsaship.com
510-987-5000 info@pmsaship.com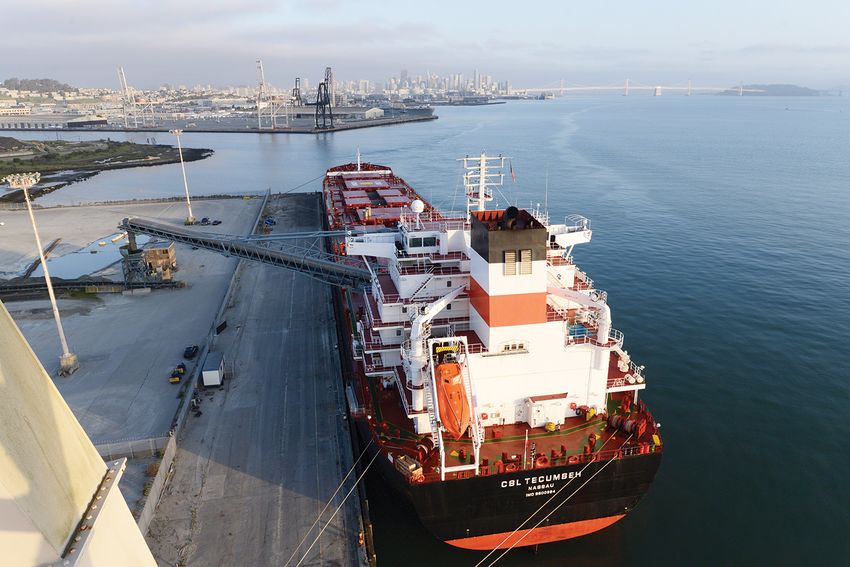
West Coast Trade Report

Provisionally Assessing the Early 2017 Numbers Continued

outbound leg was even more robust, with an 11.5% jump              share of the declared weight of the contents of containers
in TEUs (441,059 over 395,627).                                    entering mainland U.S. ports in January 2017 also
                                                                   declined from 42.9% in January 2016 to 40.1% in January
The five major USWC container ports themselves reported            2017.
even larger gains. On the inbound side, the five collectively
reported 923,748 inbound loaded TEUs this January as               But Exports Up
opposed to 831,780 TEUs the previous January, a surge of           On the export side, the USWC share of the declared
11.1%. Loaded outbound containers reported by the ports            value of containerized exports departing mainland U.S.
meanwhile jumped 17.7% from 365,682 TEUs in January                ports skipped up from 34.7% in January 2016 to 37.4% in
2016 to 430,345 TEUs this January.                                 January 2017. Similarly rising was the USWC share of the
                                                                   declared weight of containerized exports from mainland
By contrast, Canada’s two West Coast ports (Vancouver              ports, from 32.7% in January 2016 to 34.3% in January
and Prince Rupert) reported a drop of 2.8% in loaded               2017.
inbound TEUs, while registering a slender 1.2% increase in
outbound loaded TEUs.                                              Growth in the outbound trade from USWC ports continued
                                                                   to defy conventional expectations that a strong dollar
Declared Value and Weight of Imports Down                          normally discourages exports. The major mover behind
Measured by the declared value of the contents of                  the increasing volume loaded outbound containers in
containerized shipments as reported to the U.S.                    January continued to be wood pulp, which saw its share
Government, USWC ports saw their share of containerized            of USWC containerized exports (measured by weight)
imports entering mainland U.S. ports slip from 50.8%               expand to 19.5% in January from 13.6% a year earlier.
in January 2016 to 49.2% in January 2017. The USWC
                                                                                                                      Continued

 Exhibit 2        January 2017 - Outbound Loaded TEUs at Selected Ports
                                              Jan 2017                       Jan 2016                     % Change
Los Angeles                                              162,420                        126,241                       28.7%
Long Beach                                               118,234                        106,739                       10.8%
Oakland                                                   73,352                         67,272                         9.0%
NWSA                                                      76,339                         65,430                       16.7%
NYNJ                                                     110,958                        102,669                         8.1%
Maryland                                                  22,516                         18,373                       22.5%
Virginia                                                  89,767                         76,360                       17.6%
South Carolina                                            66,868                         52,290                       27.9%
Georgia                                                  117,390                        100,725                       16.5%
Port Everglades                                           32,445                         31,435                         3.2%
Houston                                                   88,403                         67,094                       31.8%
Jaxport                                                   30,000                         28,746                         4.4%
Vancouver                                                 85,464                         83,265                         2.6%
Prince Rupert                                             11,294                         12,362                        -8.3%
Manzanillo                                                68,775                         54,866                       25.4%
Lazaro Cardenas                                           30,105                         28,067                         7.3%
                                                                                                           Source Individual Ports

                                                                                                     March 2017          Page 2
West Coast Trade Report

Provisionally Assessing the Early 2017 Numbers Continued

So far, so good. Then came February. Online postings                                         A press release from the Port of Oakland indicated that
by the Ports of Los Angeles, Long Beach, and Oakland                                         “inclement weather in the U.S. interior played a role in
show a combined 17.1% year-over-year fall-off in loaded                                      curtailing shipments of Asia-bound exports” through the
inbound TEUs in February and a relatively modest 2.2%                                        Northern California gateway.
increase in loaded outbound TEUs. Overall, the three
container ports handled only 0.2% more loaded and                                            Another explanation we are hearing involves reports that
unloaded TEUs during the first two months of the year                                        some Midwest exporters have been having trouble finding
compared with the same period last year.                                                     containers.

The Port of Long Beach accounted for the generally                                           We are certainly aware that drought-busting storms
dreary February numbers by alluding to the January 28                                        adversely affected rail and truck traffic along routes
start of the Lunar New Year holiday, nearly two weeks                                        linking Oakland with points east of the Sierra Nevada
earlier than in 2016. In a press release, the Port of Long                                   range. But we also think there’s an additional, if
Beach explained: “The Lunar New Year typically results in                                    profoundly mundane reason for lower container volumes
slower trade since businesses in China — the world’s No.                                     at the California ports this February: 2016 was a Leap
2 economy and the Port’s primary trading partner — close                                     Year, meaning that this February was one working-day or
for a week or more to observe the holiday. The impact on                                     4.8% shorter than last February.
the Port is seen two weeks afterwards, accounting for the
time it takes vessels to cross the Pacific.”

  Exhibit 3     January Year-to-Date Total TEUs (Loaded and Empty) Handled at Selected Ports

1,000,000

              17.4%

  800,000
                                                                                                                                                          2017 YTD
                                                                                                                                                          2016 YTD
                         8.6%                                                                                                                         Source: Individual Ports
  600,000
                                8.3%

  400,000
                                       16.2%
                                                 17.0%
                                                         -4.8%
                                                                     6.5%         18.5%
                                                                                               3.2%      25.6% 27.5%
  200,000
                                                                                                                               4.2%       3.2%           8.7%      17.2% 11.6%

         0
                 Los

                                                                                                                                                                              Prince
              Angeles

                         Long
                        Beach

                                NYNJ

                                       Georgia

                                                 NWSA

                                                         Vancouver

                                                                     Manzanillo

                                                                                  Virginia

                                                                                               Oakland

                                                                                                                                               Port
                                                                                                                                         Everglades

                                                                                                                                                         Jaxport

                                                                                                                                                                              Rupert
                                                                                                         Houston

                                                                                                                     South
                                                                                                                   Carolina

                                                                                                                                Lazaro
                                                                                                                              Cardenas

                                                                                                                                                                   Maryland

                                                                                                                                                            March 2017                 Page 3
West Coast Trade Report
Jock O’Connell’s Commentary:
Regulating Away Part of the Infrastructure Needed to Restore Our
Infrastructure
Mainstream media reports on maritime trade tend to
Photos courtesy of the Port of San Francisco
focus a lot on containers, almost to the exclusion of
other modes of oceanborne commerce. So, in states like
California and Washington (and maybe, one day soon,
Oregon) which host imposing container terminals, even
newly-elected legislators and municipal leaders probably
know what a TEU is. As for their familiarity with the
transport of commodities measured in tons, barrels or
bushels, not so much.
Credit: Jay Ach
But there’s much more to ocean shipping than goods
that travel in boxes. Petroleum, coal, ores, grains, motor
vehicles , windmill components, for example, are all
transported around the world, usually on vessels custom-
built to handle each type of cargo. And these segments
of maritime trade often pass without much public The Ports of Redwood City, Richmond, and San Francisco
notice, except of course when there’s an oil spill or when handle the bulk of the U.S. West Coast imports of HS
deliveries of critically needed supplies are hindered. 2517, the Harmonized System classification for the
pebbles, gravel and crushed stones that comprise
California’s end-of-drought deluges this winter have aggregate.
caused enormous damage, most famously to the Oroville
Dam spillway but also to innumerable streets, highways, In fact, the Port of San Francisco’s leading cargo is
bridges, and levees. Infrastructure that was already in imported construction aggregate shipped from Canada.
deplorable condition was stressed and occasionally failed (The port also handles other construction needs such as
as downpour followed downpour. As a result, demand for steel coils, rebar, and structural steel.) Tourists visiting the
the concrete to repair roads, rebuild bridges, and reinforce Embarcadero do not see this business, which is tucked
levees is likely to surge dramatically in coming months. away well south of AT&T Park. Last year, the Port of San
One of concrete’s essential ingredients, along with water Francisco handled not a single TEU but did move nearly
and cement, is aggregate, inert granular materials such 1.4 million metric tons of dry bulk cargo, all of it imported.
as sand, gravel, or crushed stone. Most of California’s The ability to move construction materials through the
demand for aggregate this spring and summer will be met port not only helps contain building costs, it reduces the
from local quarries, because it is both economically and truck traffic and adverse environmental impacts within a
environmentally undesirable to truck such a heavy but city whose skyline is being spectacularly transformed by
low-value commodity over long distances. new, towering buildings.
But we also import aggregate as well as cement and A few miles south, the Port of Redwood City plays a
other construction materials (including steel) by sea, similar role with respect to construction projects in Silicon
usually through niche ports that handle little, if any of the Valley and elsewhere on the Peninsula. As at the Port of
state’s container trade. The option of transporting these San Francisco, aggregate arrives in large ocean-going
materials by sea is especially beneficial in meeting the ships such as the 750-foot long CSL (Canadian Steamship
construction needs of densely-populated urban areas Lines) Tecumseh in the photo above.
whose roadways are already congested by traffic.
March 2017 Page 4West Coast Trade Report
Commentary Continued Container Dwell Time Continues to Improve
Much of the imported aggregate comes
from the Orca Quarry, located on the San Pedro Bay Weighted Average Inbound Laden
northeast coast of Canada’s Vancouver Container Dwell Time in Days
Island. The quarry is operated by Polaris
DAYS TEUs
Materials Corporation. In California,
1,600,000
Polaris imports aggregate via the Ports 3.5
of Richmond and Long Beach. The
3.0 1,500,000
Richmond Terminal primarily serves
the northeastern San Francisco Bay 2.5
1,400,000
area. In July 2014, Polaris commenced
construction of an aggregate receiving 2.0
terminal in the Port of Long Beach to 1,300,000
service the Los Angeles area. That facility 1.5
began operations just over a year ago. 1,200,000
1.0
Spurred largely by President Trump’s 1,100,000
0.5
campaign promises, there’s much talk
today about restoring the nation’s frayed 0.0 1,000,000
infrastructure. The need is clearly there. In May Jun Jul Aug Sep Oct Nov Dec Jan Feb Mar Apr
2016 2016 2016 2016 2016 2016 2016 2016 2017 2017 2017 2017
its 2017 report card, the American Society Rolling 12 months
of Civil Engineers gave the country’s Weighted Average Dwell Time in Days
infrastructure an overall grade of D+, San Pedro Bay Container Throughput in TEUs (Ports)
largely unchanged since its previous
report in 2013.
Left out of public discussions and political Dwell Time in Days
debates is whether states like California % > 5 Days
may be regulating away an important
component of the infrastructure needed
to rebuild its infrastructure.
10%
To one extent or another, all ports face 8.4% 8.6%
existential challenges from government 8%
7.4%
regulators and neighboring communities. 6.7%
As discussed elsewhere in this newsletter,
6.1% 6.0%
the cost of meeting stricter air quality 6%
5.5%
requirements threatens to undermine
the fundamental economics of port 4.3% 4.3%
operations in California. Alas, a more 4%
holistic strategy for balancing the state’s 3.1%
sundry public policy goals is probably too
2%
much to expect.
0
May Jun Jul Aug Sep Oct Nov Dec Jan Feb Mar Apr
2016 2016 2016 2016 2016 2016 2016 2016 2017 2017 2017 2017
March 2017 Page 5West Coast Trade Report
What is the True Cost of the Clean Air Action Plan?
By John McLaurin
President, PMSA
The Ports of Los Angeles and Long Beach are moving
forward with the next iteration of their Clean Air Action
Plan (CAAP). The previous versions of the CAAP, coupled
Photo courtesy of the Port of Long Beach
with industry efforts and state regulatory measures, were
highly successful and resulted in dramatic reductions in
pollutants accomplished in a time frame not matched
by any other industry sector. From 2005 to 2015 the
San Pedro Bay Ports reduced overall diesel particulate
matter emissions by 85%, NOx emissions by 51% and SOx
emissions by 97%.
But the current draft CAAP proposal focuses on reducing
greenhouse gas emissions by 100% by requiring marine
terminals to convert cargo handling equipment to zero
emission technology by 2030 and to require zero emission for the supply chain. All the while, some environmental
drayage trucks by 2035. This schedule is decades ahead groups are pushing back on the use of near-zero options
of State of California goals. Currently, California is seeking like natural gas, and appear to be appeased only by
to reduce greenhouse gas emissions by 40% below 1990 electrification of marine terminals and the overall supply
levels by 2030. The ports have yet to provide any rationale chain.
as to why marine terminal operators must comply with
a more aggressive schedule than that required for every Southern California port authorities not only want marine
other industry in California with respect to greenhouse terminals to reduce greenhouse gas emissions decades
gas emissions. Nor have the ports provided cost ahead of California’s deadlines, they want to dictate
estimates for compliance, amount of emissions reduce (or electrification as the preferred technology. And they want
cost on a per ton of pollutants reduced), nor analysis of to move down this road even though neither the marine
the impact on the ports’ competitiveness. terminal operators nor the port authorities themselves
possess the wherewithal to finance compliance costs
Complicating the CAAP debate are proposals by public likely to be measured in the tens of billions of dollars.
utilities to assist in electrifying the supply chain, along
with an alternative and competing effort advocated by the The Ports of Los Angeles and Long Beach hope to finalize
natural gas industry, which is advocating natural gas as a their Clean Air Action Plan by June of this year.
near-zero emission alternative or even short-term solution
March 2017 Page 6West Coast Trade Report
Billion Dollar Container Fee Proposed
The South Coast Air Quality Management District ment.” The bill proposal was silent as to whether it applied
(SCAQMD) has proposed not one, but two different to the Port of Oakland.
container fees to be assessed on containerized imports
and exports moving through California’s ports. The fee Interestingly, while their Sacramento efforts were under-
proposals range from a low of $35 per TEU (which would way to introduce a bill implementing the $35 per TEU
reportedly raise $385 million per year) to upwards of $100 fee, the SCAQMD Legislative Committee held a “Special
per TEU (which would raise $1.1 billion per year). Which Meeting” where the Legislative Committee adopted a
proposal the SCAQMD decides to finally pursue is uncer- staff recommendation to consider a $100 per TEU con-
tain at this point. tainer fee. The fee would be imposed at the Ports of Los
Angeles, Long Beach and Oakland. While the Legislative
The air district first pitched the $35 per TEU proposal with Committee does not include any information on what the
state legislators in late February. As part of that effort, the $1.1 billion would be spent on, it did discuss “…the low
SCAQMD noted that the $385 million that would be col- pass-through costs on shippers from the proposed fee…”
lected every year would be used to “…help fund near-zero and that the funds collected would go to the “…respective
and zero emission cargo handling and drayage equip- air districts containing the specified ports.”
The PMSA Annual Luncheon
To attend, register here
Featuring: https://pmsaannualluncheon2017.eventbrite.com/
John Wolfe
Chief Executive Officer Or send check & attendee information to:
The Northwest Seaport Alliance
PMSA
When: Tuesday, April 11, 2017 70 Washington Street
11:30AM reception Oakland, CA 94607
12:00PM luncheon
Please RSVP by Tuesday, April 4, 2017
Where: Hyatt Regency Long Beach
Regency Ballroom If you have any questions, or would like to be a sponsor, please contact
200 S. Pine Ave. Laura Williams at lwilliams@pmsaship.com or 510-987-5000
Long Beach, CA
$75 General Admission Proceeds from the luncheon will go towards the PMSA Foundation, a non-
$900 Gold Sponsorship profit 501(c)3 charitable organization providing much-needed funds for
$1,700 Platinum Sponsorship a diverse range of community needs in port areas including services for
seafarers, the disabled, homeless and students.
PMSA Copyright © 2017
It is prohibited by law to forward this publication to any other person or persons. This material may not be re-published, broadcast,
rewritten or distributed without written permission from PMSA.
Follow PMSA on Twitter @PMSAShip and Facebook.
March 2017 Page 7You can also read