THE ANGRIEST SUMMER - CLIMATECOUNCIL.ORG.AU - Climate Council
←
→
Page content transcription
If your browser does not render page correctly, please read the page content below
THE
ANGRIEST
SUMMER

CLIMATECOUNCIL.ORG.AU
Thank you for
supporting the
Climate Council.
The Climate Council is an independent, crowd-funded organisation
providing quality information on climate change to the Australian public.
Published by the Climate Council of Australia Limited
ISBN: 978-1-925573-90-9 (print)
978-1-925573-91-6 (digital)
Professor Will Steffen
© Climate Council of Australia Ltd 2019
Climate Councillor
This work is copyright the Climate Council of Australia Ltd. All material
contained in this work is copyright the Climate Council of Australia Ltd
except where a third party source is indicated.
Climate Council of Australia Ltd copyright material is licensed under the
Creative Commons Attribution 3.0 Australia License. To view a copy of this
license visit http://creativecommons.org.au.
You are free to copy, communicate and adapt the Climate Council of Dr Annika Dean
Australia Ltd copyright material so long as you attribute the Climate
Senior Researcher
Council of Australia Ltd and the authors in the following manner:
The Angiest Summer.
Authors: Will Steffen, Annika Dean, Martin Rice and Greg Mullins.
—
Dr Martin Rice
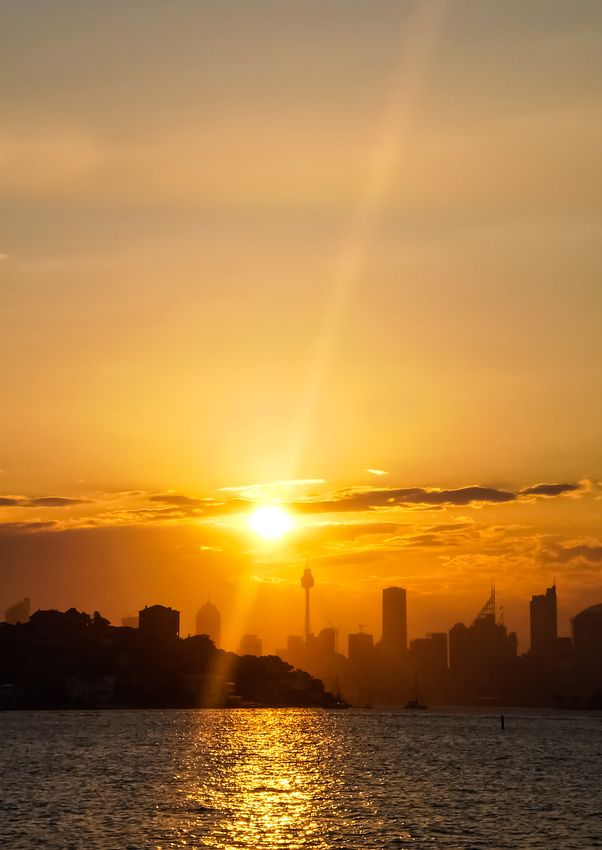
Cover image: ‘Sunset at Sydney city with golden sky’ by Visun Khankasem,
Shutterstock. Head of Research
This report is printed on 100% recycled paper.
facebook.com/climatecouncil info@climatecouncil.org.au
Greg Mullins
twitter.com/climatecouncil climatecouncil.org.au
AO, AFSM
Climate Councillor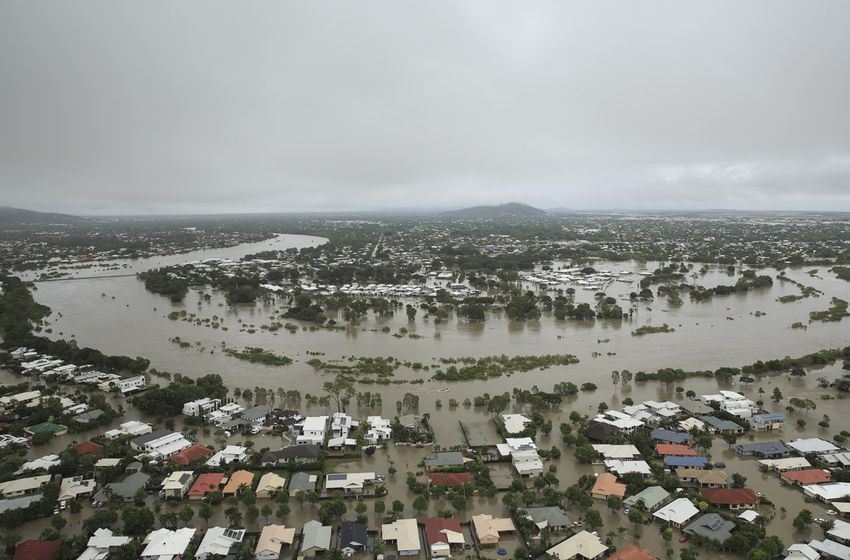
CLIMATE COUNCIL                      i

Contents
Key Findings..................................................................................................................................................................................... ii

Introduction.......................................................................................................................................................................................1

Summer 2018/19 in Detail............................................................................................................................................................. 5

The Window of Opportunity to Act is Rapidly Closing.......................................................................................................11

References....................................................................................................................................................................................... 12

Image Credits................................................................................................................................................................................. 13
ii    THE ANGRIEST SUMMER

     Key Findings
     1            2
     The Angry Summer of 2018/19 was                         Serious bushfires raged across the continent
     characterised by prolonged, continental-wide            through the summer.
     heatwaves and record hot days, bushfires
     throughout Australia, and heavy rainfall and            ›› Every state experienced serious bushfires with
     flooding in northern Queensland.                           properties lost in Queensland, New South Wales,
                                                                Victoria and Tasmania.
     Noteworthy records from this summer include:
                                                             ›› New South Wales experienced serious fires
     ›› In just 90 days, more than 206 records were             through autumn and winter, the Queensland fire
        broken around Australia.                                season lasted much longer than normal and the
                                                                Tasmanian fire season started early.
     ›› Hottest summer on record for the Australian
        continent.                                           ›› Pristine rainforest in Queensland and Tasmania,
                                                                previously not prone to bushfires, suffered
     ›› January was the hottest on record for New South         devastating damage.
        Wales, Victoria, Queensland, Northern Territory,
        the Australian Capital Territory and Tasmania.

     ›› Port Augusta in South Australia reached a record-
        breaking temperature of 49.5°C on January 24
        (the highest temperature in the summer).

     ›› Townsville experienced 10-day accumulated
        rainfall totals of 1,257 mm, breaking the previous
        10-day record by more than 330 mm.
KEY FINDINGS iii
3
The Angry Summer was driven by greenhouse
4
The window to effectively tackle climate
gas pollution from the burning of fossil fuels, change is rapidly closing but many of the
like coal, oil and gas, and land clearing. solutions we need are already at hand.
›› The record-breaking heat in Australia over the ›› Tackling climate change effectively requires
2018/19 Summer is part of a long-term warming credible national policy to drive down greenhouse
trend from the burning of fossil fuels and land gas pollution from fossil fuels across all sectors:
clearing. electricity, transport and industry, as well as
credible policies to address emissions from
›› For many years scientists have warned that agriculture and land use.
climate change is driving worsening extreme
weather. The Angry Summer is another example ›› Solutions include accelerating the uptake of
of the consequences of climate change today. renewable energy and storage, investing in
energy efficiency, and switching away from direct
›› Protecting Australians from worsening extreme fuel combustion to electrification powered by
weather requires phasing out fossil fuels and renewables in transport, industry and buildings.
accelerating the transition to renewables and
storage technologies. ›› The Federal Government has no credible climate
policy in place with greenhouse gas pollution
increasing over the past four years.
climatecouncil.org.au1 THE ANGRIEST SUMMER
Introduction
The Australian summer of 2018/19 The summer was characterised by prolonged,
marked the return of the Angry continental-scale heatwaves, hot days,
Summer with record-breaking heat drought conditions in eastern Australia and
and other destructive extreme bushfires throughout Australia, particularly
weather events. in Queensland and Tasmania and parts of
Western Australia, Victoria and New South
Wales. Bushfire seasons started much earlier,
lasted longer, and burned in areas that would
not be expected to burn, despite there not
being an El Niño event. Heavy rainfall and
flooding inundated northern Queensland in
late January and early February.
We describe this summer as angry due to it
being the hottest on record by a large margin
(2.14°C above the 1961-1990 baseline) with
more than 206 extreme weather records
broken (Figure 2). This summer follows
previous Angry Summers in 2012/13, 2013/14
and 2016/17 with Australians yet again
enduring worsening extreme weather events
driven by climate change. The climate is
changing quickly, leading to temperature
records being broken in close succession.
Over recent decades there has been a
strong upswing in summer temperatures in
Australia, with above average temperatures
recorded for most summers since the late
1970s (compared to a 1961-1990 baseline).
Bushfire seasons
started much earlier
and lasted longer.CHAPTER 01 2
INTRODUCTION
The past four years have been the four then. A rapidly warming world is the result
hottest years on record for global surface of increasing greenhouse gas pollution from
temperature - 2018 was the fourth hottest, the burning of fossil fuels and other human
following 2017 (the third hottest), 2015 (the activities such as land clearing. Globally, the
second hottest) and 2016 (the hottest) (NOAA 20 hottest years on record have been in the
2019). 2018 was the warmest on record in the past 22 years and in Australia, nine of the
oceans, surpassing the previous record set in 10 hottest years on record have occurred
2017 (Chen et al. 2019). The hot global average since 2005. 2018 is the 42nd consecutive year
temperatures in 2018, 2017, 2016 and 2015 are (since 1977) with an above-average global
part of a long-term upswing in global average temperature. No one aged under 40 has lived
temperature that began most clearly in the in a year with global average temperatures at
mid-20th century and has continued since or below the global 20th century average.
AUSTRALIAN SUMMER MEAN TEMPERATURE
2.5
2
1.5
Temperature anomaly (°C)
1
0.5
0
-0.5
-1
-1.5
-2
1910 1920 1930 1940 1950 1960 1970 1980 1990 2000 2010
Year
Figure 1: Summer temperatures have been rising steeply in Australia over recent decades. Source: BoM (2019a).3 THE ANGRIEST SUMMER
In Australia the average air temperature Climate change is influencing all extreme
for 2018 was 1.14°C above the 1961-1990 weather events as they are occurring
average, making 2018 the third hottest year in a more energetic climate system
on record. The mean maximum temperature (Trenberth 2012). Australia is one of the
was the second hottest on record (1.55°C most vulnerable developed countries in the
above average). It is important to note that world to the impacts of climate change. In
the Australian average surface temperature 2018, Australia experienced extreme heat
refers to land only, while the global surface across many parts of the country, severe
temperature refers to a combination of bushfires affected parts of South Australia,
land surface and sea surface temperatures New South Wales, Queensland, Victoria
(CSIRO and BoM 2018). and Western Australia, intense rainfall
triggered flooding in northern Queensland,
Hobart and southwest Western Australia,
and drought conditions persisted across
southern Australia.
Over the 2018/2019 Angry Summer climate
change cranked up the intensity of extreme
weather with numerous weather-related
records broken across Australia (Figure 2).
Climate change is
cranking up the intensity
of extreme weather.CHAPTER 01 4
INTRODUCTION
IN JUST 90 DAYS, OVER 206 RECORDS
ANGRY
BROKEN, INCLUDING:
2018/19
SUMMER
› Record-highest summer temperature: 87 locations
› Record-lowest summer total rainfall: 96 locations
› Record highest summer total rainfall: 15 locations
› Record number of days 35°C or above: 2 locations
› National or state/territory hottest on record:
5 states/territories and (1) Australia.
NORTHERN TERRITORY
QUEENSLAND
› Hottest summer on record (2.67°C above average).
› Cloncurry: 43 consecutive days of
› Rabbit Flat: 34 consecutive days of 40°C or above. 40°C or above (State record).
› Townsville received more than annual
average rainfall in 10 days (1,257 mm).
WESTERN AUSTRALIA
› Hottest summer on
record (1.73°C above NEW SOUTH WALES
average).
› Marble Bar: 45°C or › Hottest summer on record
higher on 32 days (3.41°C above average).
during the summer.
› Bourke: 21 consecutive days
above 40°C (State record).
CANBERRA
› Hottest summer on record.
› 35°C or above on 24 days,
five times the summer
SOUTH AUSTRALIA average.
› Port Augusta: Hottest temperature this
summer - 49.5°C on January 24.
› Adelaide: Hottest temperature for January
or any month – 46.6°C on January 24.
VICTORIA TASMANIA
› Hottest summer on record › Driest January on record.
(2.54°C above average).
› Bushfires burned ~ 200,000
hectares of vegetation.
Note: For all statistics, the average is calculated over the period between 1961 and 1990.
Records are for seasonal or monthly mean temperature unless otherwise specified.
Figure 2: Climate change is increasing the frequency and/or severity of extreme weather in Australia. During the 2018/19
Angry Summer over 206 extreme weather records were broken.5 THE ANGRIEST SUMMER
Summer 2018/19 in Detail
Climate change is now making HEATWAVES
many types of extreme weather
worse, especially heatwaves. During the 2018/2019 Summer exceptional
heatwaves occurred, which were notable
for their continental-wide scale as well
as for breaking records for duration and
individual daily extremes.
A heatwave in Australia is described as
a period of at least three days where the
combined effects of high temperatures
and excess heat are unusual within the
local climate (Nairn and Fawcett 2013).
The widespread heatwave conditions
occurred throughout most of December
and January, but peaked in late December
and in mid-January. The latter heatwave
was the most significant heatwave on
record at the national scale. The extent and
duration of the heatwaves led to a number
of extremely hot days for nationally
averaged daily temperatures, including six
Climate change is of the ten hottest days for mean maximum
temperature, eight of the ten hottest
making heatwaves days for mean minimum temperature
(including the six hottest) and eight of the
worse and the 2018/19 ten hottest days for mean temperature
(including the hottest three).
Summer heatwaves In South Australia, the heatwaves affected
stone fruit growers, with stone fruit
were unprecedented. cooking on the trees (ABC 2019). In New
South Wales, roads started to melt and
commuters experienced delays as train
tracks threatened to buckle (SMH 2019).
Extreme heat also caused mass deaths of
flying foxes, with one third of the locally
endemic spectacled flying fox population
perishing in Cairns during the November
heatwaves on the tropical Queensland
coast, and thousands of flying foxes
perishing in Adelaide during the January
heatwaves (Independent 2019).CHAPTER 02 6
SUMMER 2018/19 IN DETAIL
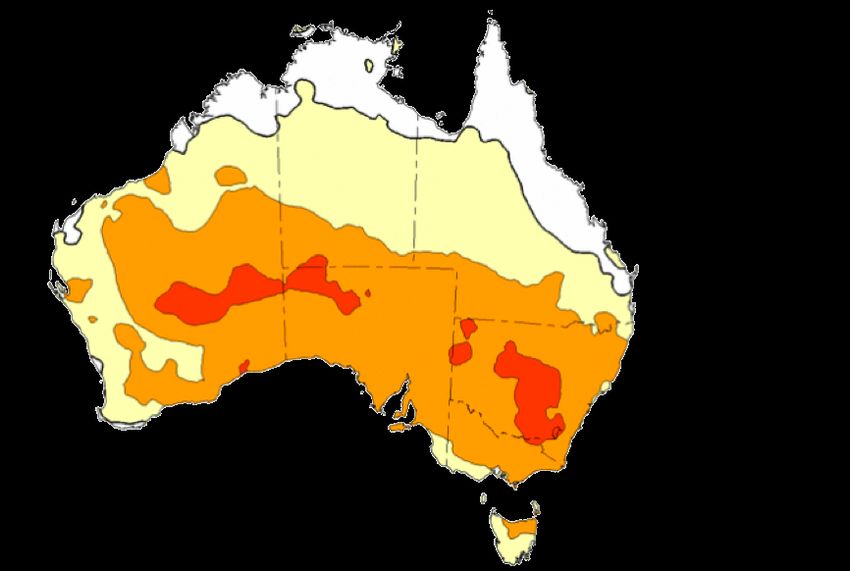
HIGHEST THREE-DAY HEATWAVE CATEGORY 11 - 26 JANUARY 2019
Heatwave Status
Extreme heatwave
Severe heatwave
Low-intensity heatwave
No heatwave
Figure 3: Highest three-day heatwave category reached in different areas between January 11 - 26. Large areas of Western
Australia, South Australia, New South Wales and Victoria were affected by either severe or locally extreme heatwaves during
this period (BoM 2019b).
Climate change is making hot days and continued since 2008. Australian capital
heatwaves more frequent and more severe cities, where the majority of Australians
(Perkins and Alexander 2013; Climate live, have experienced increasing severity
Council 2014). Australia’s climate has and intensity of extreme weather. The
warmed by about 1.1°C from 1910, with risk of experiencing severe heatwaves in
most warming occurring since 1950 summer, in terms of their frequency and
(CSIRO and BoM 2019). As a result, the intensity, has increased two- and three-
number of record hot days has doubled fold, respectively, due to climate change
since 1960 (CSIRO and BoM 2012). Over (Perkins et al. 2014).
the period 1971–2008, both the duration
and frequency of heatwaves has increased,
and the hottest days during heatwaves
have become even hotter (Perkins and
Alexander 2013). These trends have7 THE ANGRIEST SUMMER
RECORD-BREAKING HEAT BUSHFIRES
It was the warmest January on record for Bushfires affected nearly all of Australia. Fire
Australia in terms of mean, maximum, and seasons started early in New South Wales,
minimum temperatures. The national mean Tasmania and Victoria, with many fires
temperature was 2.91°C above average. The started by “dry” lightning storms. New South
mean maximum temperature was 3.37°C Wales experienced major fires on the South
above average and the mean minimum Coast and in the Hunter in August (during
temperature was 2.45°C above average. winter), then major fires on the Northern
January was also the hottest month on Slopes in February. In New South Wales fire
record for every state and territory except fighters were battling blazes all year round.
South Australia and Western Australia. Western Australia experienced major fires in
New South Wales broke its previous hottest May, then again in early 2019. Queensland
month record by more than 2°C (BoM experienced fires from August to November
2019c). For nationally averaged mean with Catastrophic fire weather in sub-tropical
maximum temperature, Australia had its areas causing fires to burn intensely in
hottest December day on record. Numerous rainforests normally not prone to fire. During
locations, including Adelaide, reported January and February uncontrolled fires
their highest daily maximum temperature burned throughout Tasmania in vast areas
on record. A new record was set in New of the Tasmanian Wilderness World Heritage
South Wales for the highest minimum Area where vegetation is not adapted to fire,
temperature ever observed in Australia, and because for thousands of years it has been
state/territory records were also set for South too damp to burn.
Australia, Queensland and the Northern
Territory. See the Bureau of Meteorology’s Tasmania had its hottest and driest January
summer report (BoM 2019e) for site specific on record, making vegetation particularly
records broken, including state and territory flammable and susceptible to ignition by
summaries, and Figure 2 for examples of lightning from dry thunderstorms (BoM
extreme weather records broken over the 2019c). Given that the lightning-caused
2018/19 Angry Summer. fires were started in remote areas, they were
difficult to control, burning about 194,427
hectares of vegetation and leading to very
poor air quality across the state (Wood 2019).
A preliminary analysis suggests that around
3.2 percent of the area burned in Tasmania
in 2019 was rainforest, which is particularly
vulnerable to fire, and about 30 percent
was wet eucalypt forest where fires are rare
(Wood 2019).
All Australian states experienced
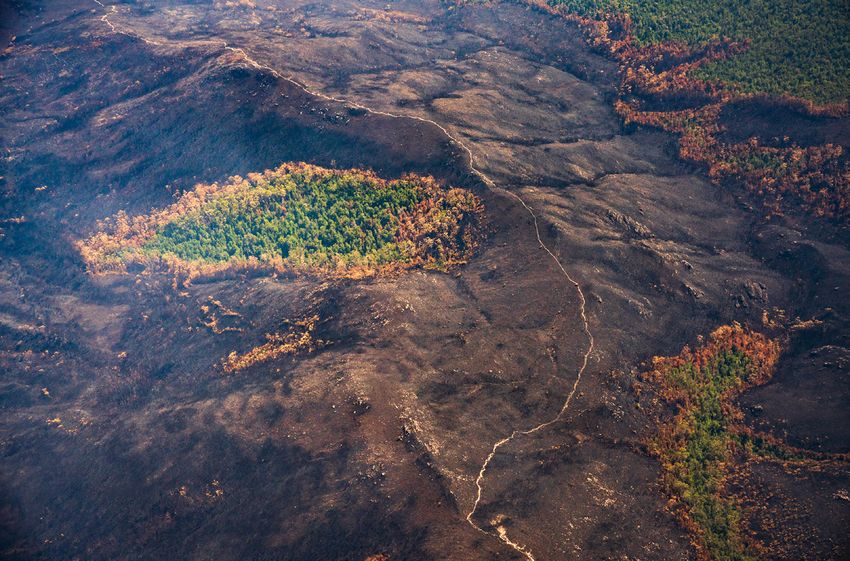
severe bushfires during summer.Figure 4: Fire damage around Eliza Plateau walking track from the Celtic Hill Fire, Southwest Tasmania.
Over recent decades, there has been an
increase in very high to extreme fire
Over recent
weather over large parts of Australia and
a lengthening of the bushfire season,
decades, large areas
especially in south eastern Australia (CSIRO
and BoM 2018). There has been an increase of Australia have
in incidences of lightning-ignited fires in
the Tasmanian Wilderness World Heritage experienced an
increase in extreme
Area over recent decades, possibly linked
to changes in rainfall patterns that have
led to decreased soil and fuel moisture
and increased ignition efficiency (Styger, fire weather and a
Marsden-Smedley and Kirkpatrick 2018).
In the past, the coincident occurrence
of an El Niño and a positive phase of the
lengthening of the
Indian Ocean Dipole was a key influence
behind serious bushfire seasons; however,
fire season.
these influences were absent during the
2018/2019 Summer, suggesting climate
change was a major influence.9 THE ANGRIEST SUMMER
INTENSE RAINFALL AND FLOODING The heavy rainfall overwhelmed the
capacity of the Ross River Dam, prompting
An active monsoon trough and a slow- authorities to open the floodgates of the
moving low-pressure system over the dam to full capacity on February 4, releasing
northern tropics produced extremely heavy about 1,900 cubic metres of water per
rainfall in tropical Queensland from late second into the Ross River, and ultimately,
January 2019 into early February. The rainfall into low-lying Townsville suburbs. Three
during this event was exceptional. In and people died and thousands of properties
around Townsville, the accumulated totals were affected. Final damage assessments
from consecutive days of heavy rainfall conducted by Queensland Fire and
were the city’s highest on record since Emergency Services have revealed that
records began in 1888. In the seven days to 4 2,063 properties experienced floodwater
February 2019, the Bureau’s site at Townsville inundation of up to 25 cm, 1,101 properties
Aero recorded 1052.8 mm, and 1257.0 mm experienced inundation of up to 1 metre and
in the ten days to 6 February (BoM 2019d). 135 properties suffered inundation of over 1
Prior to this event, the Townsville record metre (Townsville Bulletin 2019). The insured
for a 7-day period was 886.2 mm (January losses from this event amounted to $887
1998) and for a 10-day period was 925.5 mm million as at February 21 (ICA 2019).
(January 1953). Townsville has already in
2019 recorded more than its average annual
rainfall of 1128.0 mm (based on all years of
data for the site from 1941–2018) (BoM 2019d).
Climate change is increasing the
probability of heavy rainfall events
in most areas across Australia,
which in turn increases the risk
of severe flooding events.Figure 5: Flooding in Townsville, 4 February 2019. Climate change increases the probability between temperature and the water-holding of heavy rainfall events in most locations capacity of the atmosphere suggests that across Australia. As the climate changes, it total rainfall on heavy rain days will increase is becoming more challenging to predict by about 7 percent per degree of warming. flooding events. Annual exceedance Although heavy rainfall is highly variable in probabilities (which are based on historical Australia, observations over recent decades data and refer to the probability of a flood suggest that for short-duration, hourly event occurring in any year) may no longer rainfall, the increase has been more than 7 be reliable for predicting the probability of percent (Guerreiro et al. 2018). future events. The physical relationship
11   THE ANGRIEST SUMMER

     The Window of
     Opportunity to Act
     is Rapidly Closing
                 The extreme weather events of the         Australia is on the frontline of climate
                 Angry Summer 2018/19 provide the          change with worsening impacts and
                 latest evidence of a long-term trend      growing risks to the vibrancy and resilience
                 of worsening extreme weather. In          of our way of life, our health, the economy
                 Australia, the frequency and / or         and environment. With greenhouse
                 intensity of many extreme weather         gas pollution rising the past four years
                 events – heatwaves, bushfire              (Australian Government 2019), it is clear the
                 conditions, intense rainfall and floods   Federal Government has no credible policy
                 – have increased over the past several    in place to reduce greenhouse gas pollution.
                 decades, consistent with trends that
                 have been observed globally.              Any new fossil fuel projects, such as new
                                                           coal, are fundamentally at odds with
                                                           effectively tackling climate change. Tackling
                                                           climate change effectively requires a credible
                                                           national policy to drive down greenhouse
                                                           gas pollution across all sectors: electricity,
                                                           transport, industry, agriculture and land
                                                           use. The solutions are at our disposal but the
                                                           window of opportunity is rapidly closing.
REFERENCES 12
References
ABC (Australian Broadcasting Corporation) (2019) Extreme ICA (Insurance Council of Australia) (2019) ICA Catastrophe
temperatures burn stone fruit from inside out, causing Dataset. Accessed at: https://docs.google.com/spreadsheets/
severe loss. Accessed at: https://www.abc.net.au/news/ d/1vOVUklm2RR_XU1hR6dbGMT7QFj4I0BGI_JAq4-
rural/2019-01-16/heatwave-burns-stonefruit-from-inside- c9mcs/edit#gid=2147027033
out/10717496
Independent (2019) Bats dying ‘on biblical scale’ due to
Australian Government (2019) Quarterly Updates of record-breaking Australia heatwave. Accessed at: https://
Australia’s National Greenhouse Gas Inventory. Accessed www.independent.co.uk/news/world/australasia/australia-
at: https://www.environment.gov.au/climate-change/ bats-death-heatwave-cairns-flying-foxes-new-south-
climate-science-data/greenhouse-gas-measurement/ wales-adelaide-a8730626.html
publications#national.
Nairn J and Fawcett R (2013) Defining Heatwaves:
BoM (Bureau of Meteorology) (2019a) Australian climate Heatwave defined as a heat-impact event servicing all
variability & change - Time series graphs. Accessed at: community and business sectors in Australia. CAWCR
http://www.bom.gov.au/climate/change/#tabs=Tracker&tra Technical Report, No. 060. CSIRO and Australian Bureau of
cker=timeseries&tQ=graph%3Dtmean%26area%3Daus%26s Meteorology, p 96.
eason%3D1202%26ave_yr%3D0
NOAA (National Oceanic and Atmospheric Administration)
BoM (2019b) Special Climate Statement 68—widespread (2019) National Centers for Environmental Information,
heatwaves during December 2018 and January 2019. State of the Climate: Global Climate Report for Annual 2018,
Accessed at: http://www.bom.gov.au/climate/current/ published online January 2019. Accessed at: https://www.
statements/scs68.pdf. ncdc.noaa.gov/sotc/global/201813.
BoM (2019c) Australia in January 2019. Accessed at: http:// Perkins S and Alexander L (2013) On the measurement of
www.bom.gov.au/climate/current/month/aus/summary. heat waves. Journal of Climate, 26: 4500–4517.
shtml.
Styger J, Marsden-Smedley J, Kirkpatrick J (2018) Changes
BoM (2019d) Special Climate Statement 69—an extended in Lightning Fire Incidence in the Tasmanian Wilderness
period of heavy rainfall and flooding in tropical World Heritage Area, 1980–2016, Fire, 1 (38). doi:10.3390/
Queensland. Accessed at: http://www.bom.gov.au/climate/ fire1030038
current/statements/scs69.pdf
SMH (Sydney Morning Herald) (2019) Roads melt as
BoM (2019e) Climate Summaries. Accessed at: http://www. temperatures break records across NSW. Accessed at:
bom.gov.au/climate/current/. https://www.smh.com.au/national/nsw/roads-melt-as-
temperatures-break-records-across-nsw-20190117-p50s0e.
Cheng L, Zhu, J, Abraham J, Trenberth K, Fasullo JT, Zhang
html
B, Yu F, Wan L, Chen X, Song X (2019) 2018 Continues
Record Global Ocean Warming, Advances in Atmospheric Townsville Bulletin (2019) Revealed: The final count of how
Sciences, 36(3): 249 – 252. many properties were damaged in the Townsville floods.
Accessed at: https://www.townsvillebulletin.com.au/
Climate Council (2014) Heatwaves: Hotter, Longer, More
news/townsville/revealed-the-final-count-of-how-many-
Often. Accessed at: https://www.climatecouncil.org.au/
properties-were-damaged-in-the-townsville-floods/news-
heatwaves-report.
story/f8c9e434b33c4d36c16154a98230b379
CSIRO and BoM (2012) State of the Climate 2012. Accessed
Trenberth KE (2012) Framing the way to relate climate
at: https://www.google.com/url?sa=t&rct=j&q=&esrc=s&sou
extremes to climate change, Climatic Change, 115: 283–
rce=web&cd=1&ved=2ahUKEwjT8cH5mOjgAhXKZCsKHTY
290.
jCeAQFjAAegQIChAC&url=https%3A%2F%2Fwww.csiro.au
%2F~%2Fmedia%2FAbout%2FLM%2FFOI-Disclosure-Log- Wood S (2019) The 2019 Tasmanian Fires so Far: What has
2012-13%2FClimate-Snapshot-2012-Brochure.pdf%3Fla%3D Burned and Where? Fire Centre Research Hub, University of
en%26hash%3D14499D1608ED738AB5DCFD9F182589FE26 Tasmania. Accessed at: https://firecentre.org.au/the-2019-
F48337&usg=AOvVaw0xujNPIMLz_vptVLep6OHh tasmanian-fires-so-far-what-has-burned-and-where/
CSIRO and BoM (2018) State of the Climate 2018. CSIRO
and Bureau of Meteorology, Melbourne. Accessed at: http://
www.bom.gov.au/state-of-the-climate/State-of-the-
Climate-2018.pdf.
Guerreiro SB, Fowler HJ, Barbero R, Westra S, Lenderink
G, Blenkinsop S, Lewis E, Li X-F (2018) Detection of
continental-scale intensification of hourly rainfall
extremes. Nature Climate Change, doi:10.1038/s41558-018-
0245-3.13 THE ANGRIEST SUMMER
Image Credits
Cover image: ‘Sunset at Sydney city with golden sky’ by
Visun Khankasem. Shutterstock.
Page 8: Figure 4 ‘Fire damage around Eliza Plateau walking
track from the Celtic Hill Fire, Southwest’ by Luke Tscharke/
Climate Council.
Page 10: Figure 5 ‘Townsville Floods’ by Andrew Rankin.
Australian Associated Press.Thank you for
supporting the
Climate Council.
The Climate Council is an independent, crowd-funded organisation
providing quality information on climate change to the Australian public.
CLIMATE COUNCIL
facebook.com/climatecouncil
twitter.com/climatecouncil
info@climatecouncil.org.au
climatecouncil.org.au
The Climate Council is a not-for-profit organisation
and does not receive any money from the Federal
Government. We rely upon donations from the
public. We really appreciate your contributions.
DONATE climatecouncil.org.au/donateYou can also read