PLAZA UT PHYSICIANS OFFERING MEMORANDUM - LoopNet
←
→
Page content transcription
If your browser does not render page correctly, please read the page content below
OFFERING MEMORANDUM
UT PHYSICIANS
PLAZA
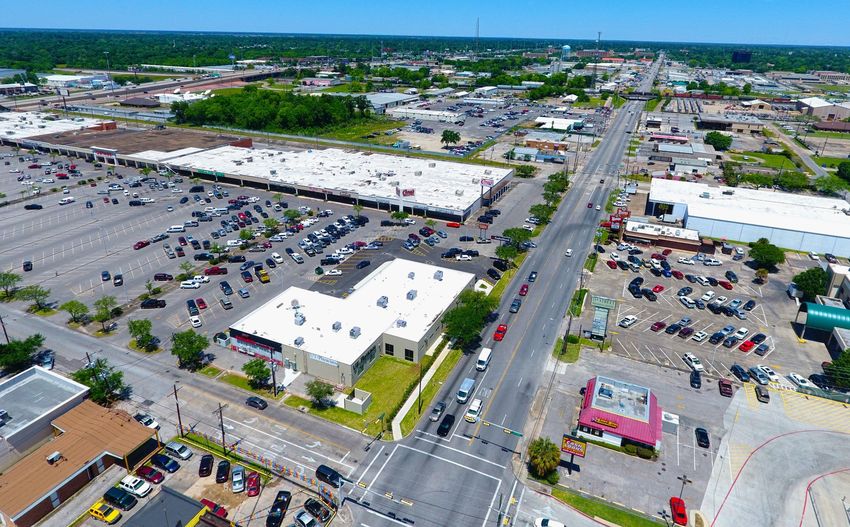
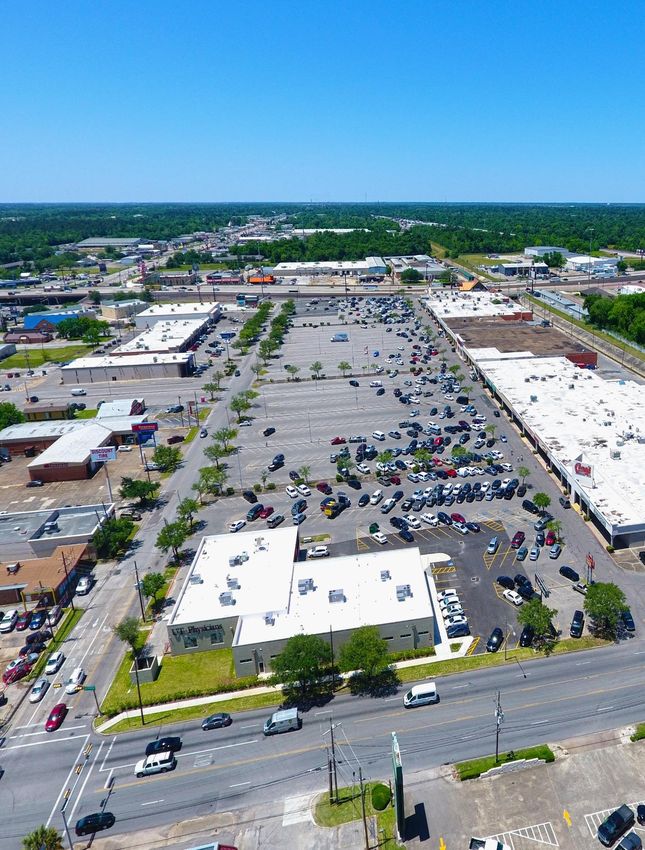
3610 Stagg Dr, Beaumont, TX 77701
Click the Icon or Visit
https://vimeo.com/269695326/99f115dda9
to View Exclusive Video Presentation
Broker of Record: Timothy Speck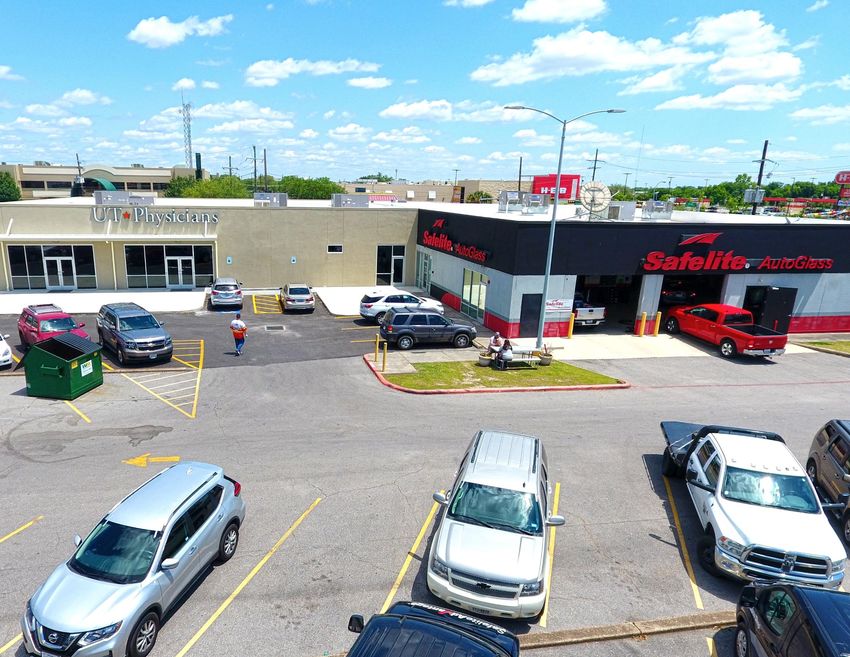
CONFIDENTIALITY & DISCLAMER

THIS IS A BROKER PRICE OPINION OR COMPARATIVE MARKET ANALYSIS OF VALUE AND SHOULD NOT BE CONSIDERED AN APPRAISAL. This information has been secured
from sources we believe to be reliable, but we make no representations or warranties, express or implied, as to the accuracy of the information. References to square footage or age are
approximate. Buyer must verify the information and bears all risk for any inaccuracies. Marcus & Millichap is a service mark of Marcus & Millichap Real Estate Investment Services, Inc.
© 2018 Marcus & Millichap. All rights reserved.

                                                         NON-ENDORSEMENT NOTICE

Marcus & Millichap is not affiliated with, sponsored by, or endorsed by any commercial tenant or lessee identified in this marketing package. The presence of any corporation's logo or
name is not intended to indicate or imply affiliation with, or sponsorship or endorsement by, said corporation of Marcus & Millichap, its affiliates or subsidiaries, or any agent, product,
service, or commercial listing of Marcus & Millichap, and is solely included for the purpose of providing tenant lessee information about this listing to prospective customers.

ALL PROPERTY SHOWINGS ARE BY APPOINTMENT ONLY.
PLEASE CONSULT YOUR MARCUS & MILLICHAP AGENT FOR MORE DETAILS.

                                                              N E T- L E A S E D D I S C L A I M E R

The information contained in this Marketing Brochure has been obtained from sources we believe to be reliable. However, Marcus & Millichap has not and will not verify any of this
information, nor has Marcus & Millichap conducted any investigation regarding these matters. Marcus & Millichap makes no guarantee, warranty or representation whatsoever about
the accuracy or completeness of any information provided.

As the Buyer of a net leased property, it is the Buyer’s responsibility to independently confirm the accuracy and completeness of all material information before completing any
purchase. This Marketing Brochure is not a substitute for your thorough due diligence investigation of this investment opportunity. Marcus & Millichap expressly denies any obligation
to conduct a due diligence examination of this Property for Buyer.

Any projections, opinions, assumptions or estimates used in this Marketing Brochure are for example only and do not represent the current or future performance of this property. The
value of a net leased property to you depends on factors that should be evaluated by you and your tax, financial and legal advisors.

Buyer and Buyer’s tax, financial, legal, and construction advisors should conduct a careful, independent investigation of any net leased property to determine to your satisfaction with
the suitability of the property for your needs.

Like all real estate investments, this investment carries significant risks. Buyer and Buyer’s legal and financial advisors must request and carefully review all legal and financial
documents related to the property and tenant. While the tenant’s past performance at this or other locations is an important consideration, it is not a guarantee of future success.
Similarly, the lease rate for some properties, including newly-constructed facilities or newly-acquired locations, may be set based on a tenant’s projected sales with little or no record of
actual performance, or comparable rents for the area. Returns are not guaranteed; the tenant and any guarantors may fail to pay the lease rent or property taxes, or may fail to comply
with other material terms of the lease; cash flow may be interrupted in part or in whole due to market, economic, environmental or other conditions. Regardless of tenant history and
lease guarantees, Buyer is responsible for conducting his/her own investigation of all matters affecting the intrinsic value of the property and the value of any long-term lease, including
the likelihood of locating a replacement tenant if the current tenant should default or abandon the property, and the lease terms that Buyer may be able to negotiate with a potential
replacement tenant considering the location of the property, and Buyer’s legal ability to make alternate use of the property.

By accepting this Marketing Brochure you agree to release Marcus & Millichap Real Estate Investment Services and hold it harmless from any kind of claim, cost, expense, or liability
arising out of your investigation and/or purchase of this net leased property.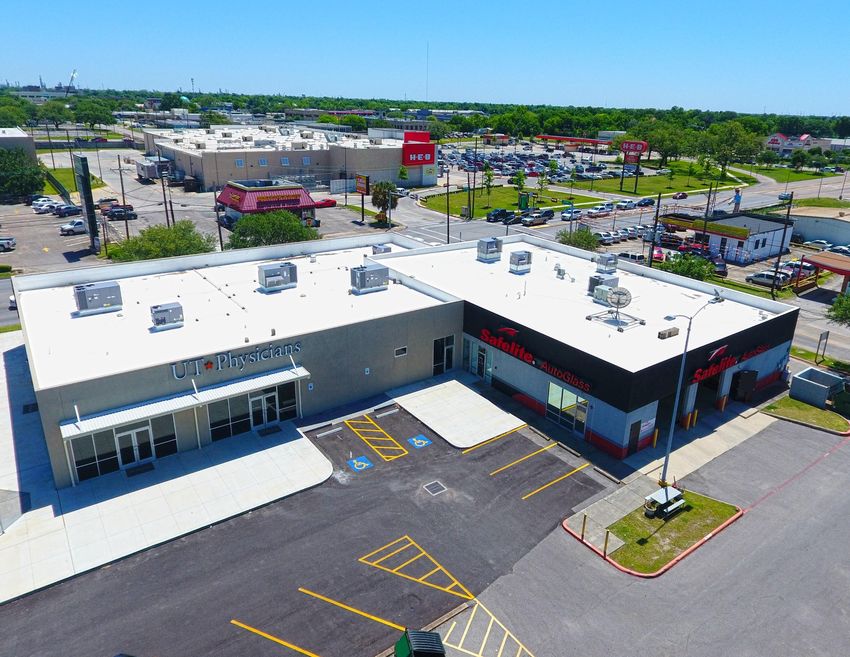
TABLE OF CONTENTS

           01
     INVESTMENT OVERVIEW

           02
  PRICING & FINANCIAL ANALYSIS

           03
DEMOGRAPHICS & MARKET OVERVIEW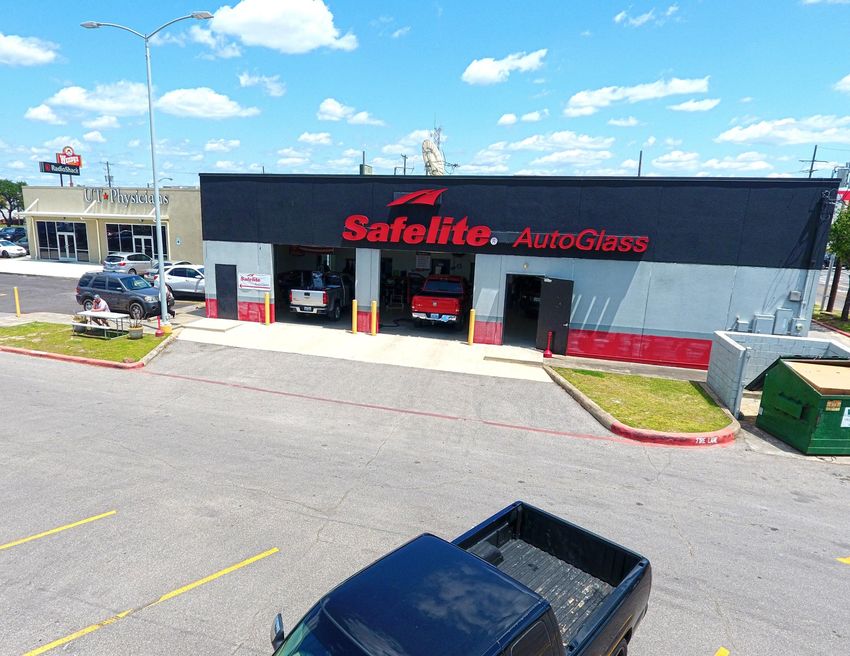
01
INVESTMENT
OVERVIEW
UT PHYSICIANS
PLAZA
INVESTMENT HIGHLIGHTS
100 Percent Occupied UT Physicians & Safelite AutoGlass
75 Percent Occupied By UT Physicians | State of Texas Credit
(NNN) Both Triple-Net Leases with Management Reimbursed
Renovated in 2017 | No Deferred Maintenance
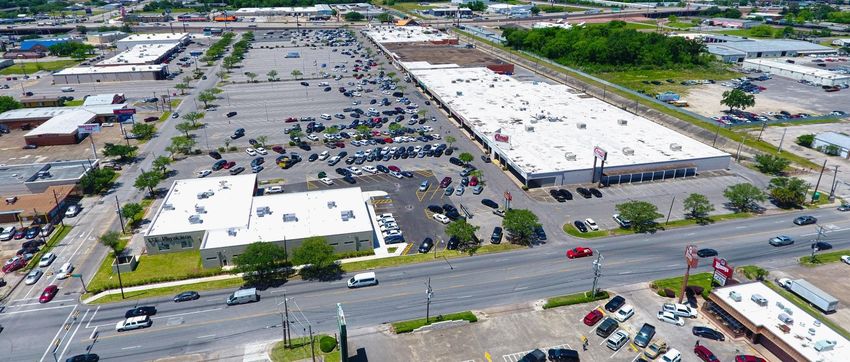
Located Off Interstate-10 with Over 140,000 VPD
5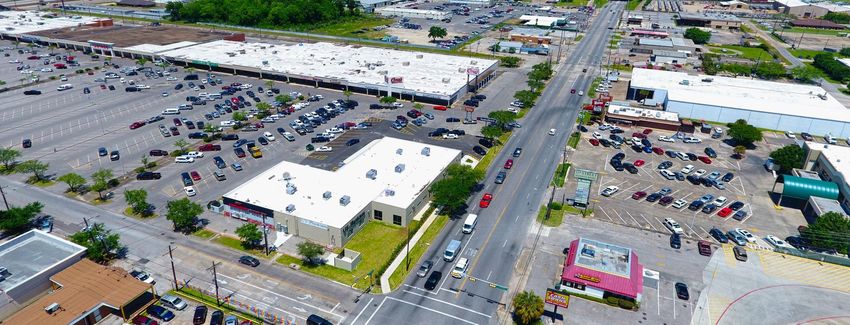
6
7
8
140,970 VPD

              9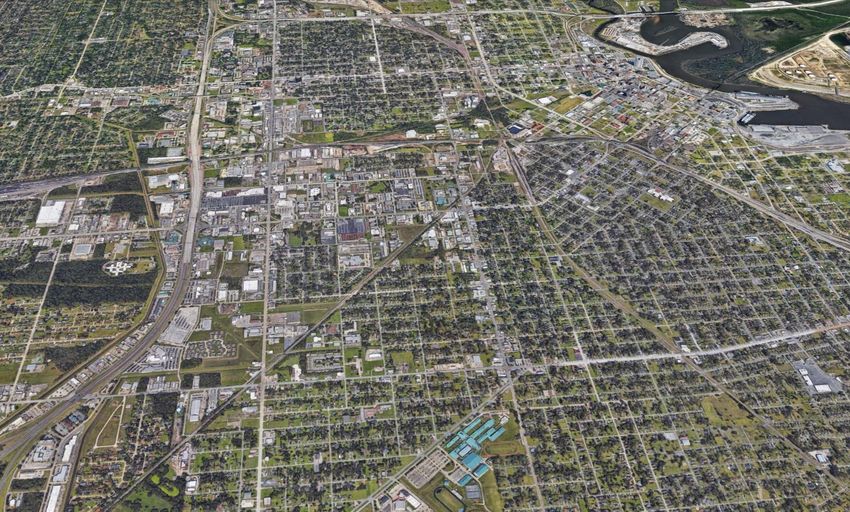
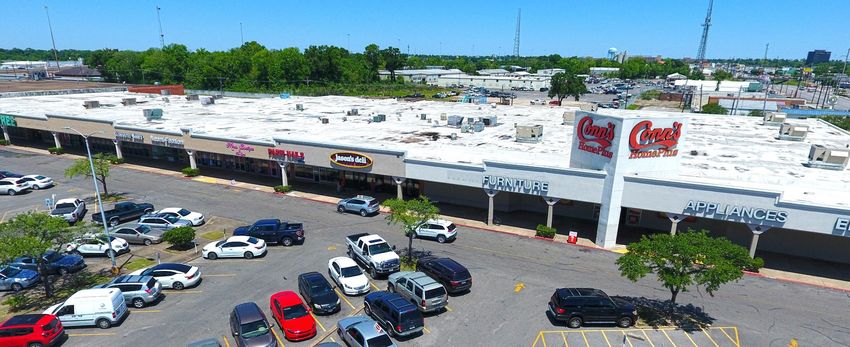
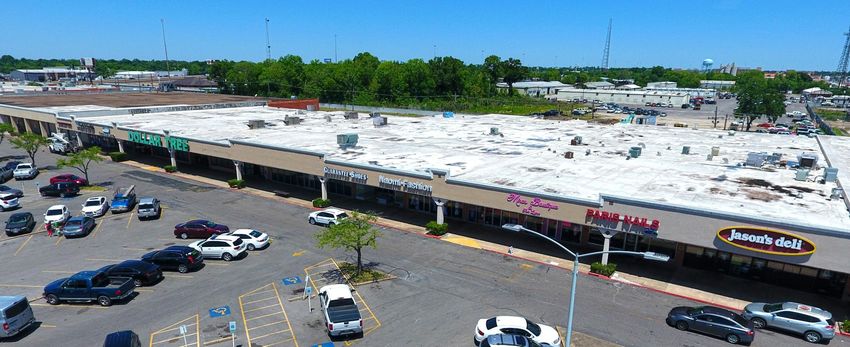
Shadow Anchored Center (Not Included)

                                        10
The Event Centre
Central Senior
High School
Baptist Hospitals
Of Southeast Texas King Middle School
SUBJECT PROPERTY Pathways
Learning Center
Ozen High School
56,237 Residents | 100,203 Employees
$57,260 Average Household Income
11Beaumont Country Club
Knife River Corporation
Fire Museum of Texas
Edison Museum
Art Museum of
Southeast Texas Beaumont
Industrial Area
Baptist Hospitals Harbor Island
Beaumont Municipal of Southeast Texas
Athletic Complex 1,620 employees
ExxonMobil Refinery
SUBJECT PROPERTY 2,400 acres | Employees: 2040 people
Monsignor Kelly & 1000 contractors
Catholic High School
Lamar University
14,103 enrollment
Ozen High School 1,410 employees
Spindletop
Park
Lamar University
• Texas Home Health America LP
Enrollment: 14,100
Ozen High School • Exxon Mobile Refinery
Enrollment: 1,100 • Memorial Hermann Hospital
Monsignor Kelly High School 105,694 Residents | 153,637 Employees • Baptist Hospitals of SE Texas
Enrollment: 450 $59,981 Average Household Income • Beaumont Refinery
12265 Miles
1302 PRICING & FINANCIAL ANALYSIS
UT PHYSICIANS
      PLAZA                 PRICING DETAIL & OPERATING DATA

                                                                                                         DEMOGRAPHICS
                                                                                                1-Mile     3-Miles      5-Miles
                                                            2017 Estimate Population             4,835      56,237      105,694
                                                            2017 Estimate Households             1,769      22,049       40,908
                                                            Daytime Population                  15,245     100,203      153,637
                                                            Average Household Income           $44,015     $57,260      $59,981

                                                                                                 MAJOR EMPLOYERS
                                                            EMPLOYER                                        # OF EMPLOYEES

Click Here to View Exclusive Video Presentation            Texas Home Health America LP                                   5,540

 https://vimeo.com/269695326/99f115dda9                    Exxon Mobile Refinery                                          3,040
                                                           Memorial Hermann Baptist Hospital                              1,759
THE OFFERING
                                                           Baptist Hospital of SE Texas                                   1,700
                                                           Beaumont Refinery                                              1,545
            3610 Stagg Drive, Beaumont, TX                 Dawson Marine Inc                                              1,000

                                                                                                         MAJOR TENANTS
SITE DESCRIPTION
                                                                                                           LEASE        LEASE
                                                                         TENANT                  GLA
                                                                                                         EXPIRATION      TYPE
Built | Renovated                            1968 | 2017
                                                            University of Texas Physicians      12,000     06/30/2027        NNN
Gross Leasable Area (GLA)                     15,744 SF
                                                            Safelite AutoGlass                   3,744     05/31/2021        NNN
Current Occupancy                                 100%
Lot Size                                 +/- .92 Acres
Ownership                                    Fee Simple

                                                                                                                        15
UT PHYSICIANS
RENT ROLL AND TENANT LEASE SUMMARY
PLAZA
Tenant Name (Lease Type) Square Pro-Rata Lease Lease Annual Monthly Annual Base Rent Base Rent Tenant
Tenant Description Feet Share Commence Expiration Rent/ SF Base Rent Base Rent Changes On Changes To Option Terms
University of Texas Physicians 12,000 76.22% 07/01/2017 06/30/2027 $20.00 $20,000 $240,000 None None Four, Five-Year
UT Physicians CAM: Reimburses pro-rata share, 6% cap on increases (excluding utilities & snow removal) (Opt. 1) 07/01/2027 $288,000 Years 11-15
+/- 1,500 Clinicians | Over 80
Taxes: Reimburses pro-rata share (Opt. 2) 07/01/2032 $312,000 Years 16-20
medical specialties and
subspecialties, provides multi- Insurance: Reimburses pro-rata share (Opt. 3) 07/01/2037 $336,000 Years 21-25
specialty care. UT Physicians
Management: Management expense cannot exceed 4% of gross rental income (Opt. 4) 07/01/2042 $360,000 Years 26-30
help patients needing urgent,
highly complex care. Other: None
Safelite AutoGlass 3,744 23.78% 06/01/2011 05/31/2021 $12.00 $3,744 $44,928 None None One, Five-Year
Safelite Fulfillment, Inc. CAM: Reimburses pro-rata share, 2% cap on increases (excluding utilities & snow removal) (Opt. 1) 06/01/2021 $48,672 Years 11-15
+/- 720 Locations | Over 70
Taxes: Reimburses pro-rata share
years of service, Safelite
knows auto glass and have Insurance: Reimburses pro-rata share
grown to be the largest auto Management: Management expense cannot exceed 5% of total common area expenses
glass specialist in the United
States. Other: None
Total Occupied 15,744 100.00% $23,744 $284,928
Total Vacant 0 0.00% $0 $0
Totals 15,744 100.00% $23,744 $284,928
16
16TENANT OVERVIEW
ABOUT UT PHYSICIANS
With more than 1,500 clinicians certified in more than 80 medical specialties and subspecialties, UT
Physicians provides multi-specialty care for the entire family. UT Physicians helps patients needing
urgent, highly specialized or complex care and also provides high-quality, wellness-oriented primary
care for routine illnesses and maintenance of good health.
Affiliated with the John P. and Kathrine G. McGovern Medical School at The University of Texas Health UT Physicians among the
Science Center at Houston (UTHealth), UT Physicians health care providers are internationally
recognized for leading-edge medical research and treatment. Many are among the Woodward-White Woodward-White “Best
“Best Doctors in America.” UT Physicians and McGovern Medical School are national leaders in
research, education and clinical excellence. Doctors in America.”
Check Website here: https://www.utphysicians.com/about/
LEASE SUMMARY
Lease Type Triple-Net (NNN)
Tenant
Rent Increases
University of Texas Physicians
(Opt. 1) 07/01/2027 - $288,000
80+
Guarantor Corporate SPECIALTIES
Rating AAA (Moody’s)
Rent Commencement July 1, 2017
Lease Expiration June 30, 2027
Lease Term Remaining Over Nine Years
HEADQUARTERED IN
Original Lease Term Ten Years
Renewal Options Four, Five-Year University of Texas
RENT SCHEDULE
YEAR ANNUAL RENT MONTHLY RENT RENT/SF
07/01/2017 – 06/30/2027 $240,000 $20,000 $20.00 FOUNDED
OPTION SCHEDULE
1972
YEAR ANNUAL RENT MONTHLY RENT RENT/SF
07/01/2027 – 06/30/2032 $288,000 $24,000 $24.00
07/01/2032 – 06/30/2037 $312,000 $26,000 $26.00 MORE THAN
07/01/2037 – 06/30/2042 $336,000 $28,000 $28.00
07/01/2042 – 06/30/2047 $360,000 $30,000 $30.00 1,500 CLINICIANS
17TENANT OVERVIEW
ABOUT SAFELITE
With more than 70 years of service, Safelite knows auto glass. Safelite was founded at
a single location in Wichita, Kansas in 1947 and has grown to become the largest auto
glass specialist company in the United States with more than 720 locations
nationwide. On Average, Safelite Provides
From front and rear windshields to side glass, we’re proud to serve 6 million customers
every year. Whatever your auto glass needs may be, there’s a good chance we can fix
Over 1.5 Million Windshields
it through repair or replacement. a Year to More Than 6 Million
LEASE SUMMARY Satisfied Customers
Visit Safelite.com - https://www.safelite.com/
Lease Type Triple-Net (NNN)
Tenant Safelite
Rent Increases (Opt. 1) 06/01/2021 - $48,672
Guarantor Corporate
720+
Ticker Private LOCATIONS
Rent Commencement June 1, 2011
Lease Expiration May 31, 2021
HEADQUARTERED IN
Lease Term Remaining Nearly Three Years
Original Lease Term Ten Years Columbus, OH
Renewal Options One, Five-Year
RENT SCHEDULE
YEAR ANNUAL RENT MONTHLY RENT RENT/SF
06/01/2011 – 05/31/2021 $44,928 $3,744 $12.00
FOUNDED
1947
OPTION SCHEDULE
YEAR ANNUAL RENT MONTHLY RENT RENT/SF
06/01/2021 – 05/31/2025 $48,672 $4,056 $13.00
12,500+ EMPLOYEES
18UT PHYSICIANS
PLAZA PRICING DETAIL & OPERATING DATA
CURRENT OPERATING DATA
Scheduled Base Rental Income $284,928
Expense Reimbursement Income
CAM $5,161
Insurance $13,062
Real Estate Taxes $11,803
Management Fees $12,598
Total Reimbursement Income $42,624
Effective Gross Revenue $327,552
Less: Operating Expenses ($42,624)
Net Operating Income $284,928
List Price $4,320,000 Operating Expenses Current Per/SF
Common Area
Utilities $1,116 $0.07
Maintenance
CAP Rate 6.60%
Price/SF $274 Landscaping $1,837 $0.12
General R&M $2,208 $0.14
Net Operating Income $284,928
Total CAM Expenses $5,161 $0.33
Gross Leasable Area (GLA) 15,744 SF
Insurance Premiums $13,062 $0.83
Built | Renovated 1968 | 2017 Real Estate Taxes $11,803 $0.75
Lot Size +/- .92 Acres Management Fee (4% of EGR) $12,598 $0.80
Ownership Fee Simple Total Expenses $42,624 $2.71
1903 DEMOGRAPHIC & MARKET OVERVIEW
5 Miles

3 Miles

1 Mile

          UT PHYSICIANS PLAZA

                                21
UT PHYSICIANS
PLAZA DEMOGRAPHIC & MARKET OVERVIEW
POPULATION 1 Miles 3 Miles 5 Miles HOUSEHOLDS BY EXPENDITURE 1 Miles 3 Miles 5 Miles
▪ 2022 Projection Total Average Household Retail Expenditure $48,752 $53,229 $55,593
Total Population 4,749 55,868 105,304 ▪ Consumer Expenditure Top 10 Categories
▪ 2017 Estimate Housing $12,904 $14,018 $14,583
Total Population 4,835 56,237 105,694 Transportation $10,042 $10,607 $11,115
▪ 2010 Census Shelter $6,879 $7,379 $7,698
Total Population 4,795 55,918 104,928 Food $5,324 $5,819 $6,115
▪ 2000 Census Utilities $3,480 $3,658 $3,769
Total Population 4,951 59,082 104,125 Health Care $3,334 $3,746 $3,854
▪ Current Daytime Population Personal Insurance and Pensions $3,331 $4,116 $4,514
2017 Estimate 15,245 100,203 153,637 Entertainment $1,663 $1,972 $2,069
HOUSEHOLDS 1 Miles 3 Miles 5 Miles Household Furnishings and Equipment $1,256 $1,508 $1,581
▪ 2022 Projection Apparel $1,179 $1,307 $1,378
Total Households 1,777 22,256 41,398 POPULATION PROFILE 1 Miles 3 Miles 5 Miles
▪ 2017 Estimate ▪ Population By Age
Total Households 1,769 22,049 40,908 2017 Estimate Total Population 4,835 56,237 105,694
Average (Mean) Household Size 2.52 2.49 2.50 Under 20 28.81% 27.42% 28.20%
▪ 2010 Census 20 to 34 Years 20.62% 20.72% 22.22%
Total Households 1,788 22,177 40,960 35 to 39 Years 6.59% 6.04% 6.06%
▪ 2000 Census 40 to 49 Years 11.02% 11.09% 11.05%
Total Households 1,762 23,307 40,856 50 to 64 Years 17.15% 19.30% 18.83%
▪ Occupied Units Age 65+ 15.80% 15.44% 13.62%
2022 Projection 1,777 22,256 41,398 Median Age 35.41 36.49 34.67
2017 Estimate 2,007 25,289 46,492 ▪ Population 25+ by Education Level
HOUSEHOLDS BY INCOME 1 Miles 3 Miles 5 Miles 2017 Estimate Population Age 25+ 3,133 36,971 67,274
▪ 2017 Estimate Elementary (0-8) 10.38% 7.55% 6.13%
$150,000 or More 2.01% 5.47% 6.53% Some High School (9-11) 11.32% 10.11% 9.18%
$100,000 - $149,000 5.04% 7.97% 8.67% High School Graduate (12) 34.13% 31.54% 31.34%
$75,000 - $99,999 8.40% 8.12% 8.29% Some College (13-15) 26.57% 24.32% 24.71%
$50,000 - $74,999 16.06% 14.29% 15.34% Associate Degree Only 4.30% 4.84% 5.53%
$35,000 - $49,999 11.74% 13.70% 13.93% Bachelors Degree Only 5.69% 13.37% 14.81%
Under $35,000 56.76% 50.46% 47.23% Graduate Degree 3.22% 6.65% 6.87%
Average Household Income $44,015 $57,260 $59,981 Created on May 2018
Median Household Income $31,220 $34,641 $37,429
Per Capita Income $16,453 $22,678 $23,577
Source: © 2017 Experian
22UT PHYSICIANS
PLAZA DEMOGRAPHIC & MARKET OVERVIEW
Population Race and Ethnicity
In 2017, the population in your selected geography is 105,694. The The current year racial makeup of your selected area is as follows:
population has changed by 1.51% since 2000. It is estimated that the 37.11% White, 46.90% Black, 0.05% Native American and 3.79%
population in your area will be 105,304 five years from now. The Asian/Pacific Islander. Compare these to US averages which are:
current population is 47.97% male and 52.03% female. The median 70.42% White, 12.85% Black, 0.19% Native American and 5.53%
age of the population in your area is 34.67, compare this to the US Asian/Pacific Islander. People of Hispanic origin are counted
average which is 37.83. The population density in your area is independently of race.
1,346.67 people per square mile.
People of Hispanic origin make up 17.09% of the current year
population in your selected area. Compare this to the US average of
17.88%.
Households Housing
There are currently 40,908 households in your selected geography. The median housing value in your area was $100,842 in 2017,
The number of households has changed by 0.13% since 2000. It is compare this to the US average of $193,953. In 2000, there were
estimated that the number of households in your area will be 41,398 24,475 owner occupied housing units in your area and there were
five years from now, which represents a change of 1.20% from the 16,380 renter occupied housing units in your area. The median rent at
current year. The average household size in your area is 2.50 persons. the time was $386.
Income Employment
In 2017, the median household income for your selected geography is In 2017, there are 153,637 employees in your selected area, this is
$37,429, compare this to the US average which is currently $56,286. also known as the daytime population. The 2000 Census revealed
The median household income for your area has changed by 16.26% that 58.76% of employees are employed in white-collar occupations
since 2000. It is estimated that the median household income in your in this geography, and 41.29% are employed in blue-collar
area will be $43,618 five years from now, which represents a change occupations. In 2017, unemployment in this area is 9.75%. In 2000,
of 16.54% from the current year. the average time traveled to work was 20.00 minutes.
The current year per capita income in your area is $23,577, compare
this to the US average, which is $30,982. The current year average
household income in your area is $59,981, compare this to the US
average which is $81,217.
Source: © 2017 Experian 23UT PHYSICIANS
PLAZA DEMOGRAPHIC & MARKET OVERVIEW
BEAUMONT
OVERVIEW
The Beaumont metro is located in East Texas off the Gulf of Mexico and
is one of the nation’s largest petrochemical refining areas. It shares
borders with the Houston metro to the west and the Lake Charles market
METRO HIGHLIGHTS
in Louisiana to the east. The metro consists of the counties of Newton,
PORT ACTIVITY
Hardin, Jefferson and Orange and contains 413,000 people. The cities of The Port of Beaumont contributes to significant economic activity in the region.
Beaumont, Port Arthur and Orange are known as the Golden Triangle. It is one of the nation’s largest seaports based on tonnage.
Beaumont is the most populous city with 119,500 residents, followed
INDUSTRIAL AND MANUFACTURING SECTORS
Port Arthur with 55,500. Large industrial facilities in the area include the Exxon Mobil refinery and
chemical plants for Goodyear and DuPont.
CORPORATE HEADQUARTERS
Corporate headquarters represent a variety of industries and include
companies such as Jason’s Deli.
ECONOMY
▪ Energy-sector activities play a significant part in the metro’s economy. Companies represented in
the area include Gulf Oil, Humble Oil, Magnolia Petroleum Co. and Exxon Mobil. The area is home to
a large portion of the nation’s refining capacity.
▪ Aside from corporate headquarters and the energy industry, large employers represent diverse
employment sectors and generate large staff counts. These include Conn’s, Lamar University,
Christus St. Elizabeth Hospital and Memorial Baptist Hospital.
▪ The Sabine-Neches Waterway ranks among the top in the U.S. in terms of commercial military
outload and is one of the nation’s largest waterway by cargo volume.
DEMOGRAPHICS
2017 2017 2017 2017 MEDIAN
POPULATION: HOUSEHOLDS: MEDIAN AGE: HOUSEHOLD INCOME:
414K 153K 37.1 $43,400
Growth Growth U.S. Median: U.S. Median:
2017-2022*: 2017-2022*:
0.7% 2.2% 37.8 $56,300
* Forecast
Sources: Marcus & Millichap Research Services; BLS; Bureau of Economic Analysis; Experian; Fortune; Moody’s Analytics; U.S. Census Bureau
24UT PHYSICIANS
PLAZA DEMOGRAPHIC & MARKET OVERVIEW
HOUSTON METRO AREA
Post-Hurricane Recovery Boosts Retail
Spending, Draws Investors
Local residents rebuilding after floods, sales rise. Economic growth is returning to Houston as the metro
emerges from the damage created by Hurricane Harvey and struggles stemming from the decline in energy
prices in previous years. In 2018, job additions will rise, with local organizations creating more positions than
the previous three years combined. Strengthening employment and recovery efforts related to the hurricane
will provide an additional boost to retail consumption this year, and retail sales are expected to rise faster
than the national pace. Local households replacing goods lost during the flooding will help lift spending,
while residents temporarily relocating to assist with rebuilding efforts raise sales at restaurants, grocery
stores and other needs-based retailers. As a result, retailers continue to expand in the metro this year, and
grocers such as Kroger and H-E-B will open multiple locations on the west and north sides of Houston.
Fitness centers, dollar stores, plus numerous restaurant and entertainment options will open this year,
helping keep vacancy 60 basis points below the 10-year average.
Development in West Houston attracts investors. The increasingly diverse propelled the Houston retail
segment in recent years, keeping buyers interested in the local market. The metro is poised for an increase
in trading volume this year, however, as staffing in the oil and gas industry has stabilized and new
opportunities are presented in western submarkets. This side of the metro will receive an influx of new
properties as development continues along the Grand Parkway. Grocery-anchored retail centers are in high
demand, often trading in the mid-6 percent area. Meanwhile, strip-center assets with service-oriented
tenants pique buyer interest, often changing hands in the low-7 percent span. Properties in West Houston
submarkets such as Katy, Sugar Land out toward the Grand Parkway, and up to The Woodlands will draw
strong buyer demand this year.
* Forecast
Sources: Marcus & Millichap Research Services; BLS; CoStar Group, Inc.
25UT PHYSICIANS
PLAZA DEMOGRAPHIC & MARKET OVERVIEW
HOUSTON METRO AREA
2018 Market Forecast
NRI Rank Higher vacancy than a large share of markets plus slow rent gains pull
30, down 4 places Houston down four spots this year.
Employment Employers will create 75,000 positions in 2018 following the addition of
up 2.5% 45,000 jobs in 2017.
Construction Delivery volume slows after the completion of nearly 5.6 million square feet
2.9 million sq. ft. in 2017. Sugar Land and Conroe each welcome more than 400,000 square
feet of new supply in 2018.
Vacancy Vacancy rises for a second year, reaching 6.0 percent in 2018 as 2 million
up 20 bps square feet of retail space is absorbed.
Rent The average asking rent advances to $17.12 per square foot, increasing for
up 1.5% a second consecutive year.
Investment Retail assets in heavily flooded areas of Houston could be value-add
targets this year. Owners in these locales may choose to dispose of
properties in lieu of renovating, while others may divest as some tenants are
unable to reopen stores. * Forecast
Sources: Marcus & Millichap Research Services; CoStar Group, Inc.;
Real Capital Analytics
26UT PHYSICIANS
PLAZA
www.dumesfalk.com
EXCLUSIVELY LISTED BY:
RYAN K. ROEDERSHEIMER
Associate Director - National Retail Group
Cincinnati Office
Tel: (513) 878-7796
Fax: (513) 878-7710
ryan.roedersheimer@marcusmillichap.com
Licenses: OH SAL.2015004880
JOEL M. DUMES
Senior Vice President Investments
Senior Director - National Retail Group
Cincinnati Office
Tel: (513) 878-7720
Fax: (513) 878-7710
joel.dumes@marcusmillichap.com
Licenses: OH SAL.2003013045, KY 63818
STANTON R. FALK
First Vice President Investments
Senior Director - National Retail Group
Cincinnati Office
Tel: (513) 878-7721
Fax: (513) 878-7710
stanton.falk@marcusmillichap.com
Licenses: OH SAL.2012001364
Broker of Record: Timothy SpeckYou can also read