Correlation of frontal prism structures and slope failures near the trench axis with shallow megathrust slip at the Japan trench - Nature
←
→
Page content transcription
If your browser does not render page correctly, please read the page content below
www.nature.com/scientificreports
OPEN Correlation of frontal prism
structures and slope failures
near the trench axis with shallow
megathrust slip at the Japan Trench
Yasuyuki Nakamura1*, Toshiya Fujiwara2, Shuichi Kodaira1, Seiichi Miura1 & Koichiro Obana1
Since the giant 2011 Tohoku earthquake and tsunami, much research has focused on the distribution
of coseismic slip at shallow depths during this subduction megathrust event. Here we present seismic
images obtained in the immediate vicinity of the trench axis, that show thrust faults and fold-and-
thrust type deformation structures near the epicenter of the 2011 Tohoku earthquake where the large
coseismic slip has been inferred, and chaotic structure and the absence of thrust faults in northern
and southern source areas. Seismic profiles show evidence of slope failures of the trench inner wall in
a proposed tsunami source region around 39°–40° N, where the slips estimated from previous studies
are in disagreement. Our results show that structural characteristics in the trench axis may be related
to the occurrence of shallow megathrust slip and tsunamigenesis in the Japan Trench.
The giant (M9) 2011 Tohoku earthquake ruptured the plate boundary fault in the Japan Trench subduction zone
through the shallowest part of the megathrust, and this shallow slip in particular enhanced the destructive tsu-
nami that followed. Numerous rupture models have been provided to elucidate the characteristics of this giant
earthquake using seismological1,2, geodetic3, and tsunami4,5 data, and combinations of these6. One distinctive
feature is a large (~ 50 m) shallow megathrust slip that occurred at around 38°–38°30′N. Another characteristic
is a proposed tsunami source region at around 39°–40°N, to the north of the large shallow slip area identified by
tsunami data analyses4–6. Seafloor geodetic observations7 and estimates of seafloor displacement based on bathy-
metric datasets8–11 are strong evidence with which to examine the propagation of fault slip towards the seafloor
through the trench axis area. Research using differential bathymetry has shown that seafloor displacement during
the Tohoku earthquake was > 50 m near the trench axis at 38°05′–38°35′N, where the large slip occurred during
the Tohoku earthquake8,9, but was not significant outside of this a rea10,11 (Fig. 1). Interestingly, the displacement
estimated from differential bathymetry was not significant near the trench axis at 39°10′–39°30′N10, the area
proposed as a northern source region of the tsunami4–6. The structure of deformation within the overriding plate
at the toe of the frontal prism near the epicentre is considered an important characteristic for understanding
shallow megathrust events such as the Tohoku earthquake9.
Here we present seismic profiles acquired at the immediate vicinity of the Japan trench axis, including those
obtained at the same locations as the differential bathymetry estimates. We use these results in combination with
seismic profiles in the area near the proposed shallow slip and tsunami source to examine the seismic structure
in the vicinity of the trench axis. We find that the structural characteristics seen in the seismic profiles are related
to seafloor displacement and possible tsunami generation.
Results
Seismic profiles in the vicinity of the differential bathymetry estimates. The time-migrated
seismic profiles clearly reveal detailed structures in the vicinity of the Japan Trench axis, including incoming
sediment on the Pacific plate, bending-related normal faults, the oceanic basement, and reverse faults and fold
structure within the vicinity of the trench axis. We interpreted these seismic sections in terms of four “seismic
units” (SU) following a previous study12, as shown in Fig. 2a–f: SU1 is interpreted as acoustically chaotic frontal
1
Japan Agency for Marine-Earth Science and Technology (JAMSTEC), 3173‑25 Showa‑machi, Kanazawa‑ku,
Yokohama, Kanagawa 236‑0001, Japan. 2Japan Agency for Marine-Earth Science and Technology (JAMSTEC),
2‑15 Natsushima‑cho, Yokosuka, Kanagawa 237‑0061, Japan. *email: yasu@jamstec.go.jp
Scientific Reports | (2020) 10:11607 | https://doi.org/10.1038/s41598-020-68449-6 1
Vol.:(0123456789)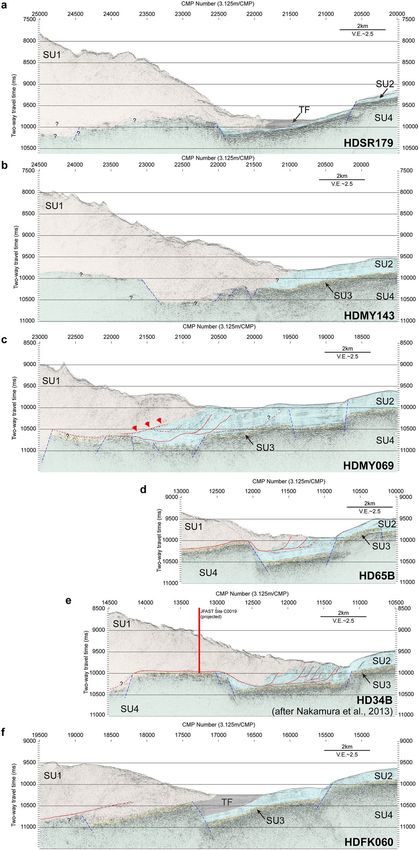
www.nature.com/scientificreports/
Figure 1. Changes in seafloor elevation after the 2011 Tohoku earthquake and locations of seismic lines. ▸
Bathymetric contours are in meters; the 7,000 m contour delineates the trench axis. Thick black dotted line
corresponds to the toe of the landward slope. The map location is indicated by the red rectangle in the inset
map. Orange arrows and numbers indicate trench-normal displacement, and black numbers indicate vertical
displacement, estimated by using bathymetric data from before and after the Tohoku e arthquake8–11. Bold
black lines indicate the locations of the seismic profiles shown in Figs. 2 and 3. Green contours outline the
area of large slip (solid contour, ≥ 25 m; dashed contour, ≥ 10 m) of the 2011 Tohoku earthquake obtained by
tsunami inversion6, and blue contours indicate the area of sea surface elevation (solid contour, ≥ 5 m; dashed
contour, ≥ 1 m) determined by tsunami i nversion5. The red shaded polygon indicates the tsunami source region,
estimated from ocean-bottom electromagnetometer data23. The map and arrows of changes in seafloor elevation
were reproduced from the data published in ref.11. The bathymetry data JTOPO30v2 by Marine Information
Research Center, Japan Hydrographic Association was used to draw the contour in this figure. The map was
created with GMT-4.5.7 (https://www.generic-mapping-tools.org/)35.
prism sediment, SU2 as incoming hemipelagic and pelagic soft sediment, SU3 as chert, and SU4 as igneous
basement. We additionally interpreted a stratified unit TF, which shows a clear onlap relationship with SU2 at
the trench axis, corresponding to the trench fill sediments (Fig. 2a,f). Three of the seismic profiles in Fig. 2c–e
were acquired in the area with the huge shallow slip during the 2011 Tohoku earthquake around 38°–38°30′N.
Seismic profiles HDMY069 and HD65B (Fig. 2c,d), where differential bathymetry suggested a large horizontal
displacement8,9, show deformation of the sediment units by thrust faults in the vicinity of the trench axis. Seismic
profile HD34B (Fig. 2e), located very close to the JFAST drill site C0019, where the coseismic slip was suggested
to reach near the trench axis13–15, shows similar deformation12. Three other seismic profiles (Fig. 2a,b,f), located
outside of the area with very large shallow slip, display a chaotic acoustic character and no clear thrust faults in
the vicinity of the trench axis. The differential bathymetry indicated little or no trench-normal horizontal dis-
placement along these profiles10,11.
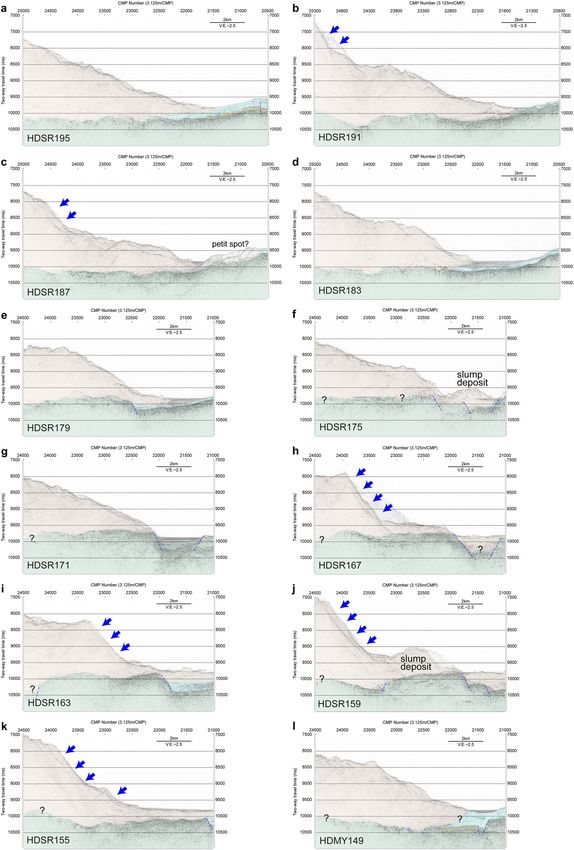
Seismic profiles in the northern tsunami source area. Figure 3a-l shows 12 seismic profiles of the
trench axis and lowermost landward slope between around 39°12′N and 39°40′N, an area that includes the pro-
posed northern tsunami source r egion4–6 (see Fig. 1). Although some profiles include sideswipe reflections, in
general, all of these profiles show an acoustically chaotic structure and no thrust faults within the sediment near
the trench axis. Six profiles (HDSR191, HDSR187, HDSR167, HDSR163, HDSR159, and HDSR155) depict both
steep slopes (blue arrows in Fig. 3b,c,h–k) and possible slope failures in the trench inner wall, whereas the other
profiles, although they do not show steep slopes, also suggest slope failures. Several seismic profiles, especially
lines HDSR175 and HDSR159, also show slump deposits overlying the incoming sediments in the trench axis.
Discussion
Shallow megathrust slip and seismic image in the trench axis. Published rupture models of the
2011 Tohoku earthquake proposed by seismological1,2, geodetic3, and tsunami4–6 inversions largely agree in
placing the largest slip at around 38°–38°30′N. Seismic profile HDMY069 and H D65B9 (Fig. 2c,d), located at
38°35′N and 38°05′N respectively, displays fold-and-thrust structures imaged within the sediment in the trench
axis, where differential bathymetry suggested a large (~ 50–70 m) trenchward displacement during the Tohoku
earthquake8,9. Similarly, folding and thrust faults have been identified near the trench axis at around 37°55′N
(HD34B, Fig. 2e)12, very close to the JFAST drill site C0019, where borehole temperature measurements strongly
suggest that the fault rupture during the Tohoku earthquake nearly reached the trench a xis15. However, other
seismic profiles (Fig. 2a,b,f), obtained outside of the largest shallow slip area, display an acoustically chaotic
structure and no clear folds or thrust faults in the trench axis. The differential bathymetry suggested no signifi-
cant trench-normal horizontal displacement during the Tohoku earthquake in the vicinity of these three profiles.
One possible interpretation of these observations is that thrust faults are present within the trench axis area at
37°55′–38°35′N, but absent at 37°25′N and 39°12′–39°40′N. An alternative interpretation, however, is that thrust
faults, although present, were not clearly imaged by the seismic profiles obtained at 37°25′N and 39°12′–39°40′N.
Possible reasons why the faults might not be clearly imaged in the Japan Trench are that (1) as a result of erosion
the original sediment strata are not preserved, so that the faults, even if they exist, cannot be clearly distinguished
by the offset of strata or that (2) the acoustic impedance contrast between the faults or fault zone and the sur-
rounding area is not strong enough to be imaged by the seismic method used. At site C0019, existence of a fault
zone is suggested within the hanging-wall sediments above the plate boundary fault by logging data analysis, but
they are not clearly imaged on the seismic profile crossing the site16. Seismic sections in Fig. 2 except for the Line
HDMY143 (Fig. 2a) show all the seismic units in the incoming plate (SU2–SU4), which may indicate that the
incoming sediments were not largely eroded in the most of the Japan Trench axis.
Seismic profiles along Lines HDMY069, HD65B, and HD34B clearly depict thrust faults as having displaced
sediment strata and caused related folding deformation (Fig. 2c–e). Because thrust faults are observed along the
differential bathymetry profiles showing large coseismic seafloor displacement (Fig. 2c–e), the imaged thrust
faults can be interpreted as the shallowest portions of the plate boundary fault in the trench axis. The seismic
profile of Line HDMY069 also depicts a low-angle reflection, interpreted as a thrust fault, within the acousti-
cally chaotic sediment layer (red arrows in Fig. 2c). The existence of this reflection suggests a well-developed
thrust fault or fault zone that has a strong enough acoustic impedance contrast to allow it to be imaged against
the surrounding chaotic sediments. The high amplitude reflections from strong acoustic impedance contrast
may be related to the high pore pressure associated with the fault zone as inferred in the central A merica17,18
Scientific Reports | (2020) 10:11607 | https://doi.org/10.1038/s41598-020-68449-6 2
Vol:.(1234567890)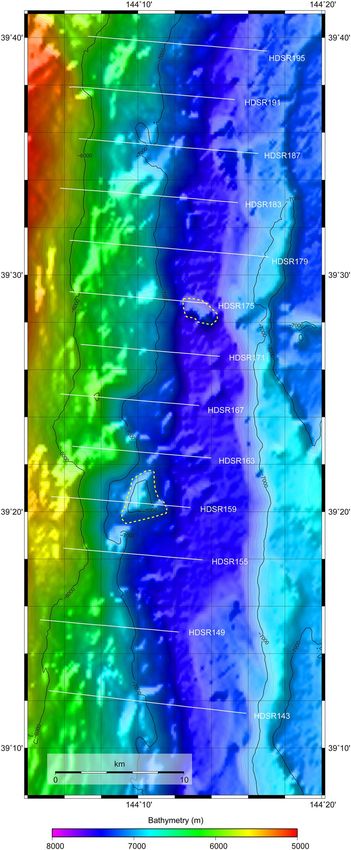
www.nature.com/scientificreports/

Scientific Reports |   (2020) 10:11607 |   https://doi.org/10.1038/s41598-020-68449-6        3

                                                                                        Vol.:(0123456789)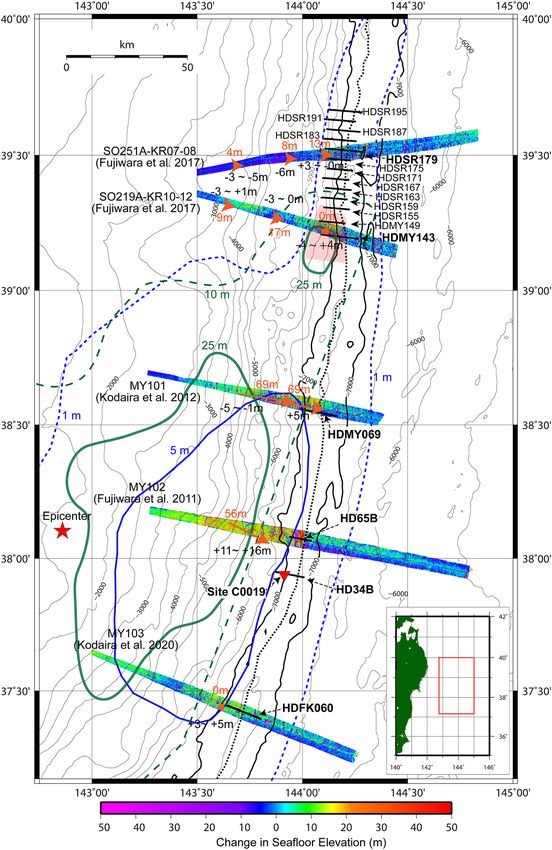
www.nature.com/scientificreports/
Figure 2. Seismic profiles with interpretation. Post-stack time-migrated sections, with interpretation shown
by colour, along seismic survey lines (a) HDSR179, (b) HDMY143, (c) HDMY069, (d) HD65B, (e) HD34B12,
and (f) HDFK060 (locations shown in Fig. 1), which correspond to the locations of differential bathymetry
estimates. Seismic units SU1 (brown), SU2 (blue), SU3 (yellow), SU4 (green), and TF (grey) are described in the
text. Dashed lines indicate normal faults (blue) and thrust faults (red). Red arrows in Fig. 2c indicate a low-angle
dipping reflection interpreted as a thrust fault. Vertical exaggeration is 2.5 ×, assuming a seismic velocity of
1,500 m/s. The seismic profile of HD34B was reproduced from the data published in Ref.12.
Scientific Reports | (2020) 10:11607 | https://doi.org/10.1038/s41598-020-68449-6 4
Vol:.(1234567890)www.nature.com/scientificreports/
Figure 3. Seismic profiles around 39°30′N. Post-stack time-migrated sections with interpretation shown
by colour, along seismic lines (a) HDSR195, (b) HDSR191, (c) HDSR187, (d) HDSR183, (e) HDSR179, (f)
HDSR175, (g) HDSR171, (h) HDSR167, (i) HDSR163, (j) HDSR159, (k) HDSR155, and (l) HDMY149.
Interpreted seismic units are the same as Fig. 2. Profile locations are shown in Fig. 1. Blue arrows indicate steep
slopes. Vertical exaggeration is 2.5 ×, assuming a seismic velocity of 1,500 m/s.
Scientific Reports | (2020) 10:11607 | https://doi.org/10.1038/s41598-020-68449-6 5
Vol.:(0123456789)www.nature.com/scientificreports/
and the Nankai T rough19,20 subduction zones. We suggest that the thrust faults clearly imaged in the trench axis
acted as the shallowest plate boundary megathrust during the Tohoku earthquake, and caused the large shallow
slip proposed by seismological studies and seafloor displacement observed by the differential bathymetry. The
high pore pressure associated with the fault zone might promote the shallow slip. We have to note that the area
discussed in this study is narrower than the horizontal resolution of the slip models proposed from seismo-
logical, geodetic, and tsunami data analyses. The megathrust slip which reached near the trench but not to the
seafloor could cause the deformation of the hanging wall p rism21. If the coseismic slip reached to the seafloor
and the hanging wall moved as a rigid block, it might not cause the deformation within the hanging wall. When
combining the results from different methods with different resolutions, careful consideration of those differ-
ences would be necessary to understand the shallow slip behavior of the subduction megathrusts. Based on the
correlation between the structures observed in the seismic sections and the distribution of the slip in the 2011
Tohoku earthquake, we speculate that the imaged thrust faults and folding structures in the vicinity of the trench
axis may be a proxy of past slip to the trench11.
Slope failure observed in the northern tsunami source region of the 2011 Tohoku earth-
quake. The seismic profiles clustered around 39°30′N (Fig. 3a-l) suggest that pervasive slope failure has
occurred in the past in this area, which extends at least 40 km along the trench. Seismic sections of lines
HDSR159 and HDSR175 in particular show possible slump deposits (Fig. 3f,j) with a horizontal size of ~ 3 km
(Fig. 4) that presumably represent a very recent geological process because they overlie the incoming sediments
in the trench. Slumping and slope failure are potentially tsunamigenic22, and a tsunami source near this region
has been proposed on the basis of tsunami data analyses from the Tohoku e arthquake4–6. A tsunami source in the
lower landward slope at around 39°10′N–39°15′N has also been inferred by an analysis of ocean-bottom electro-
magnetometer data23 (Fig. 1). A submarine mass failure (SMF) around 39°30′N was proposed as an additional
tsunami source to accommodate the high amplitude tsunami waveforms off Iwate, north of the e picentre24.
However, based on a detailed review of various studies on the rupture process of the Tohoku earthquake, Lay25
concluded that “an exotic source such as a slump or inelastic deformation is not required to account for the
runup (although that possibility cannot be ruled out)”. The amount of the slip along the plate boundary faults has
been estimated as ~ 35 m4, ~ 25 m6, or 30–40 m26 around 39°30′N by tsunami data analysis. On the other hand,
the differential bathymetry indicates that the trenchward horizontal displacement of the lowermost landward
slope during the Tohoku earthquake, if any, did not exceed the uncertainty of the estimates. The estimated value
was ~ 29 m at maximum around 39°12′N10, which is comparable to or slightly smaller than the values estimated
from tsunami data. Differential bathymetry estimates suggested that the existence of localized very large slip of
the megathrust in the shallow part near the trench is unlikely to explain the tsunami source, and the estimated
direction of the seafloor shift was mainly trench-parallel and the trench-normal shift was small10. This predomi-
nantly trench-parallel shift might have been caused by the broader small uplift in the lower s lope10. It is also
possible that bathymetric features such as small bumps or valleys caused by slope failures obscured the correla-
tion between the bathymetric data from before and after the earthquake. Taking into account the slope failures
imaged in our seismic profiles of this region, we speculate that small-scale slope failure might have contributed
to tsunamigenesis during the Tohoku earthquake. Note that no large-scale slope failure associated with the 2011
Tohoku earthquake was identified in the differential bathymetry result in this region, including the area of the
proposed SMF10,24. The slope failures observed in this study is located ~ 20 km trenchward of the area of the
proposed SMF24.
Bathymetric data obtained before the 2011 Tohoku earthquake show the presence of slump deposits in this
area27 (Fig. 4), so slope failure undoubtedly occurred before the Tohoku earthquake. The acoustically chaotic
character of the inner trench hanging wall on some of the seismic sections might be due to repeated slope failures
and erosion. The slump deposits observed on the seismic sections and in the bathymetry data were not, at least
initially, formed during the Tohoku earthquake, but they might be related to past tsunamis. This area has been
suggested to be the source region of the 1896 Meiji Sanriku earthquake and t sunami21,28. Although the estimated
large slip (~ 20 m) region is landward of our survey a rea29, the observed slump deposit might be related to the
1896 Meiji Sanriku event.
The structure and property of the incoming plate are important controlling factors of the seismogenesis and
structural evolution in the subduction zones. A recent study30 found that the post-spreading volcanism altered
the structure of the upper most part of the incoming Pacific plate in the vicinity of the trench axis around 39°N,
which corresponds to the area where slope failures were identified in the seismic profiles. Magmatic intrusions
and thermal metamorphism associated with post-spreading volcanism were suggested to disturb the smectite-
rich pelagic clay layer in incoming sediments, and the subduction of this disturbed area was suggested to prevent
giant near-trench interplate coseismic slip in this region30. Most of the seismic profiles around 39°30′N were
interpreted to lack the chert layer (SU3) and suggest that the pelagic clay layer was disturbed in the shallow most
part of the subduction zone. Seismic profiles (e.g., Fig. 3g–j) show rough basement topography and a small hill-
like structure interpreted as post-spreading volcanism (petit-spot, Line HDSR187, Fig. 3c). The absence of the
smectite-rich clay around the plate boundary fault could have increased the basal friction30. The increased basal
friction could have contributed to building higher critical taper angle and steeper slopes of the frontal prism31.
The taper angle estimated from our seismic sections in the small shallow slip area (Fig. 2a,b,f) is approximately
60% higher than that in the large shallow slip area (Fig. 2c–e) on average, assuming 1.8–2.1 km/s as the P wave
velocity within the hanging wall s ediments32,33. The subduction of the basement with rough topography might
have also caused the steep inner trench slopes. The steeper slopes could have caused slope failures observed in
this region. The taper angles in the Japan Trench were also estimated using regional-scale seismic p rofiles34. The
34
area of seamount subduction has a larger taper a ngle , which is in good agreement with our study.
Scientific Reports | (2020) 10:11607 | https://doi.org/10.1038/s41598-020-68449-6 6
Vol:.(1234567890)www.nature.com/scientificreports/
Figure 4. Bathymetry around 39°30′N. Shaded bathymetric map generated from compiled pre-earthquake
bathymetric data27. Locations of the seismic sections shown in Fig. 3 are also indicated. Yellow dashed lines
delineate slump bodies that were also identified on the corresponding seismic sections. The map was created
with GMT-4.5.7 (https://www.generic-mapping-tools.org/35.
Scientific Reports | (2020) 10:11607 | https://doi.org/10.1038/s41598-020-68449-6 7
Vol.:(0123456789)www.nature.com/scientificreports/
Summary
Various studies have shown that the large shallow plate boundary slip during the Tohoku earthquake occurred
in the central part of the Japan Trench but did not occur in other parts. Seismic profiles near the Japan Trench
axis acquired in the vicinity of the differential bathymetry estimates show that the difference in the amount
of the shallow slip during the earthquake corresponds to different characteristic structures in the trench axis.
Profiles in areas with large slip display folds and thrust faults, whereas ones in areas without large slip display
chaotic acoustic structures in the trench axis without any clearly imaged thrust faults or folding deformation.
The deformation structures created by thrust faults in the trench axis may thus be related to large shallow slip
of the plate boundary fault during the 2011 Tohoku earthquake. The faults moved the hanging wall, and its
displacement was observed in the differential bathymetry data. In the area near a proposed tsunami source at
around 39°–40° N, seismic profiles and bathymetry data show slump deposits, suggesting that slope failures
have occurred in the past. Considering the slip estimation from tsunami and differential bathymetry data, we
speculated that small-scale slope failure might have contributed to tsunamigenesis during the 2011 Tohoku
earthquake. Observations in the northern tsunami source area could be related to the subduction of incoming
plate altered by post-spreading volcanism, which could increase the basal friction of the frontal prism caused by
the absence of the basal input sediments.
Methods
The seismic dataset used in this study was collected during cruise KR13-11 of R/V Kairei in 2013 and cruise
KY15-14 of R/V Kaiyo in 2015. A digital streamer cable with 168–192 channel hydrophones at 6.25 m intervals,
towed at 6 m depth, recorded seismic signals from an array of airguns (6.23 L) towed at 5 m depth. The data
were sampled at 1 ms intervals, and airguns were fired every 37.5 m with 13.8 MPa of air pressure. We obtained
the best time-migrated images from the recorded data by using conventional procedures described in Ref.12.
Data availability
The seismic data used in this paper are available from the Japan Agency for Marine-Earth Science and Technol-
ogy (http://www.jamstec.go.jp/obsmcs_db/e/).
Received: 13 December 2019; Accepted: 24 June 2020
References
1. Ide, S., Baltay, A. & Beroza, G. C. Shallow dynamic overshoot and energetic deep rupture in the 2011 Mw 9.0 Tohoku-Oki earth-
quake. Science 332, 1426–1429 (2011).
2. Lay, T., Ammon, C. J., Kanamori, H., Xue, L. & Kim, M. J. Possible large near-trench slip during the 2011Mw 9.0 off the Pacific
coast of Tohoku Earthquake. Earth Planets Space 63, 687–692 (2011).
3. Iinuma, T. et al. Coseismic slip distribution of the 2011 off the Pacific Coast of Tohoku Earthquake (M9.0) refined by means of
seafloor geodetic data. J. Geophys. Res. Solid Earth 117, B07409 (2012).
4. Satake, K., Fujii, Y., Harada, T. & Namegaya, Y. Time and space distribution of coseismic slip of the 2011 Tohoku earthquake as
inferred from Tsunami waveform data. Bull. Seismol. Soc. Am. 103, 1473–1492 (2013).
5. Hossen, M. J., Cummins, P. R., Dettmer, J. & Baba, T. Tsunami waveform inversion for sea surface displacement following the 2011
Tohoku earthquake: Importance of dispersion and source kinematics. J. Geophys. Res. Solid Earth 120, 6452–6473 (2015).
6. Koketsu, K. et al. A unified source model for the 2011 Tohoku earthquake. Earth Planet. Sci. Lett. 310, 480–487 (2011).
7. Ito, Y. et al. Frontal wedge deformation near the source region of the 2011 Tohoku-Oki earthquake. Geophys. Res. Lett. 38, L00G05
(2011).
8. Fujiwara, T., Kodaira, S., No, T., Kaiho, Y. & Takahashi, N. The 2011 Tohoku-oki Earthquake: displacement reaching the trench
axis. Science 334, 1240 (2011).
9. Kodaira, S. et al. Coseismic fault rupture at the trench axis during the 2011 Tohoku-oki earthquake. Nat. Geosci. 5, 646–650 (2012).
10. Fujiwara, T. et al. Seafloor displacement after the 2011 Tohoku-oki earthquake in the northern Japan Trench examined by repeated
bathymetric surveys. Geophys. Res. Lett. 44, 11833–11839 (2017).
11. Kodaira, S., Fujiwara, T., Fujie, G., Nakamura, Y. & Kanamatsu, T. Large coseismic slip to the trench during the 2011 Tohoku-Oki
earthquake. Annu. Rev. Earth Planet. Sci. 48, 321–343 (2020).
12. Nakamura, Y., Kodaira, S., Miura, S., Regalla, C. & Takahashi, N. High-resolution seismic imaging in the Japan Trench axis area
off Miyagi, northeastern Japan. Geophys. Res. Lett. 40, 1713–1718 (2013).
13. Chester, F. M. et al. Structure and composition of the plate-boundary slip zone for the 2011 Tohoku-Oki earthquake. Science 342,
1208–1211 (2013).
14. Ujiie, K. et al. Low coseismic shear stress on the Tohoku-Oki megathrust determined from laboratory experiments. Science 342,
1211–1214 (2013).
15. Fulton, P. M. et al. Low coseismic friction on the Tohoku-Oki fault determined from temperature measurements. Science 342,
1214–1217 (2013).
16. Expedition 343/343T Scientists. Site C0019. In Proc. IODP (eds. Chester, F. M., Mori, J., et al.) Vol. 343/343T https: //doi.org/10.2204/
iodp.proc.343343T.103.2013 (Integrated Ocean Drilling Program Management International, Inc., 2013).
17. Bangs, N. L. B., Shipley, T. H., Moore, J. C. & Moore, G. F. Fluid accumulation and channeling along the northern Barbados Ridge
decollement thrust. J. Geophys. Res. Solid Earth 104, 20399–20414 (1999).
18. Ranero, C. R. et al. Hydrogeological system of erosional convergent margins and its influence on tectonics and interplate seismo-
genesis. Geochem. Geophys. Geosyst. 9, Q03S04 (2008).
19. Park, J.-O. et al. A deep strong reflector in the Nankai accretionary wedge from multichannel seismic data: Implications for under-
plating and interseismic shear stress release. J. Geophys. Res. Solid Earth 107, ESE 3-1-ESE 3-16 (2002).
20. Bangs, N. L. B. et al. Broad, weak regions of the Nankai megathrust and implications for shallow coseismic slip. Earth Planet. Sci.
Lett. 284, 44–49 (2009).
21. Tanioka, Y. & Seno, T. Sediment effect on tsunami generation of the 1896 Sanriku tsunami earthquake. Geophys. Res. Lett. 28,
3389–3392 (2001).
22. Schnyder, J. S. D. et al. Tsunamis caused by submarine slope failures along western Great Bahama Bank. Sci. Rep. 6, 35925 (2016).
Scientific Reports | (2020) 10:11607 | https://doi.org/10.1038/s41598-020-68449-6 8
Vol:.(1234567890)www.nature.com/scientificreports/
23. Ichihara, H., Hamano, Y., Baba, K. & Kasaya, T. Tsunami source of the 2011 Tohoku earthquake detected by an ocean-bottom
magnetometer. Earth Planet. Sci. Lett. 382, 117–124 (2013).
24. Tappin, D. R. et al. Did a submarine landslide contribute to the 2011 Tohoku tsunami?. Mar. Geol. 357, 344–361 (2014).
25. Lay, T. A review of the rupture characteristics of the 2011 Tohoku-oki Mw 9.1 earthquake. Tectonophysics 733, 4–36 (2018).
26. Yamazaki, Y., Cheung, K. F. & Lay, T. A self-consistent fault slip model for the 2011 Tohoku earthquake and tsunami. J. Geophys.
Res. Solid Earth 123, 1435–1458 (2018).
27. Hydrographic and Oceanographic Department, Japan Coast Guard and JAMSTEC. Compilation of Tohoku-oki bathymetric data
before the 2011 Tohoku-oki earthquake (in Japanese). Seismol. Soc. Jpn. News Lett. 23(2), 35–36 (2011).
28. Tanioka, Y. & Satake, K. Fault parameters of the 1896 Sanriku tsunami earthquake estimated from tsunami numerical modeling.
Geophys. Res. Lett. 23, 1549–1552 (1996).
29. Satake, K., Fujii, Y. & Yamaki, S. Different depths of near-trench slips of the 1896 Sanriku and 2011 Tohoku earthquakes. Geosci.
Lett. 4, 33 (2017).
30. Fujie, G. et al. Spatial variations of incoming sediments at the northeastern Japan arc and their implications for megathrust earth-
quakes. Geology 48, 614–619 (2020).
31. Davis, D., Suppe, J. & Dahlen, F. A. Mechanics of fold-and-thrust belts and accretionary wedges. J. Geophys. Res. 88, 1153–1172
(1983).
32. Tsuru, T. et al. Tectonic features of the Japan Trench convergent margin off Sanriku, northeastern Japan, revealed by multichannel
seismic reflection data. J. Geophys. Res. Solid Earth 105, 16403–16413 (2000).
33. Nakamura, Y. et al. Seismic imaging and velocity structure around the JFAST drill site in the Japan Trench: low Vp, high Vp/Vs in
the transparent frontal prism. Earth Planets Space 66, 121 (2014).
34. Koge, H. et al. Friction properties of the plate boundary megathrust beneath the frontal wedge near the Japan Trench: an inference
from topographic variation. Earth Planets Space 66, 153 (2014).
35. Wessel, P., Smith, W. H. F., Scharroo, R., Luis, J. F. & Wobbe, F. Generic mapping tools: improved version released. EOS Trans. AGU
94(45), 409–410 (2013).
Acknowledgements
We are grateful to Dr. N. Cubas and two anonymous reviewers for their helpful comments and suggestions. The
other two anonymous reviewers for the previous version of the manuscript significantly helped to improve the
quality of the manuscript. We thank captains Hitoshi Tanaka and Yoshiyuki Nakamura and their respective crews
for their help during the seismic cruises. We thank Makoto Ito and colleagues at Nippon Marine Enterprises
Ltd. for their technical support during data acquisition and preliminary data processing. Part of this study was
supported by a Grant-in-Aid for Specially Promoted Research from the Japan Society for Promotion of Science
(JSPS KAKENHI Grant Number JP26000002). Figures 1 and 4 were made with Generic Mapping Tools software35.
Author contributions
Y.N. participated in the seismic surveys as the chief scientist, processed the seismic data, and wrote the manu-
script. Y.N. and S.K. interpreted the seismic profiles. T.F. participated in the Sonne cruise and processed the
bathymetric data. S.K. and S.M. coordinated the seismic surveys. K.O. participated in seismic cruise KY15-14.
All authors discussed the contents of the manuscript.
Competing interests
The authors declare no competing interests.
Additional information
Correspondence and requests for materials should be addressed to Y.N.
Reprints and permissions information is available at www.nature.com/reprints.
Publisher’s note Springer Nature remains neutral with regard to jurisdictional claims in published maps and
institutional affiliations.
Open Access This article is licensed under a Creative Commons Attribution 4.0 International
License, which permits use, sharing, adaptation, distribution and reproduction in any medium or
format, as long as you give appropriate credit to the original author(s) and the source, provide a link to the
Creative Commons license, and indicate if changes were made. The images or other third party material in this
article are included in the article’s Creative Commons license, unless indicated otherwise in a credit line to the
material. If material is not included in the article’s Creative Commons license and your intended use is not
permitted by statutory regulation or exceeds the permitted use, you will need to obtain permission directly from
the copyright holder. To view a copy of this license, visit http://creativecommons.org/licenses/by/4.0/.
© The Author(s) 2020
Scientific Reports | (2020) 10:11607 | https://doi.org/10.1038/s41598-020-68449-6 9
Vol.:(0123456789)You can also read