European bicycle market analysis 2015 - Advocacy means sales - European Cyclists ...
←
→
Page content transcription
If your browser does not render page correctly, please read the page content below
European bicycle market analysis 2015
Advocacy means sales

European Cyclists’ Federation
Edited by: Alexander Scholz
Contributions from: Kevin Mayne, Elina Baltatzi
Contact: office@ecf.com
25.08.2016

 This report is a “snapshot” of the comparison between countries in the 2015 which ECF is
 releasing to inform the ECF Cycling Industry Club’s “Advocacy Summit” at Eurobike on 1st
 September 2016.This data will inform our discussions on the importance of advocacy at the
 national and international level. Thanks to CONEBI for permission to duplicate content from
 their annual reports of the European bicycle market, the reports are the main data resource
 for this report.
      ECF gratefully acknoledges financial support from the European Commission.
 The information and views set out in this report are those of the author(s) and do not necessarily reflect the official opinion of the European
 Union. Neither the European Union institutions and bodies nor any person acting on their behalf may be held responsible for the use which
 may be made of the information contained therein.

                                        MORE PEOPLE CYCLING MORE OFTEN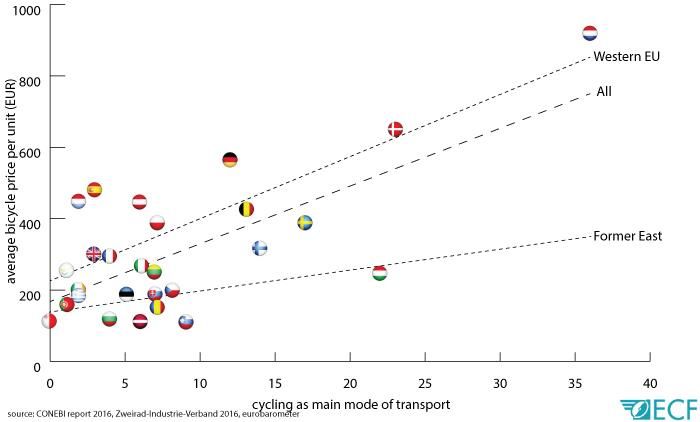
1. About the ECF Cycling Industry Club (CIC) ............................... 3

2. Main findings of this report .................................................. 4

3. Introduction ..................................................................... 6

4. European bicycle market analysis 2015 ................................... 8

   4.1.   Bicycle sales........................................................................ 8
   4.2.   E-bike sales ...................................................................... 12
   4.3.   Average bicycle price ......................................................... 14
   4.4.   Average bicycle expenditure per capita ................................ 17
   4.5.   Sales development............................................................. 19
   4.6.   Upcoming bicycle markets .................................................. 21

                                                                                                    Page 2/22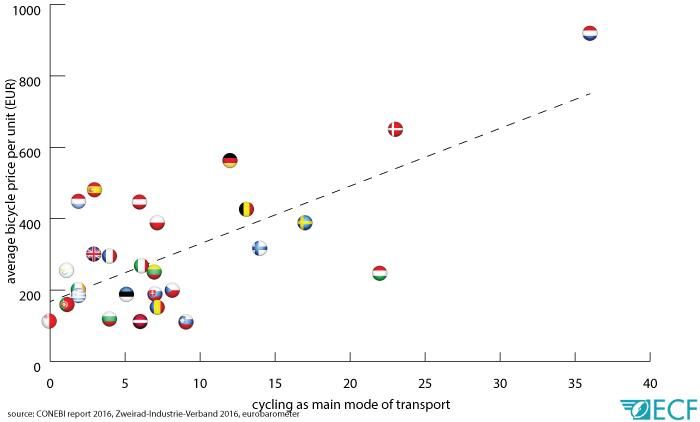
European bicycle market analysis 2015
Cycling Advocacy means sales
ECF Analysis of the CONEBI “EU Bicycle Market Report 2016”
1. About the ECF Cycling Industry Club (CIC)
The Cycling Industry Club is the means for companies in the cycling industry to have an
advocacy voice in Europe, extending their reach and influence. By supporting ECF’s Cycling
Industry Club those companies are putting cycling at the heart of the public policy debate.
Companies that join add their weight to the collective strength of other businesses who are
working to increase cycling. Every Euro is an investment in growing cycling which is good for
everyone’s business.
Helping governments and cities create better places to ride, which gets more people
riding.
More people riding means more people buying bikes and equipment—and that’s good
for business.
Putting cycling’s innovators onto the global new technology agenda, following our
success giving international recognition to bike sharing, e-bikes and cargo bikes.
Supporting job creation. Having put the “Cycling Economy” into international policy,
now ECF’s “Green Jobs” initiative is campaigning to create over 400,000 new cycling
jobs.
Page 3/22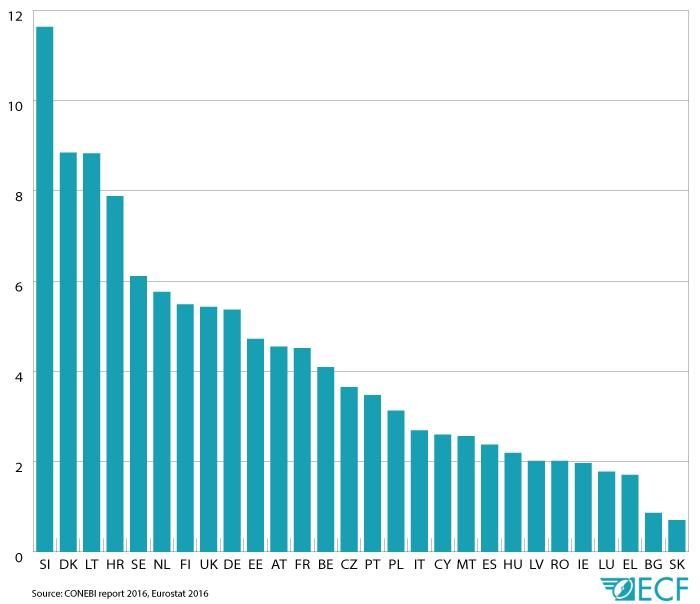
European bicycle market analysis 2015

2. Main findings of this report

First developed in 2012 the ECF methodology of comparing bicycle sales data in the EU on a
per country and per capita basis continues to highlight significant differences in market
performance that are not provided in other published reports.

The analysis creates an important intelligence for the bicycle industry about market trends but
also to cycling advocates in providing correlations between cycling conditions on the ground and
the state of the cycling market. This supports the core purposes of the Cycling Industry Club.

Overall the report confirms the pattern that the share of population cycling daily for transport
purposes continues to be the main determinant of strong cycling market conditions in the EU.
There are clear correlations between cycling mode share and high sales of bikes, high unit prices
and high per capita expenditure by country.

The report on the 2015 market also provides new intelligence on the impact of cycling
conditions on the current and potential markets for e-bikes and the potential for growth in the
overall market when the public sector invests in cycling infrastructure and promotion.

2015 highlights:
    1. The trend for mode share and sales to be linked is most important for determining market
       strength in main cycling markets across and is irrespective of other factors such as the
       tradition of sports cycling. This has been consistent since our first report in 2012.
    2. In particular the relationship between cycling conditions and the market shows in the data
       for “average expenditure per capita on new bicycles” where the values for the world
       foremost cycling transport countries (the Netherlands and Denmark) are more than
       double any other country in Europe. If the 5 largest markets in the EU got to even 50% of
       the Dutch/Danish levels of expenditure this would add about 5 billion to the EU market, a
       huge return on investment for efforts to bring similar infrastructure to other countries.
    3. This correlation is also very strong in sales of e-bikes. It is clear that e-bikes sales per
       country are following mode share, not any other factor like relative wealth or hilliness of
       countries. ECF warns that lack of good underlying cycling conditions such as
       infrastructure may place a cap on e-bikes sales in potential markets like the UK, France
       and Italy.
    4. Of the few countries with a low mode share the UK is the one that most beats the trend in
       terms of unit sales per capita. This suggests that other public sector policies such as fiscal
       incentives for bike purchases can also form part of advocacy to increase sales.
    5. Fiscal policy could also be important in other ways. Growth in average unit price per
       bicycle is not consistent. Countries with relatively lower average earnings/GDP but higher
       mode shares show some unit price increase, but not as clearly as in richer countries. For
       example separating the so called “former eastern bloc” shows that there is very little
       difference in pricing across the whole group, all at the bottom end of EU prices. This has
       policy and market implications, the possibility of significant price development and

                                                                                           Page 4/22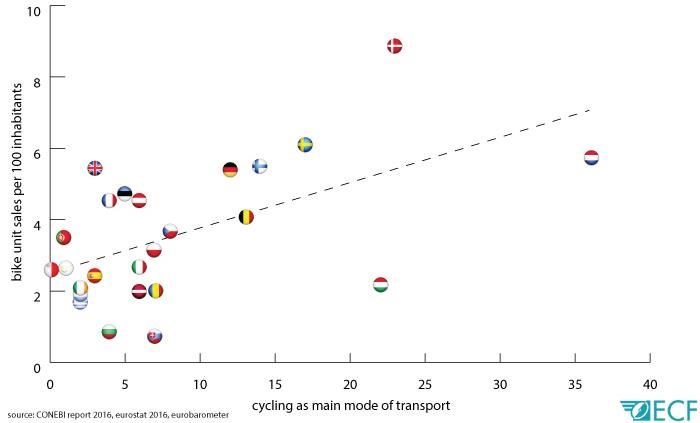
European bicycle market analysis 2015

         introduction of new technologies such as cargo bikes and electrification could be very
         challenging without alternative financing means.

This years’ report adds some year to year trends for the first time. Key findings from this data are:

    1. The bicycle market in Europe has fared much better than the car industry in the period
       since the start of the 2008 recession despite the huge public subsidies given to the
       automotive sector. ECF believes that one of the factors in this trend is the alternative
       support given to cycling by investments in infrastructure.
    2. This trend is even stronger when comparing e-bikes and e-cars where e-bikes are the
       leading form of personalised electro-mobility in the EU by a huge margin.
    3. Average unit prices per bike have also been maintained and increased during the same
       period which is a very healthy market sign. Mature markets tend to reduce average prices
       over time, especially during a recession. The strength of prices can be related to
       introduction of new technologies such as cargo bikes and e-bikes in some countries but
       to maintain overall price increases over this challenging time frame suggests that there is
       still underlying consumer demand across the whole of the EU 28, this is not artificially
       induced demand by discounting.
    4. Comparisons of the growth trend by country show that the top six European growing
       markets are widely spread across the whole continent from Sweden to Romania. ECF
       believes this supports one of the strategies of the ECF Cycling Industry Club from 2011 to
       2016 which is to ensure that advocacy is developed right across the EU. Mode share
       and market growth can be achieved across the EU, hence the reason for investing in
       advocacy development in 15 emerging national advocacy organisations since 2012.
       These results also provide important intelligence for ECF’s advocacy to encourage the use
       of EU funds for growing cycling in all EU countries, growth can be measured in
       commercial terms as well as in cycle use.

                                                                                            Page 5/22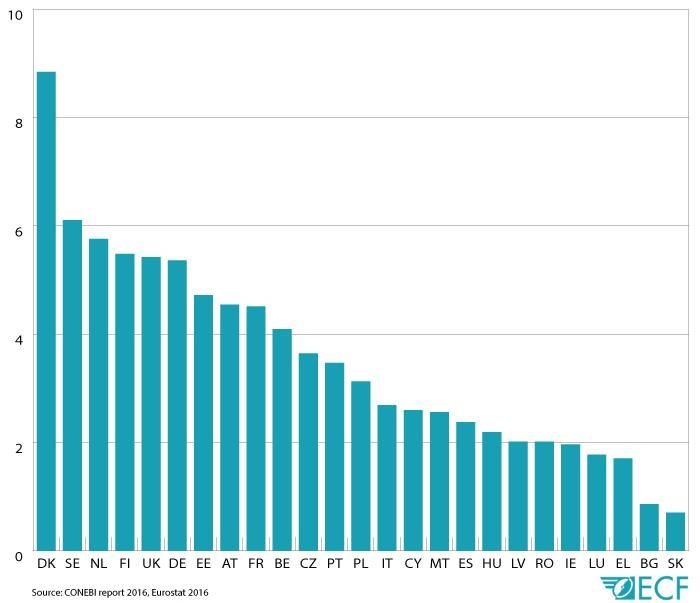
European bicycle market analysis 2015
3. Introduction
One of the most valuable data resources for ECF’s advocacy at the EU level is the annual
market survey by CONEBI, the European bicycle industry body.
Since 2012 we have used it as a basis for additional analysis which part of our “health check”
on the state of cycling across multiple countries and as a valuable source of intelligence for our
colleagues on the ECF Cycling Industry Club and to our national members working for the
promotion of cycling in every EU member state.
CONEBI data has been a valuable contributor to ECF’s development of the “Cycling Economy”
as a lobby tool and to ECF’s Cycling Barometer, the only data analysis to compare cycling in the
EU across 5 distinct metrics and check the “state of cycling” across 28 countries.
This report is a “snapshot” of the comparison between countries in the 2015 which we are
releasing quickly to inform the ECF Cycling Industry Club’s “Advocacy Summit” at Eurobike on
1st September 2016 where the data will inform our discussions on the importance of advocacy at
the national and international level.
Key measures
The unique aspect of ECF’s analysis is to take the sales figures provided by CONEBI and
compare them with other indicators to try and establish some underlying trends in the data.
The main measures we compare include:
Number of units sold per head of population, both for bikes and e-bikes. This gives a real
“state of the market” indication and identifies the strength of markets in smaller countries
that can be overlooked if reporting just concentrates on the larger countries.
The average unit price per bike. This is supplied by CONEBI, we use it as a comparator
because it could give an impression of the “value” ascribed to cycling by consumers and
indicate where there are high added value machine such as e-bikes and cargo bikes
pushing up unit prices. It also guides our work on the need for national schemes to
support bicycle sales through tax incentives and fiscal measures, as bicycle prices increase
this could become increasingly important, especially in low income countries.
Mode share. There is still a significant challenge getting consistent data across the EU on
the amount of daily transport cycling per country, but the EU statistical service
Eurobarometer does publish regular reports based on citizen surveys which give a close
approximation. In 2012 ECF made its first comparison between mode share and bicycle
sales which provided previously unidentified new insight for the bicycle industry on the
importance of urban cycling on market health, and especially pricing.
E-bike sales growth vs e-car sales. This year we include additional analysis on the long
term trends in pedelec sales, especially compared to e-car sales because we recognise
that we have a lobby challenge to show the EU and member state governments that e-
bikes are the most important form of personalised electric mobility in the EU.
Page 6/22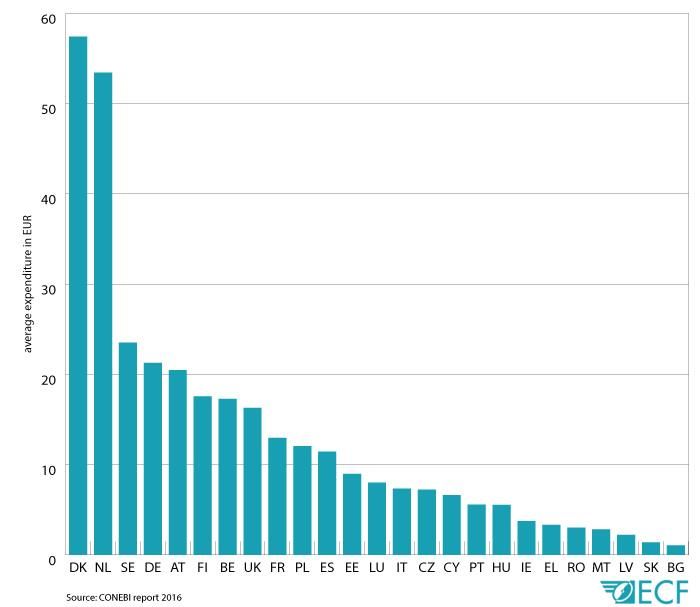
European bicycle market analysis 2015

Additional sources
As well as the CONEBI data we cross check our assumptions and understanding with
background checks from our members and networks. In particular we are grateful for the regular
“market reports” for individual countries which are published on the web site of Bike Europe, the
European bicycle industry publication and media partner of the ECF Cycling Industry Club.

                                                                                       Page 7/22
European bicycle market analysis 2015

4. European bicycle market analysis 2015
      4.1. Bicycle sales
This first test gives a general overview of the state of the bicycle market by country. However it
also confirms some known challenges with the quality of the data. For a number of years
Slovenia has topped the table with the most bike sales per head according to CONEBI data. In
recent years the addition of Croatia to the EU has seen it enter the table in a high position.

Figure 1: Bicycle unit sales per 100 inhabitants 2015

However we know from trade reports that the figures for Slovenia and Croatia are overstated
because the figures include significant onward shipments to other countries.1

It is also believed that there are similar flaws in the data for Lithuania which is a manufacturing
base for exports around the EU. Therefore for consistency we have excluded the data from our
graphics.

Without those three uncertain data sets we see a result that is consistent with market intelligence.
The table is topped (see Figure 1) by a group containing the Nordic countries and the
Netherlands with Denmark way ahead of all its peers.

1
    http://www.bike-eu.com/sales-trends/nieuws/2016/2/slovenian-and-croatian-market-merge-10125674

                                                                                                     Page 8/22
European bicycle market analysis 2015
Figure 2: Bicycle unit sales per 100 inhabitants 2015
In order to test what underlying conditions affect these markets ECF has done a correlation test
with a number of indicators since 2012 and found that the clearest correlation seems to be with
the level of daily cycling as indicated by Eurobarometer, at least at higher modal shares.
Page 9/22European bicycle market analysis 2015
Figure 3: Correlation - Unit sales per 100 inhabitants and cycling as main mode of daily transport 2015
This analysis shows that in high mode share countries there appears to be a significant trend
towards higher unit bicycle sales.
This might be anticipated, people using bikes on a daily basis are more likely to replace their
bikes regularly or upgrade them more often, but what this analysis suggests is that this buying
pattern is more important than any other factor such as sports cycling in determining the relative
size of the market. (Individual country variations are discussed below)
This is important for the health of the bicycle industry in Europe because it provides a prediction
of possible market direction as advocacy succeeds in getting better conditions for cycling in
cities. If conditions for cycling match Denmark the EU bicycle market could grow by as much as
30 million units.
We recognized that there is a broader scatter in the low mode share countries. If this data would
be considered in isolation there is no strong correlation between bicycle sales and mode share to
be identified. However the importance of the ECF analysis is to show what will happen to bicycle
sales as countries move out of the low mode share group, as a result of investments such as
bicycle infrastructure.
Page 10/22European bicycle market analysis 2015
The Figure 3 also shows some of the outlying countries that provide interesting intelligence.
The unexpectedly low number of units per head sold in the Netherlands compared to the
trend is anecdotally believed to be explained by a degree of market saturation or the very
strong second hand market in the Netherlands which suppresses sales a bit.
Possibly significantly worse weather conditions in Scandinavia also cause greater wear
and tear on bikes causing more regular replacement.
The third highest level of daily cycling in Europe is Hungary, but it is understood that
much of this remains historic cycle use in poor rural districts where there is very little
money for new bikes. In that sense the market has some similarity to the reduction in
demand in the Netherland due to continued us of old bikes.
Of the low mode share countries the UK has the most distinctive results. This continues a
long term trend where the UK appears to be different from its neighbors. Two special
features of the UK market are noted that are significant for both the UK market
development and policies for other countries. Sport and recreational cycling are far more
important in the UK than transport compared to any neighbouring countries and this
seems to be reflected in significant uplifts in bike sales compared to comparator
countries, especially after Olympic and Tour de France success.
The UK has an extremely well established fiscal incentive for cycling with the Cycle to
Work scheme giving significant purchase price reductions for bikes up to £1000. Given
the very low mode share for cycling in the UK some of this supports a very healthy market
in bikes for enthusiasts in this price point, many sports style bikes are seen being used for
commuting. ECF has carried out a major study on fiscal incentives across the EU and
believes this is a big opportunity to encourage bicycle sales.
Page 11/22European bicycle market analysis 2015
4.2. E-bike sales
We are able to carry out a similar analysis for pedelec sales from the CONEBI data. In this case
we decided to only take the countries with more than 1000 sales as below this the exact data
was uncertain. To this we added comparable figures for Norway and Switzerland, the other main
European markets.
Figure 4: E-Bike unit sales per 1000 inhabitants 2015
This is very interesting because many market reports about e-bike growth have concentrated on
the Netherland and Germany which in overall size are the biggest in Europe.
However the per-head analysis shows the relative strength of the market in Belgium, Austria,
Denmark and Switzerland. (see Figure 4) ECF’s advocacy groups in those countries are very
active in promoting the benefits of e-mobility and the use of pedelecs compared to e-cars so the
results are very encouraging for their work and for the industry.
Because this is relatively new data we extended our examination of this data by comparing it to
the purchasing power of the country (GDP) and the relatively hilliness from geographical data.
However no correlations were seen.
Once again the most powerful correlation is mode share. Using the same data as for overall
bike sales we found the link was much more accentuated that even for overall bike sales. (for
Norway and Switzerland we used various sources to find a comparable estimate to the
Eurobarometer data for the EU). (see Figure 5)
Page 12/22European bicycle market analysis 2015
In particular we see very strong per capita sales on e-bikes in Denmark where this is not a market
that features in studies of the market growth in the sector. Belgium is known to be ahead of the
expected line because of strong sales in Flanders which is following the pattern of its neighbours
in the Netherlands and also investing substantially in cycling highways which encourage pedelec
sales. ECF’s member associations on Belgium are highly committed to this growth to obtain a
reduction in car use in Belgium which remains high by European standards.
Finland and Sweden appear to be the most promising emerging markets for e-bikes because at
the moment the market looks relatively under-developed compared to similar markets.
This analysis also indicates that the UK, France, Spain and Italy may have a natural cap on the
growth of e-bikes because they do not have the underlying conditions that encourage cycling in
general, for example cycling infrastructure. This points to a need for the industry to engage in
core cycling advocacy alongside the promotion of e-bikes or expected growth in these markets
may not be delivered.
Figure 5: Correlation - E-bike unit sales per 1000 inhabitants and cycling as main mode of daily transport 2015
Page 13/22European bicycle market analysis 2015
4.3. Average bicycle price
This has been one of our most interesting comparisons in recent years. ECF tested assumptions
about the factors that affect unit price in various EU markets. In particular we wanted to see
where we could distinguish the impact of urban cycling separately from the high value of
enthusiasts’ bikes in the sports and mountain biking sectors.
Here we see a much closer correlation in the countries with higher mode shares, but a significant
scatter in low share countries, not all of which can be explained easily.
The relatively low price in Hungary is influenced by a market that mirrors a lot of Eastern
European countries by selling low value bikes for transport, despite its high mode share.
Figure 6: Correlation - average bicycle price and cycling as main mode of transport 2015
This comparison between the former eastern bloc countries and the rest of the EU is even more
apparent if we separate the data between the two groups. From this we see that on the Eastern
group very low average prices continue across all markets and there is little impact of mode
share, however the Western countries are closely clustered around the growth line, especially at
higher mode shares. (see Figure 7 and 8)
Page 14/22
NLEuropean bicycle market analysis 2015
Figure 7: Correlation - average bicycle price and cycling as main mode of daily transport 2015
Figure 8: Correlation - former western bloc cycling economies: Average bicycle price and cycling as main mode
of daily transport 2015
Page 15/22European bicycle market analysis 2015
In general this analysis suggests that the overall profitability of the bicycle market can be heavily
influenced by the amount of daily cycling – because in these high share countries consumers will
be trading up to higher specification urban bikes, cargo bikes, child carriers and now e-bikes.
(The very high unit price in Spain is not explained by any trends that are apparent in other
markets or by the strength of the Spanish economy and demands further investigation)
This has been an important message over the last 2-3 years for the bicycle industry in countries
where the perception has been that only sports bikes attract a premium, typically countries with a
heritage in cycle sport and low to medium mode share – for example Italy and France. To really
push up average prices we need consumers who see bikes as a daily means of transport and a
substitute for a car or season ticket on public transport.
However we do note that this is not a strong enough trend to overcome structural differences
where the purchase price of these higher specification machines is too high relative to average
earnings.
This is important learning for policy makers and advocacy efforts hoping to encourage market
development in fields such as e-bikes and the use of cargo bikes in low income countries such as
the former Eastern bloc. It suggests that fiscal intervention may be a necessary market condition,
either to lower the purchase price of these higher specification bikes through price support
(discounts, subsidies, tax relief) or through more innovation purchasing mechanics such as
leasing, sharing and “pay as you go” schemes linked to travel allowances.
This is particularly relevant to ongoing discussions about the move to phase out or reduce
subsidies of company cars by EU member states, this data suggests that stimulation of e-vehicle
purchasing must include higher value bikes as well as cars or the machines may be
unaffordable. In a market where the average unit price of a bike is below €200 it is hard to
imagine a jump to a viable market of machines costing in excess of €2000 without such support.
Page 16/22European bicycle market analysis 2015
4.4. Average bicycle expenditure per capita
Linking the data for “per capita bicycle sales” and “unit price” we can also see the national
comparison for “expenditure per person on new bicycles” for 2015.
Figure 9: Average expenditure per head on new bicycle purchases 2015 (in EUR)
This is one of the most striking charts in our study, clearly showing that the EU countries that have
invested most in daily cycling have by far the most successful cycling economies. This enables us
to calculate the market potential if countries achieve a mode share for cycling at similar levels to
the Netherlands and Denmark
Table 1: Potential market value
Country Estimated market value Expenditure per capita Market value (Million Market value (Million
(Million €) (€) €) with an expenditure €) with an expenditure
per capita of €30 per capita of €50
Germany 1 727 21 2 436 4 060
Great Britain 1 054 16 1 943 3 238
France 860 13 1 992 3 321
Italy 447 7 1 824 3 040
Poland 458 12 1 140 1 900
Spain 531 11 1 393 2 322
Total 5 077 10 729 17 882
Page 17/22European bicycle market analysis 2015
The table 1 shows the potential growth of market value if there is an increase in the average
expenditure per capita and the bicycle unit sales remains the same. The estimated market value
of the five biggest countries is about 5 billion € in 2015. If these five countries would have about
half of the expenditure per capita (€30) as seen in the Netherlands, the market value would
double to 10 billion €. If the average expenditure would be the same as in the Netherlands (€50)
for this five countries, the market value would triple. Assuming the sales are growing, the market
value would be even higher.
Page 18/22European bicycle market analysis 2015
4.5. Sales development
This year we analysed for the first time some of the linear trends in the data, going back over
previous CONEBI market reports.
In particular we have been looking for two trends.
The health of the EU cycling market compared to other sectors, especially private car
sales.
The emergence of individual markets, especially if we can see the impact of advocacy
work at a national level.
What is particularly encouraging is to see how well bicycle sales have held up in the EU in the
challenging market conditions since the global financial crisis since 2008.
Overall the industry might not report this as a particularly strong growth period, but compared to
the other sectors the results are excellent.
For example if we take annual sales compared to private car registrations in the same period we
can see that car sales slumped much more than the bike sector, even after massive government
subsidies. Clearly market conditions were not strong after the big damage to consumer
confidence and incomes after 2008, but the damage was much less than to the car industry.
Figure 10: New passenger car registrations compared to bike unit sales in EU from 2001 to 2015
We can suggest that this might be because that the bicycle market is much more influenced and
stabilised by so called “indirect subsidy” than the car industry. Where the car industry advocated
Page 19/22European bicycle market analysis 2015
for direct subsidies and scrappage schemes to boost sales the bicycle sector was advocating for
governments to invest in making cycling possible through bike lanes and other cycling
infrastructure. Clearly this has been highly effective in stabilising and even growing the market in
really poor trading conditions. Also it means the conditions have been permanently altered in
favour of cycling by advocacy.
The car industry is still below the annual sales for 2008 despite a recent surge in growth, while
cycling is ahead of that position and thanks to increased investments by cities and governments it
is a strong position for steady growth. The position is even stronger in e-vehicles.
Figure 11: E-Bike unit sales compared to new E-Vehicle registrations in EU from 2010 to 2015
ECF suggests a copy of this graph should be on the desk of every government official in the
whole EU responsible for electric vehicle policy!
Page 20/22European bicycle market analysis 2015
4.6. Upcoming bicycle markets
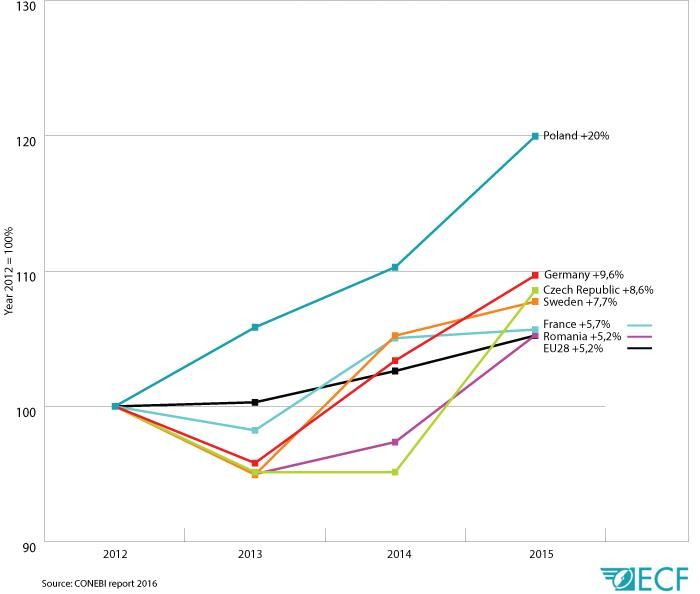
The chart below shows markets with the biggest increase in bicycle sales since 2012. 2
Figure 12: Upcoming bicycle markets - Countries with the biggest increase of bike unit sales since 2012 (Year
2012 = 100%)
We note that 2013 was seen as a very challenging year for the industry, especially in Northern
Europe, which is the result of one of the worst spring weather patterns in history.
However we see from the four years of data that in growing countries there has been a much
more resilient underlying trend.
The second main point highlighted is the diversity of the growing markets, there are strong results
across all regions of the EU and from very different starting points.
Through the ECF Leadership Programme the bicycle industry has been investing in advocacy in
many countries where the case for daily cycling has not been supported by professional industry
or advocacy groups. The evidence of this data set is that commercial growth can be seen in very
diverse markets and therefore the strategy to ensure that all EU countries have effective advocacy
2
For the anlaysis Spain is excluded because the data seems to be distorted, there is a big jump
between two years, further investigastions would be needed to verify the data.
Page 21/22European bicycle market analysis 2015
is important for the health of industry and for the economic convergence of the industry in
Europe.
Figure 13: Average price per bike in EU28 (EUR) from 2012 to 2015
Unit prices show a consistent trend over the same time period. If fact this trend is more stable
than the unit sales growth.
This is very interesting when compared to economic models of price development in mature
industries and industries facing challenges such as a recession.
Typically maturing products show reduced unit pricing over time as manufacturing costs decrease
and competition increases. This is accentuated during periods of crisis. The heavy discounting
and demand for public subsidies by the automotive industry during the recession is the nearest
parallel in the transport sector.
Figure 13 suggests that the bicycle industry did not engage in significant discounting in the
challenging market of 2013 (bad winter and overstocking) and is maintaining price growth
across the EU.
There is a strong influence of new technologies pushing up prices in markets such as the
Netherlands and Denmark as we have shown in earlier graphs. ECF notes that in these countries
the penetration of cargo bikes has preceded the current growth in e-bikes so there is good
evidence that consumers will “trade-up” for a range new technologies in markets where daily
Page 22/22European bicycle market analysis 2015
cycling is strong. This change may be more important to the health of industry than unit sales
growth in the two counties with already high sales figures.
However as this “trading-up” is really limited to a very small number of countries but Figure 13
shows consistent price growth for the whole EU market. ECF concludes that this is evidence that
the EU bicycle market is not showing signs of approaching maturity, it shows that it is growing its
market share as a mode of transportation and this should support long term prices.
Page 23/22You can also read